 Duplex
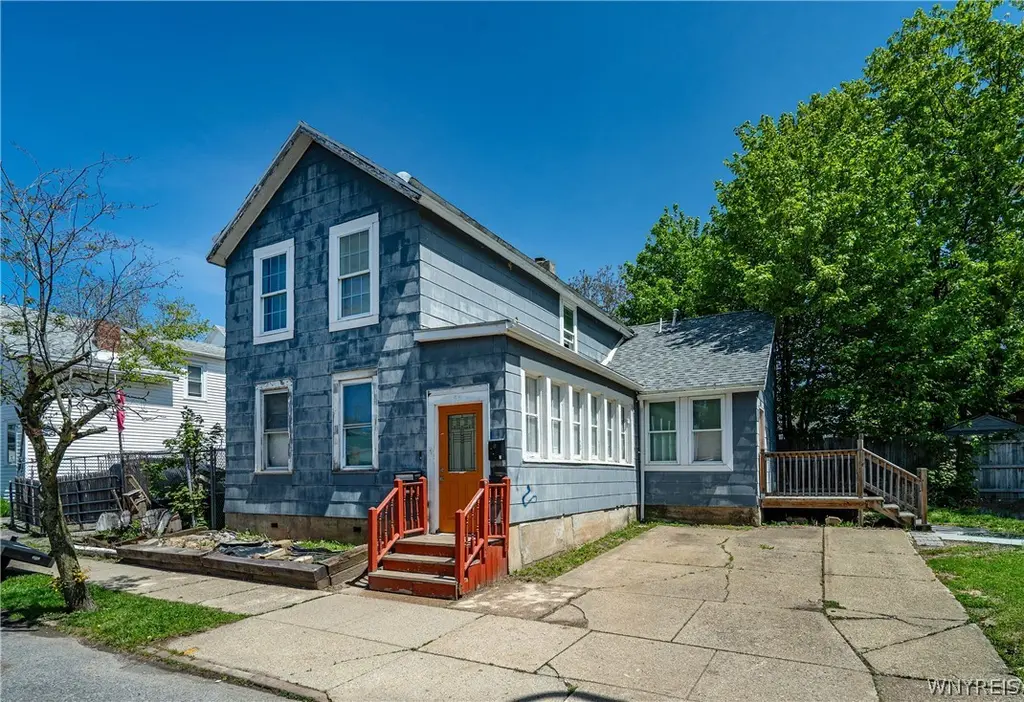
95 10th St · Buffalo, NY
Flood risk 6/10 · Moderate
- FEMA flood zone
- X (unshaded)
- Chance of flooding over 30 yrs
- 0.72%
- Est. flood insurance / yr
- $507 – $1,088
Fire risk 1/10 · Minimal
- Est. fire insurance / yr
- $691 – $1,283
Heat risk 3/10 · Minor
- Hot days now (above 91°F)
- 7 days/yr
- Hot days in 30 yrs
- 15 days/yr
Wind risk 1/10 · Minimal
- Chance of severe wind over 30 yrs
- —
Air-quality risk 4/10 · Minor
- Unhealthy air days now
- 4 days/yr
- Unhealthy air days in 30 yrs
- 9 days/yr
Risk factors via First Street. Map © Google.
Why this score? — see what drove the B grade
The composite is a weighted blend of 9 inputs, each scored 0–100. Each bar is that input's sub-score; the figure is the points it added to the 100-point composite (weight × sub-score).
- Cash flow +30.0/30.0
- 1% rule +10.0/10.0
- DSCR +10.0/10.0
- ARV discount +7.5/15.0
- Livability +3.9/5.0
- Rent growth +3.6/5.0
- Schools +3.3/10.0
- Condition / age +2.5/5.0
- Appreciation +0.0/10.0
$119,900
🖨 Deal sheet 📄 Offer letter ✓ Due diligence
Multi-family units
County records classify this as Multi-Family (2-4 Unit). Listing-text estimate: 2 units. confirmed
Listing remarks
95 10th Street is a centrally located 2-unit home on a double lot with plenty of off-street parking and a fully fenced in yard. the second-floor unit can be occupied as-is and has in unit laundry, while the first-floor unit is demoed/gutted. Tear off roof in 2015. Separate utilities. 1.3 miles to Ralf Wilson Park/Waterfront, 0.8 miles to Downtown Buffalo, 0.9 miles to Allentown, 1.2 miles to the Medical Campus, 1 mile to D'Youville University, and 2.1 miles to the Peace Bridge {Canada). The sale of this property also includes adjacent lot 91 10th Street Buffalo NY 14201, Tax ID : 140200-110-280-0006-031-000 A Hold Harmless form will need to be signed to view the property.
Key facts
- Separate utilities
- Centrally located
- Double lot
Tags
Property features AI
Finance
- Financial info: Tenants are responsible for all utilities; Operating expenses include water and sewer (multi-unit)
Exterior
- Parking: Concrete parking with two or more spaces
- Utilities: Public water connected; Sewer connected
- Home design: Two-story building; Resale property; Residential 2-unit zoning
- Construction: Wood siding construction; Asphalt roof
- Exterior features: Rectangular residential lot; City street frontage
Interior
- Bedrooms: Two-unit property (unit-level bedroom counts not provided)
- Flooring: Hardwood; Laminate; Varies
- Bathrooms: 2 full bathrooms (total)
- Heating & cooling: Gas forced-air heating
- Interior features: Hardwood and laminate flooring; flooring varies by area; Crawl space basement
- Laundry & utility: Gas water heater
Neighborhood map
What this means for you Summary
Snapshot
- This is a 2 × 2-bed/1.0-bath units multifamily listed at $120k.
Deal economics
- At list price, monthly cash flow is $2k ($19k/yr) — positive. Per door: $782/mo.
- The deal already cash-flows at list — no discount required.
- Meets the 1% rule at list price ($3k rent vs $120k).
- Recommended offer: $118k (1.5% below list) — sets the bar for market timing.
- Cap rate 21.9% vs local median 8.0% in Buffalo — top-decile yield for the area; either an underpriced asset or a hidden risk that comps aren't pricing in. Stress-test before assuming the spread holds.
Location & tenants
- Location reads 77/100 on livability (#195 in NY, #3,011 nationally) — a middle-class / working-renter tenant base. Strengths: commute A+, housing A+, health & safety A+; Watch: crime F, employment D-.
- Buffalo City School District (urban): math 41% / reading 40% proficiency, ranked #535 of 590 in NY (top 91%) — families likely to look elsewhere, expect single-tenant / working-renter base with shorter leases; 75% free/reduced lunch — lower-income household profile, screen leases tightly.
- Market conditions: Rents rising fast (+4.3%/yr); 56 active listings in the ZIP; 11 comparable units currently listed for rent nearby; rentals at typical pace (median 20d on market — plan ~3-4 weeks tenant-placement turnaround); lower-income renter base — watch delinquency; 1,244 units permitted in Erie County in 2024 (563 in 5+ unit buildings).
- At $2,887/mo this rent would consume 86% of the median local household income ($41k/yr) (locally 1213% of renters already pay >50% of income on rent) — very limited rent-growth headroom before tenants either downsize or default.
Forward outlook
- Local home prices are declining (-3.0%/yr); year-one equity from $829 of loan paydown is wiped out by about $4k of value loss. Plan a longer hold.
- At projected returns (-3.0% appreciation + 4.3% rent growth), your $34k cash investment doubles in ~3 years — after that, you're playing with house money.
Negotiation context
- It's been on market 29 days — a 2% lower offer ($118k) is reasonable based on typical stale-listing flexibility.
- Current owner paid $23k; list at $120k implies a 421% gain — meaningful room to come down on a strong offer.
Risks & watch-outs
- Watch-outs: built in 1900 — expect roof / HVAC / electrical / plumbing capex.
- Climate carrying-cost: major flood risk — expect insurance premiums to compound above CPI over the hold.
Questions for the listing agent
- Can we see the unit-by-unit rent roll, current vacancy, and any below-market leases? What's the average tenancy length?
- What capital expenditures (roof, boiler, parking lot, exteriors) have been made in the last 5 years, and what's planned in the next 2?
- Built in 1900 — when were the roof, HVAC, electrical panel, plumbing, and water heater last replaced?
- Is there a deadline driving the sale (1031 exchange, divorce, estate, relocation)? That informs how much negotiation room exists.
- Crime grade is F in this area — have there been break-ins, vandalism, or insurance claims at this property in the last 3 years? What carrier currently insures it and at what premium?
- What's the average days-on-market for RENTAL listings here right now (not sales)? A rising rental-DOM trend means longer vacancies and softer asking-rent achievability than the comps imply.
- What's the recent tenant-quality profile in this submarket — average credit score on applications, eviction rate, late-payment / NSF rate, and stable-employment percentage? A property-management company in the area should have these aggregated.
- How much new apartment / multifamily construction is in the pipeline within 1–3 miles? Heavy new supply (>2% of stock underway) typically softens rents 12–24 months out; light construction supports rent growth.
Investment metrics
- 1% rule
- 2.41% ✓
- Cap rate
- 21.95%
- Cash-on-cash
- 55.91%
- DSCR
- 3.49
- GRM
- 3.5
CMA / ARV
- ARV (on-the-fly)
- $283,632
- Comps found
- 12
Show comp detail 12 sales within ~0.75 mi
| Address | Dist | Beds/Ba | Sqft | Sold | Price | $/sf | Match |
|---|---|---|---|---|---|---|---|
| 9 West Ave | 0.17mi | 4/2.0 | 1,980 (+6%) | 6mo | $390,000 | $197 | 77 |
| 125 Whitney Pl | 0.10mi | 4/3.0 | 1,976 (+6%) | 6mo | $310,000 | $157 | 76 |
| 116 West Ave | 0.04mi | 3/2.0 (-1) | 1,692 (-9%) | 4mo | $131,000 | $77 | 74 |
| 192 York St | 0.73mi | 3/2.5 (-1) | 1,884 (+1%) | 1mo | $285,000 | $151 | 57 |
| 402 Busti Ave | 0.42mi | 4/2.0 | 2,028 (+9%) | 14mo | $80,000 | $39 | 54 |
| 147 Mariner St | 0.44mi | 4/3.0 | 2,098 (+12%) | 4mo | $365,000 | $174 | 52 |
| 372 Prospect Ave | 0.32mi | 4/3.0 | 1,660 (-11%) | 17mo | $408,000 | $246 | 49 |
| 403 Busti Ave | 0.39mi | 4/2.0 | 2,132 (+14%) | 12mo | $99,000 | $46 | 48 |
| 533 Busti Ave | 0.58mi | 5/2.0 (+1) | 1,727 (-7%) | 12mo | $162,007 | $94 | 45 |
| 36 Mariner St | 0.27mi | 5/2.0 (+1) | 2,112 (+13%) | 20mo | $250,000 | $118 | 44 |
| 291 West Ave | 0.38mi | 5/2.0 (+1) | 2,140 (+15%) | 12mo | $325,500 | $152 | 43 |
| 145 14th St | 0.68mi | 3/2.0 (-1) | 1,710 (-8%) | 9mo | $281,500 | $165 | 42 |
Match score weights: distance 35% · size 25% · config 20% · recency 20%. Top-matched comps best support the ARV.
Projected returns pro-forma
-3.0% appreciation · 4.28% rent growth · sell at horizon
- IRR
- 55.6%
- Equity multiple
- 3.50×
- Total profit
- $83,934
- Equity at exit
- $17,877
- IRR
- 61.1%
- Equity multiple
- 7.47×
- Total profit
- $217,126
- Equity at exit
- $10,367
Cash invested: $33,572 (down + closing). Projections, not guarantees.
Landlord ↔ Tenant lean methodology
- Overall (STATE)
- 15 Strongly Tenant-Friendly
- State New York
- 15 Strongly Tenant-Friendly · D+10
- County
- — inherits STATE
- City
- — inherits STATE
ZIP-level market 14201
- Home prices YoY
- -19.1%
- Rents YoY
- 4.3%
- Active inventory
- 56
- Price-to-rent
- 6.9×
Monthly cashflow live
- Estimated rent
- $2,887 high interval (Pro) →
- Mortgage (P&I)
- −$629
- Tax from tax record
- −$38 /mo · $454/yr
- Insurance
- −$50
- HOA
- −$0
- Vacancy / Maint / Mgmt
- −$606
- Net cashflow
- $1,564
Break-even live
2-unit breakdown (identical units grouped — click to expand)
| Units | Beds | Baths | Est. rent |
|---|---|---|---|
| 2× units | 2 | 1 | $2,886 |
| #1 | 2 | 1 | $1,443 |
| #2 | 2 | 1 | $1,443 |
| Total (2 units) | $2,887 | ||
UW: 25.0% down · 7.5% · 30yr · 1.5% tax · 5.0% vac · 8.0% maint · 8.0% mgmt
Financing live
Cash to close
- Down payment
- $29,975
- Closing costs
- $3,597
- Reserves months
- —
- Total cash needed
- —
Loan-product check · same deal, 3 products live
Conventional
25% down · 7.5% · 30yr
- Down + closing
- —
- Monthly P&I
- —
- Monthly cashflow
- —
- DSCR
- —
- Eligible?
- —
Personal DTI + credit; lowest rate.
DSCR
20% down · 8.5% · 30yr
- Down + closing
- —
- Monthly P&I
- —
- Monthly cashflow
- —
- DSCR
- —
- Eligible?
- —
No personal income docs; deal must DSCR.
Hard money
10% down · 12.0% · 12mo
- Down + closing
- —
- Monthly P&I
- —
- Monthly cashflow
- —
- DSCR
- —
- Eligible?
- —
Short-term bridge; refi at stabilization.
Rent comps 11 comps
| Address | Beds | Baths | Sqft | Rent | $/sqft | DOM | Units | Dist |
|---|---|---|---|---|---|---|---|---|
| 124 Normal Ave Unit 2 Buffalo, NY | 3.0 | 1.0 | 1727 | $2,000 | $1.16 | 23d | 1 | 0.57mi |
| 550 Busti Ave Unit 2 Buffalo, NY | 3.0 | 1.0 | 1638 | $1,500 | $0.92 | 44d | 1 | 0.59mi |
| 184 14th St Buffalo, NY | 4.0 | 2.0 | 1950 | $4,400 | $2.26 | 23d | 1 | 0.70mi |
| 501 West Ave Buffalo, NY | 3.0 | 1.0 | 2552 | $1,850 | $0.72 | 20d | 1 | 0.76mi |
| 501 West Ave Buffalo, NY | 3.0 | 1.0 | 2552 | $1,700 | $0.67 | 14d | 1 | 0.76mi |
| 118 Ashland Ave Buffalo, NY | 3.0 | 1.0 | 1326 | $1,850 | $1.40 | 14d | 1 | 0.86mi |
| 161 16th St Buffalo, NY | 3.0 | 1.5 | 1500 | $2,000 | $1.33 | 23d | 1 | 0.87mi |
| 330 Bryant St Buffalo, NY | 3.0 | 2.0 | 2224 | $2,200 | $0.99 | 20d | 1 | 0.90mi |
| 237 Main St Buffalo, NY | 1.0–3.0 | 1.5–2.5 | 1608 | $4,035 | $2.51 | 1d | 9 | 1.11mi |
| 405 W Ferry St Unit Lower Buffalo, NY | 3.0 | 1.0 | 2480 | $1,500 | $0.60 | 44d | 1 | 1.34mi |
| 740 Elmwood Ave Buffalo, NY | 3.0 | 1.0 | 2000 | $1,995 | $1.00 | 14d | 1 | 1.50mi |
Listing history 17 events
-
2026-06-18days on market $119,900 Active 29 DOM
-
2026-06-17days on market $119,900 Active 28 DOM
-
2026-06-16days on market $119,900 Active 27 DOM
-
2026-06-15days on market $119,900 Active 26 DOM
-
2026-06-13days on market $119,900 Active 24 DOM
-
2026-06-13days on market $119,900 Active 23 DOM
-
2026-06-10days on market $119,900 Active 21 DOM
-
2026-06-09days on market $119,900 Active 20 DOM
-
2026-06-08days on market $119,900 Active 19 DOM
-
2026-06-07days on market $119,900 Active 18 DOM
-
2026-06-03days on market $119,900 Active 14 DOM
-
2026-06-02days on market $119,900 Active 13 DOM
-
2026-06-01days on market $119,900 Active 12 DOM
-
2026-05-31days on market $119,900 Active 11 DOM
-
2026-05-17$119,900 Active
-
2014-10-31soldstatus $23,000
-
2007-10-03soldstatus $15,900
ⓘ Source: listings_history table (triggers on properties + properties_extension) + one-shot
backfill from property_details.listing_events for pre-trigger history.
Tax reassessment forecast NY · Partial reset (capped growth)
- Current annual tax
- $454 · $38/mo
- Projected year-2 tax
- $1,240 · $103/mo
- Expected delta
- +$786/yr (+$66/mo · 173.2%)
ⓘ Screening estimate from a state-policy table — verify with the county assessor before closing.
Climate risk First Street
- Flood 6/10 Major FEMA zone X (unshaded) · 72% chance over 30 yrs
- Wildfire 1/10 Low
- Heat 3/10 Moderate 7 d/yr ≥91°F today · 15 d/yr by 30 yrs out
- Wind 1/10 Low
- Air quality 4/10 Moderate 4 unhealthy d/yr today · 9 by 30 yrs out
Nearby sold comps map
Loading sold comps map…
Walkable amenities ~0.75 mi
Loading nearby amenities…
Taxation est. · year 1
- Rental income
- $34,644
- − Mortgage interest
- −$6,716
- − Property taxes
- −$454
- − Insurance
- −$600
- − Repairs & maintenance
- −$2,772
- − Management
- −$2,772
- − Depreciation
- −$3,488
- Taxable income
- $17,843
- Est. tax owed @ 24.0%
- −$4,282
- After-tax cash flow
- $14,488/yr
For passive investors: Depreciation is non-cash, so a rental often shows a tax loss while cash-flowing — sheltering income. Rental losses are passive: they offset passive income freely, and up to $25,000/yr can offset ordinary (W-2) income if you actively participate and your MAGI is under $100k (phasing out to $0 by $150k); unused losses carry forward. On sale, claimed depreciation is recaptured at up to 25%, and gains may owe capital-gains tax (a 1031 exchange can defer both). Figures are a year-1 estimate at your 24.0% rate — not tax advice; consult a CPA.
Schools (NCES district)
- District
- Buffalo City School District
- NCES district ID
- 3605850
- Math proficiency
- 41% ▲ 11.00%
- Reading proficiency
- 40% ▲ 7.00%
- Median HH income
- $31,665
- Composite
- 33.17/100
- National rank
- #5544
- State rank
- #535 of 590 in NY
Livability — Buffalo
- Score
- 77/100
- State rank
- #195
- US rank
- #3011
Category grades
Schools grade is shown separately in the Schools card above.
Census & demographics
- Census place
- Buffalo, NY
- County
- Erie County · 714,559 people
- City population
- 440,021
- Metro
- Buffalo-Cheektowaga, NY
- Population (ZIP)
- 12,369
- Household income
- $40,512
- Rent vs Own
- Severe rent burden
- 1213.0
Population outlook (Erie County) Hauer SSP2
- Today (2025)
- 933,037 people
- By 2030
- 935,181 · +0.2%
- By 2040
- 928,531 · -0.5%
- By 2050
- 905,725 · -2.9%
- By 2075
- 834,037 · -10.6%
- By 2100
- 708,033 · -24.1%
Race, ethnicity, and origin ACS 2023
- Neighborhood character
- Diverse neighborhood (Simpson 0.66)
- Race & ethnicity
- White 42% Hispanic / Latino 36% Black 16% Two or more races 12% Asian 2% Native American 1%
- Hispanic origin (detail)
- Mexican 4% Puerto Rican 30% Dominican 1%
- Common ancestry
- Romanian 7% Subsaharan African 2% Slovak 1%
- Foreign-born
- 8% · Canada, China
- Languages at home
- 69% English-only · Spanish 24% Arabic 2% Other Indo-European 1%
Political lean MEDSL · Erie
- 2024 margin
- Lean D (+9.7) · D 54.8% · R 45.2%
- 2008→2024 swing
- -7.9pp toward R · 2008: 17.5pp · 2024: 9.7pp
- All cycles
- 2024: D+9.7 2020: D+14.7 2016: D+4.8 2012: D+15.6 2008: D+17.5
Not yet ingested
- Civics
- —
Market trends
- HPI YoY
- ▼ -68.73%
- Current HPI
- 290.2643
- Rent YoY
- ▲ 4.28%
- Metro
- Buffalo-Cheektowaga, NY
- State GDP YoY
- ▲ 2.60%
- F500 in state
- 92
Industry mix (Fortune 500 HQ in NY)
| Industry | F500 HQs | Revenue |
|---|---|---|
| Financial Services | 10 | $950B |
|
||
| Consumer Goods | 9 | $162B |
|
||
| Insurance | 4 | $225B |
|
||
| Telecommunications | 2 | $144B |
|
||
| Pharmaceuticals | 2 | $112B |
|
||
| Media / Entertainment | 2 | $69B |
|
||
Price history
+654.1% since first listed3 events — show timeline
- 2026-05-17 Listed $119,900 WNYREIS
- 2014-10-31 Sold (Public Records) $23,000 Public Records
- 2007-10-03 Sold (Public Records) $15,900 Public Records
Property tax history
+9.8%/yrLatest (2025): $454 · +0.0% YoY. Source: county tax records.
Cash-flow waterfall
monthlySold comps — $/sqft
last 12 mo · ≤1 miLoading sold comps…