206 Piney Point Dr NW · Cullman, AL
Flood risk 1/10 · Minimal
- FEMA flood zone
- X (unshaded)
- Chance of flooding over 30 yrs
- 0.0%
- Est. flood insurance / yr
- $507 – $1,088
Fire risk 4/10 · Minor
- Est. fire insurance / yr
- $916 – $1,700
Heat risk 5/10 · Moderate
- Hot days now (above 105°F)
- 7 days/yr
- Hot days in 30 yrs
- 18 days/yr
Wind risk 4/10 · Minor
- Chance of severe wind over 30 yrs
- 24.0%
Air-quality risk 2/10 · Minimal
- Unhealthy air days now
- 2 days/yr
- Unhealthy air days in 30 yrs
- 2 days/yr
Risk factors via First Street. Map © Google.
Why this score? — see what drove the C grade
The composite is a weighted blend of 9 inputs, each scored 0–100. Each bar is that input's sub-score; the figure is the points it added to the 100-point composite (weight × sub-score).
- Cash flow +20.7/30.0
- ARV discount +15.0/15.0
- DSCR +6.6/10.0
- 1% rule +4.5/10.0
- Schools +4.3/10.0
- Livability +3.6/5.0
- Rent growth +2.5/5.0
- Condition / age +2.5/5.0
- Appreciation +0.0/10.0
$159,900
🖨 Deal sheet 📄 Offer letter ✓ Due diligence
Listing remarks MLS
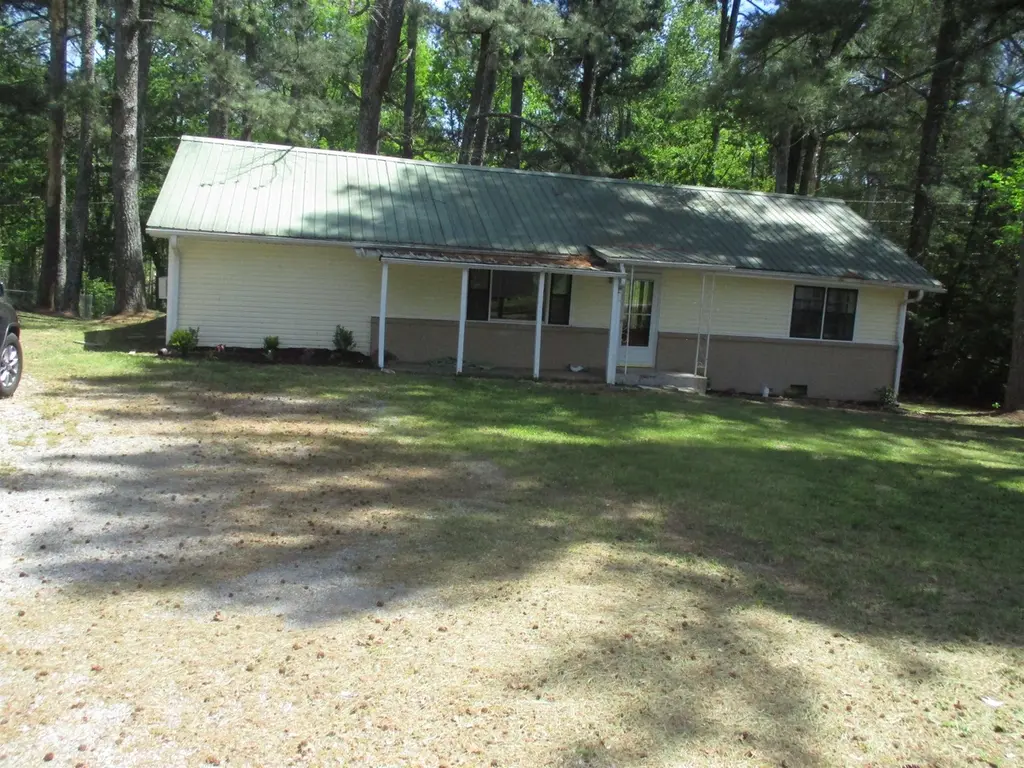
THIS IS A TWO BEDROOM, ONE BATH HOUSE WITH METAL ROOF. HAS A LARGE ROOM THAT COULD BE USED AS A THIRD BEDROOM OR DEN. WOULD BE A GREAT STARTER HOME OR A GREAT INVESTMENT/RENTAL PROPERTY. THIS HOUSE SITS ON A 1 ACRE LOT IN THE CITY OF CULLMAN.
Key facts
- 1 acre lot
- Built 1978
- Listed 64 days
Neighborhood map
What this means for you Summary
Snapshot
- This is a 3-bed/1.0-bath single-family listed at $160k.
Deal economics
- At list price, monthly cash flow is $215 ($3k/yr) — positive.
- The deal already cash-flows at list — no discount required.
- To meet the 1% rule (rent ≥ 1% of price), the offer needs to be $152k (5.2% below list).
- Recommended offer: $150k (6.0% below list) — sets the bar for market timing.
- Cap rate 7.9% vs local median 3.8% in Cullman — top-decile yield for the area; either an underpriced asset or a hidden risk that comps aren't pricing in. Stress-test before assuming the spread holds.
Location & tenants
- Location reads 71/100 on livability (#36 in AL) — a middle-class / working-renter tenant base. Strengths: cost of living A+, housing A+, schools B; Watch: amenities C-, commute F, health & safety F.
- Cullman City (town): math 38% / reading 65% proficiency, ranked #13 of 129 in AL (top 10%) — acceptable for families but not a draw, mixed tenant base, ~2y average lease.
- Market conditions: 339 active listings in the ZIP; 180 units permitted in Cullman County in 2024 (0 in 5+ unit buildings).
- This rent runs 31% of the median local income ($58k/yr) — at the standard rent-burdened threshold; future hikes will face affordability resistance.
Forward outlook
- Local home prices are declining (-3.0%/yr); year-one equity from $1k of loan paydown is wiped out by about $5k of value loss. Plan a longer hold.
Negotiation context
- It's been on market 65 days — a 6% lower offer ($150k) is reasonable based on typical stale-listing flexibility.
- 2 sale attempts since 4y ago; this cycle's ask has dropped $10k (6%) from the opening price — seller is motivated, your offer sets the floor, not the list.
- Current owner paid $70k; list at $160k implies a 128% gain — meaningful room to come down on a strong offer.
Risks & watch-outs
- Climate carrying-cost: extreme-heat days projected 7→18/yr by 2055 (HVAC capex compounding) — expect insurance premiums to compound above CPI over the hold.
Questions for the listing agent
- It's been on market 65 days. Have you received any prior offers? Is the seller open to a 6% concession, seller financing, or rate buy-down credit?
- Built in 1978 — when were the roof, HVAC, electrical panel, plumbing, and water heater last replaced?
- Why hasn't it sold? Are there any deal-killer items the seller is aware of (foundation, flood, title, zoning, code violations)?
- Is there a deadline driving the sale (1031 exchange, divorce, estate, relocation)? That informs how much negotiation room exists.
- Schools are B-rated — typically a magnet for longer-tenancy family renters. What's the average tenant stay here, and is there a school-zone premium baked into asking?
- What's the average days-on-market for RENTAL listings here right now (not sales)? A rising rental-DOM trend means longer vacancies and softer asking-rent achievability than the comps imply.
- What's the recent tenant-quality profile in this submarket — average credit score on applications, eviction rate, late-payment / NSF rate, and stable-employment percentage? A property-management company in the area should have these aggregated.
- How much new for-sale + rental construction is in the pipeline within 1–3 miles? Heavy new supply typically softens prices + rents 12–24 months out; constrained supply supports both.
Investment metrics
- 1% rule
- 0.95% ✗
- Cap rate
- 7.91%
- Cash-on-cash
- 5.77%
- DSCR
- 1.26
- GRM
- 8.8
CMA / ARV
- ARV (median comp)
- $221,259
- List price
- $159,900
- Delta
- -27.73%
- Verdict
- UNDERPRICED
- Comps
- 20 within 1.0 mi
Show comp detail 10 sales within ~0.75 mi
| Address | Dist | Beds/Ba | Sqft | Sold | Price | $/sf | Match |
|---|---|---|---|---|---|---|---|
| 204 Piney Point Dr NW | 0.02mi | 3/2.0 | 1,445 (-9%) | 12mo | $203,000 | $140 | 71 |
| 204 NW Piney Dr | 0.02mi | 3/2.0 | 1,445 (-9%) | 12mo | $203,000 | $140 | 71 |
| 605 Dale Ave NW | 0.27mi | 3/2.5 | 1,686 (+7%) | 5mo | $221,800 | $132 | 66 |
| 1613 Ward Dr NW | 0.35mi | 2/2.5 (-1) | 1,656 (+5%) | 0mo | $175,000 | $106 | 65 |
| 1543 Scott St NW | 0.44mi | 3/1.5 | 1,560 (-1%) | 15mo | $175,000 | $112 | 63 |
| 612 Reid Dr NW | 0.36mi | 3/2.0 | 1,480 (-6%) | 8mo | $285,000 | $193 | 62 |
| 806 Lakeview Ave NW | 0.48mi | 3/2.0 | 1,684 (+6%) | 10mo | $239,900 | $142 | 54 |
| 1631 Warnke Rd | 0.23mi | 3/2.0 | 1,364 (-14%) | 18mo | $212,500 | $156 | 47 |
| 1108 St Joseph Dr NW | 0.68mi | 4/2.0 (+1) | 1,568 (-1%) | 13mo | $225,000 | $143 | 47 |
| 1020 St Joseph Dr NW | 0.66mi | 3/2.0 | 1,382 (-13%) | 1mo | $290,000 | $210 | 44 |
Match score weights: distance 35% · size 25% · config 20% · recency 20%. Top-matched comps best support the ARV.
Projected returns pro-forma
-3.0% appreciation · 3.0% rent growth · sell at horizon
- IRR
- -7.4%
- Equity multiple
- 0.73×
- Total profit
- $-12,259
- Equity at exit
- $23,842
- IRR
- 2.1%
- Equity multiple
- 1.15×
- Total profit
- $6,757
- Equity at exit
- $13,825
Cash invested: $44,772 (down + closing). Projections, not guarantees.
Landlord ↔ Tenant lean methodology
- Overall (STATE)
- 90 Strongly Landlord-Friendly
- State Alabama
- 90 Strongly Landlord-Friendly · R+15
- County
- — inherits STATE
- City
- — inherits STATE
ZIP-level market 35055
- Home prices YoY
- -14.4%
- Active inventory
- 339
- Price-to-rent
- 8.8×
Monthly cashflow live
- Estimated rent
- $1,516 medium interval (Pro) →
- Mortgage (P&I)
- −$839
- Tax from tax record
- −$77 /mo · $926/yr
- Insurance
- −$67
- HOA
- −$0
- Vacancy / Maint / Mgmt
- −$318
- Net cashflow
- $215
Break-even live
UW: 25.0% down · 7.5% · 30yr · 1.5% tax · 5.0% vac · 8.0% maint · 8.0% mgmt
Financing live
Cash to close
- Down payment
- $39,975
- Closing costs
- $4,797
- Reserves months
- —
- Total cash needed
- —
Loan-product check · same deal, 3 products live
Conventional
25% down · 7.5% · 30yr
- Down + closing
- —
- Monthly P&I
- —
- Monthly cashflow
- —
- DSCR
- —
- Eligible?
- —
Personal DTI + credit; lowest rate.
DSCR
20% down · 8.5% · 30yr
- Down + closing
- —
- Monthly P&I
- —
- Monthly cashflow
- —
- DSCR
- —
- Eligible?
- —
No personal income docs; deal must DSCR.
Hard money
10% down · 12.0% · 12mo
- Down + closing
- —
- Monthly P&I
- —
- Monthly cashflow
- —
- DSCR
- —
- Eligible?
- —
Short-term bridge; refi at stabilization.
Listing history 20 events
-
2026-06-19days on market $159,900 Active 65 DOM
-
2026-06-18days on market $159,900 Active 64 DOM
-
2026-06-17days on market $159,900 Active 63 DOM
-
2026-06-16days on market $159,900 Active 62 DOM
-
2026-06-15days on market $159,900 Active 61 DOM
-
2026-06-14days on market $159,900 Active 59 DOM
-
2026-06-12days on market $159,900 Active 58 DOM
-
2026-06-09days on market $159,900 Active 55 DOM
-
2026-06-08days on market $159,900 Active 54 DOM
-
2026-06-07days on market $159,900 Active 53 DOM
-
2026-06-05pricedays on market $159,900 Active 50 DOM
-
2026-06-03days on market $169,900 Active 49 DOM
-
2026-06-02days on market $169,900 Active 48 DOM
-
2026-06-01days on market $169,900 Active 47 DOM
-
2026-05-31days on market $169,900 Active 46 DOM
-
2026-05-30days on market $169,900 Active 45 DOM
-
2026-04-15$169,900 Active 242-char remark
Show marketing remark (242 chars)
THIS IS A TWO BEDROOM, ONE BATH HOUSE WITH METAL ROOF. HAS A LARGE ROOM THAT COULD BE USED AS A THIRD BEDROOM OR DEN. WOULD BE A GREAT STARTER HOME OR A GREAT INVESTMENT/RENTAL PROPERTY. THIS HOUSE SITS ON A 1 ACRE LOT IN THE CITY OF CULLMAN.
-
2022-04-28soldstatus $70,000
-
2022-04-27soldstatus $70,000 38-char remark
Show marketing remark (38 chars)
Great house in the city. 3 bed 1 bath.
-
2022-04-26$70,000 38-char remark
Show marketing remark (38 chars)
Great house in the city. 3 bed 1 bath.
ⓘ Source: listings_history table (triggers on properties + properties_extension) + one-shot
backfill from property_details.listing_events for pre-trigger history.
Tax reassessment forecast AL · Resets to sale price
- Current annual tax
- $926 · $77/mo
- Projected year-2 tax
- $926 · $77/mo
- Expected delta
- $0/yr ($0/mo · 0.0%)
ⓘ Screening estimate from a state-policy table — verify with the county assessor before closing.
Climate risk First Street
- Flood 1/10 Low FEMA zone X (unshaded) · 0% chance over 30 yrs
- Wildfire 4/10 Moderate
- Heat 5/10 Major 7 d/yr ≥105°F today · 18 d/yr by 30 yrs out
- Wind 4/10 Moderate 24% chance of damaging wind over 30 yrs
- Air quality 2/10 Low 2 unhealthy d/yr today · 2 by 30 yrs out
Nearby sold comps map
Loading sold comps map…
Walkable amenities ~0.75 mi
Loading nearby amenities…
Taxation est. · year 1
- Rental income
- $18,189
- − Mortgage interest
- −$8,957
- − Property taxes
- −$926
- − Insurance
- −$800
- − Repairs & maintenance
- −$1,455
- − Management
- −$1,455
- − Depreciation
- −$4,652
- Taxable loss
- −$55
- Est. tax savings @ 24.0%
- +$13
- After-tax cash flow
- $2,595/yr
For passive investors: Depreciation is non-cash, so a rental often shows a tax loss while cash-flowing — sheltering income. Rental losses are passive: they offset passive income freely, and up to $25,000/yr can offset ordinary (W-2) income if you actively participate and your MAGI is under $100k (phasing out to $0 by $150k); unused losses carry forward. On sale, claimed depreciation is recaptured at up to 25%, and gains may owe capital-gains tax (a 1031 exchange can defer both). Figures are a year-1 estimate at your 24.0% rate — not tax advice; consult a CPA.
Schools (NCES district)
- District
- Cullman City
- NCES district ID
- 0100990
- Math proficiency
- 38% ▼ -32.00%
- Reading proficiency
- 65% ▼ -1.00%
- Median HH income
- $38,339
- Composite
- 42.81/100
- National rank
- #3140
- State rank
- #13 of 129 in AL
Livability — Cullman
- Score
- 71/100
- State rank
- #36
- US rank
- #6789
Category grades
Schools grade is shown separately in the Schools card above.
Census & demographics
- Census place
- Cullman, AL
- County
- Cullman County · 47,767 people
- City population
- 34,660
- Metro
- Cullman, AL
- Population (ZIP)
- 23,115
- Household income
- $58,405
- Rent vs Own
- Severe rent burden
- 499.0
Population outlook (Cullman County) Hauer SSP2
- Today (2025)
- 84,522 people
- By 2030
- 85,402 · +1.0%
- By 2040
- 86,152 · +1.9%
- By 2050
- 85,202 · +0.8%
- By 2075
- 79,679 · -5.7%
- By 2100
- 66,943 · -20.8%
Race, ethnicity, and origin ACS 2023
- Neighborhood character
- Predominantly White (91%)
- Race & ethnicity
- White 91% Two or more races 6% Hispanic / Latino 3% Black 1%
- Common ancestry
- Italian 3% Serbian 2% Romanian 2%
- Foreign-born
- 2% · Canada
- Languages at home
- 97% English-only · Spanish 3%
Political lean MEDSL · Cullman
- 2024 margin
- Solid R (+80.5) · D 9.4% · R 89.9%
- 2008→2024 swing
- -15.3pp toward R · 2008: -65.2pp · 2024: -80.5pp
- All cycles
- 2024: R+80.5 2020: R+77.4 2016: R+77.8 2012: R+69.5 2008: R+65.2
Not yet ingested
- Civics
- —
Market trends
- HPI YoY
- ▼ -43.60%
- Current HPI
- 259.5471
- Rent YoY
- —
- Metro
- Cullman, AL
- State GDP YoY
- ▲ 2.94%
- F500 in state
- 4
Industry mix (Fortune 500 HQ in AL)
| Industry | F500 HQs | Revenue |
|---|---|---|
| Financial Services | 1 | $8B |
|
||
| Healthcare | 1 | $5B |
|
||
Price history
+142.7% since first listed4 events — show timeline
- 2026-04-15 Listed $169,900 SAARMLS
- 2022-04-28 Sold (Public Records) $70,000 Public Records
- 2022-04-27 Sold (MLS) $70,000 SAARMLS
- 2022-04-26 Listed $70,000 SAARMLS
Property tax history
+4.0%/yrLatest (2025): $926 · +6.8% YoY. Source: county tax records.
Cash-flow waterfall
monthlySold comps — $/sqft
last 12 mo · ≤1 miLoading sold comps…