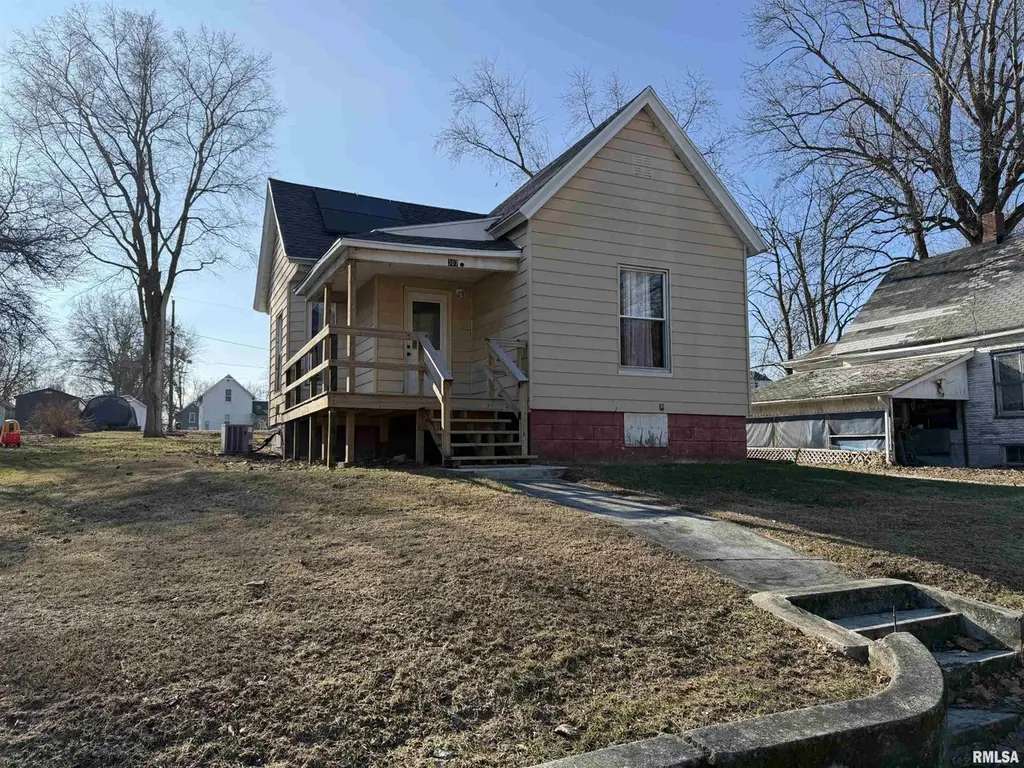
307 Clinton St · Avon, IL
Flood risk 1/10 · Minimal
- FEMA flood zone
- X (unshaded)
- Chance of flooding over 30 yrs
- 0.0%
- Est. flood insurance / yr
- $473 – $860
Fire risk 1/10 · Minimal
- Est. fire insurance / yr
- $804 – $1,492
Heat risk 3/10 · Minor
- Hot days now (above 105°F)
- 7 days/yr
- Hot days in 30 yrs
- 18 days/yr
Wind risk 2/10 · Minimal
- Chance of severe wind over 30 yrs
- —
Air-quality risk 2/10 · Minimal
- Unhealthy air days now
- 1 days/yr
- Unhealthy air days in 30 yrs
- 1 days/yr
Risk factors via First Street. Map © Google.
Why this score? — see what drove the B+ grade
The composite is a weighted blend of 9 inputs, each scored 0–100. Each bar is that input's sub-score; the figure is the points it added to the 100-point composite (weight × sub-score).
- Cash flow +30.0/30.0
- DSCR +10.0/10.0
- ARV discount +9.6/15.0
- 1% rule +8.8/10.0
- Appreciation +6.3/10.0
- Schools +5.0/10.0
- Livability +2.8/5.0
- Rent growth +2.5/5.0
- Condition / age +2.5/5.0
$69,000
🖨 Deal sheet (PDF) 📄 Offer letter ✓ Due diligence
Listing remarks MLS
This charming 2-bedroom, 1-bath home is full of character and sits on a generously sized lot with plenty of room to enjoy the outdoors. Step inside to a spacious eat-in kitchen featuring eye-catching exposed brick, creating a warm and inviting atmosphere perfect for everyday living and entertaining. The large living room is filled with natural light and offers a comfortable space to relax. Recent updates include replacement windows, new flooring throughout, and a beautifully remodeled bathroom. An unfinished basement provides excellent storage. Call to schedule your private showing today!
Key facts
- Exposed brick
- Remodeled bathroom
- New flooring
Tags
Neighborhood map
What this means for you Summary
Snapshot
- This is a 2-bed/1.0-bath single-family listed at $69k.
Deal economics
- At list price, monthly cash flow is $313 ($4k/yr) — positive.
- The deal already cash-flows at list — no discount required.
- Meets the 1% rule at list price ($953 rent vs $69k).
- Recommended offer: $61k (12.0% below list) — sets the bar for market timing.
Location & tenants
- Location reads 56/100 on livability (#1,220 in IL) — a working-class tenant base; expect higher turnover. Strengths: cost of living A+, housing A; Watch: schools F, crime F, amenities F.
- Market conditions: 9 active listings in the ZIP; 14 units permitted in Fulton County in 2024 (0 in 5+ unit buildings).
Forward outlook
- In year one you build about $2k of equity ($477 loan paydown + $2k appreciation (2.6% local appreciation)).
- Fulton County population projected at -20% by 2050 — secular population decline; favor cash flow + early exit over multi-decade hold.
- At projected returns (2.6% appreciation + 3.0% rent growth), your $19k cash investment doubles in ~4 years — after that, you're playing with house money.
Negotiation context
- It's been on market 155 days — a 12% lower offer ($61k) is reasonable based on typical stale-listing flexibility.
- 2 sale attempts since 13y ago; this cycle's ask has dropped $6k (8%) from the opening price — seller is motivated, your offer sets the floor, not the list.
- Current owner paid $8k; list at $69k implies a 762% gain — meaningful room to come down on a strong offer.
Risks & watch-outs
- Watch-outs: built in 1930 — expect roof / HVAC / electrical / plumbing capex.
Questions for the listing agent
- It's been on market 155 days. Have you received any prior offers? Is the seller open to a 12% concession, seller financing, or rate buy-down credit?
- Built in 1930 — when were the roof, HVAC, electrical panel, plumbing, and water heater last replaced?
- Why hasn't it sold? Are there any deal-killer items the seller is aware of (foundation, flood, title, zoning, code violations)?
- Is there a deadline driving the sale (1031 exchange, divorce, estate, relocation)? That informs how much negotiation room exists.
- Schools are F-rated, which usually means shorter tenancies and higher turnover. Who's the typical renter profile here, and what's been the actual vacancy rate?
- Crime grade is F in this area — have there been break-ins, vandalism, or insurance claims at this property in the last 3 years? What carrier currently insures it and at what premium?
- What's the average days-on-market for RENTAL listings here right now (not sales)? A rising rental-DOM trend means longer vacancies and softer asking-rent achievability than the comps imply.
- What's the recent tenant-quality profile in this submarket — average credit score on applications, eviction rate, late-payment / NSF rate, and stable-employment percentage? A property-management company in the area should have these aggregated.
- How much new for-sale + rental construction is in the pipeline within 1–3 miles? Heavy new supply typically softens prices + rents 12–24 months out; constrained supply supports both.
Investment metrics
- 1% rule
- 1.38% ✓
- Cap rate
- 11.73%
- Cash-on-cash
- 19.42%
- DSCR
- 1.86
- GRM
- 6.0
CMA / ARV
- ARV (median comp)
- $72,347
- List price
- $69,000
- Delta
- -4.63%
- Verdict
- FAIR
- Comps
- 10 within 1.0 mi
Show comp detail 2 sales within ~0.75 mi
| Address | Dist | Beds/Ba | Sqft | Sold | Price | $/sf | Match |
|---|---|---|---|---|---|---|---|
| 403 E Wood St | 0.13mi | 2/2.0 | 1,182 (+13%) | 7mo | $34,000 | $29 | 63 |
| 307 W Wood St | 0.37mi | 2/1.0 | 1,120 (+7%) | 21mo | $90,000 | $80 | 54 |
Match score weights: distance 35% · size 25% · config 20% · recency 20%. Top-matched comps best support the ARV.
Projected returns pro-forma
2.61% appreciation · 3.0% rent growth · sell at horizon
- IRR
- 24.9%
- Equity multiple
- 2.39×
- Total profit
- $26,792
- Equity at exit
- $29,505
- IRR
- 26.1%
- Equity multiple
- 4.59×
- Total profit
- $69,269
- Equity at exit
- $44,323
Cash invested: $19,320 (down + closing). Projections, not guarantees.
Landlord ↔ Tenant lean methodology
- Overall (STATE)
- 43 Moderately Tenant-Leaning
- State Illinois
- 43 Moderately Tenant-Leaning · D+7
- County
- — inherits STATE
- City
- — inherits STATE
ZIP-level market 61415
- Home prices YoY
- 1.7%
- Active inventory
- 9
- Price-to-rent
- 6.0×
Monthly cashflow live
- Estimated rent
- $953 medium interval (Pro) →
- Mortgage (P&I)
- −$362
- Tax from tax record
- −$49 /mo · $593/yr
- Insurance
- −$29
- HOA
- −$0
- Vacancy / Maint / Mgmt
- −$200
- Net cashflow
- $313
Break-even live
Sensitivity live
| Price | -10% $352 | -5% $332 | +0% $313 | +5% $293 | +10% $274 |
|---|---|---|---|---|---|
| Rent | -10% $237 | -5% $275 | +0% $313 | +5% $350 | +10% $388 |
| Rate | -1.0pp $347 | -0.5pp $330 | base $313 | +0.5pp $295 | +1.0pp $277 |
UW: 25.0% down · 7.5% · 30yr · 1.5% tax · 5.0% vac · 8.0% maint · 8.0% mgmt
Financing live
Cash to close
- Down payment
- $17,250
- Closing costs
- $2,070
- Reserves months
- —
- Total cash needed
- —
Loan-product check · same deal, 3 products live
Conventional
25% down · 7.5% · 30yr
- Down + closing
- —
- Monthly P&I
- —
- Monthly cashflow
- —
- DSCR
- —
- Eligible?
- —
Personal DTI + credit; lowest rate.
DSCR
20% down · 8.5% · 30yr
- Down + closing
- —
- Monthly P&I
- —
- Monthly cashflow
- —
- DSCR
- —
- Eligible?
- —
No personal income docs; deal must DSCR.
Hard money
10% down · 12.0% · 12mo
- Down + closing
- —
- Monthly P&I
- —
- Monthly cashflow
- —
- DSCR
- —
- Eligible?
- —
Short-term bridge; refi at stabilization.
Listing history 16 events
-
2026-06-13days on market $69,000 Active 155 DOM
-
2026-06-12days on market $69,000 Active 154 DOM
-
2026-06-09days on market $69,000 Active 151 DOM
-
2026-06-08days on market $69,000 Active 150 DOM
-
2026-06-07days on market $69,000 Active 149 DOM
-
2026-06-07days on market $69,000 Active 148 DOM
-
2026-06-04days on market $69,000 Active 145 DOM
-
2026-06-02days on market $69,000 Active 144 DOM
-
2026-06-01days on market $69,000 Active 143 DOM
-
2026-05-31days on market $69,000 Active 142 DOM
-
2026-05-31days on market $69,000 Active 141 DOM
-
2026-04-26price $69,000 595-char remark
Show marketing remark (595 chars)
This charming 2-bedroom, 1-bath home is full of character and sits on a generously sized lot with plenty of room to enjoy the outdoors. Step inside to a spacious eat-in kitchen featuring eye-catching exposed brick, creating a warm and inviting atmosphere perfect for everyday living and entertaining. The large living room is filled with natural light and offers a comfortable space to relax. Recent updates include replacement windows, new flooring throughout, and a beautifully remodeled bathroom. An unfinished basement provides excellent storage. Call to schedule your private showing today!
-
2026-01-09$75,000 Active 595-char remark
Show marketing remark (595 chars)
This charming 2-bedroom, 1-bath home is full of character and sits on a generously sized lot with plenty of room to enjoy the outdoors. Step inside to a spacious eat-in kitchen featuring eye-catching exposed brick, creating a warm and inviting atmosphere perfect for everyday living and entertaining. The large living room is filled with natural light and offers a comfortable space to relax. Recent updates include replacement windows, new flooring throughout, and a beautifully remodeled bathroom. An unfinished basement provides excellent storage. Call to schedule your private showing today!
-
2014-01-23soldstatus $8,000
-
2014-01-16soldstatus $8,000 115-char remark
Show marketing remark (115 chars)
1 Story 3 bedroom 1 Bath home with Full basement. Selling As Is Where Is. Call Listing Office for more Information.
-
2013-04-09$22,000 115-char remark
Show marketing remark (115 chars)
1 Story 3 bedroom 1 Bath home with Full basement. Selling As Is Where Is. Call Listing Office for more Information.
ⓘ Source: listings_history table (triggers on properties + properties_extension) + one-shot
backfill from property_details.listing_events for pre-trigger history.
Tax reassessment forecast IL · Partial reset (capped growth)
- Current annual tax
- $593 · $49/mo
- Projected year-2 tax
- $1,080 · $90/mo
- Expected delta
- +$487/yr (+$41/mo · 82.1%)
ⓘ Screening estimate from a state-policy table — verify with the county assessor before closing.
Climate risk First Street
- Flood 1/10 Low FEMA zone X (unshaded) · 0% chance over 30 yrs
- Wildfire 1/10 Low
- Heat 3/10 Moderate 7 d/yr ≥105°F today · 18 d/yr by 30 yrs out
- Wind 2/10 Low
- Air quality 2/10 Low 1 unhealthy d/yr today · 1 by 30 yrs out
Nearby sold comps map
Loading sold comps map…
Walkable amenities ~0.75 mi
Loading nearby amenities…
Taxation est. · year 1
- Rental income
- $11,434
- − Mortgage interest
- −$3,865
- − Property taxes
- −$593
- − Insurance
- −$345
- − Repairs & maintenance
- −$915
- − Management
- −$915
- − Depreciation
- −$2,007
- Taxable income
- $2,794
- Est. tax owed @ 24.0%
- −$671
- After-tax cash flow
- $3,082/yr
For passive investors: Depreciation is non-cash, so a rental often shows a tax loss while cash-flowing — sheltering income. Rental losses are passive: they offset passive income freely, and up to $25,000/yr can offset ordinary (W-2) income if you actively participate and your MAGI is under $100k (phasing out to $0 by $150k); unused losses carry forward. On sale, claimed depreciation is recaptured at up to 25%, and gains may owe capital-gains tax (a 1031 exchange can defer both). Figures are a year-1 estimate at your 24.0% rate — not tax advice; consult a CPA.
Schools (NCES district)
No district data.
Livability — Avon
- Score
- 56/100
- State rank
- #1220
- US rank
- #22942
Category grades
Schools grade is shown separately in the Schools card above.
Census & demographics
- Census place
- Avon, IL
- Population (ZIP)
- 1,646
Population outlook (Fulton County) Hauer SSP2
- Today (2025)
- 33,356 people
- By 2030
- 32,144 · -3.6%
- By 2040
- 29,518 · -11.5%
- By 2050
- 26,775 · -19.7%
- By 2075
- 19,972 · -40.1%
- By 2100
- 13,580 · -59.3%
Race, ethnicity, and origin ACS 2023
- Neighborhood character
- Predominantly White (97%)
- Race & ethnicity
- White 97% Two or more races 2% Hispanic / Latino 2%
- Common ancestry
- Slovak 2% Italian 1% Iranian 1%
- Foreign-born
- 0% · Canada
- Languages at home
- 92% English-only · German/W. Germanic 6% Spanish 2%
Political lean MEDSL · Fulton
- 2024 margin
- Strong R (+23.8) · D 37.1% · R 60.9% · Other 2.0%
- 2008→2024 swing
- -45.2pp toward R · 2008: 21.3pp · 2024: -23.8pp
- All cycles
- 2024: R+23.8 2020: R+20.1 2016: R+15.1 2012: D+11.1 2008: D+21.3
Not yet ingested
- Civics
- —
Market trends
- HPI YoY
- ▲ 2.61%
- Current HPI
- 157.7923
- Rent YoY
- —
- Metro
- —
- State GDP YoY
- ▲ 1.59%
- F500 in state
- 60
Industry mix (Fortune 500 HQ in IL)
| Industry | F500 HQs | Revenue |
|---|---|---|
| Insurance | 4 | $201B |
|
||
| Consumer Goods | 4 | $87B |
|
||
| Industrial Machinery | 3 | $64B |
|
||
| Healthcare | 2 | $55B |
|
||
| Retail / Pharmacy | 1 | $148B |
|
||
| Agriculture / Food | 1 | $86B |
|
||
Price history
+213.6% since first listed5 events — show timeline
- 2026-04-26 Price Changed $69,000 RMLSA as Distributed by MLS Grid
- 2026-01-09 Listed $75,000 RMLSA as Distributed by MLS Grid
- 2014-01-23 Sold (Public Records) $8,000 Public Records
- 2014-01-16 Sold (MLS) $8,000 RMLSA as Distributed by MLS Grid
- 2013-04-09 Listed $22,000 RMLSA as Distributed by MLS Grid
Property tax history
+3.7%/yrLatest (2024): $593 · +9.5% YoY. Source: county tax records.
Cash-flow waterfall
monthlySold comps — $/sqft
last 12 mo · ≤1 miLoading sold comps…