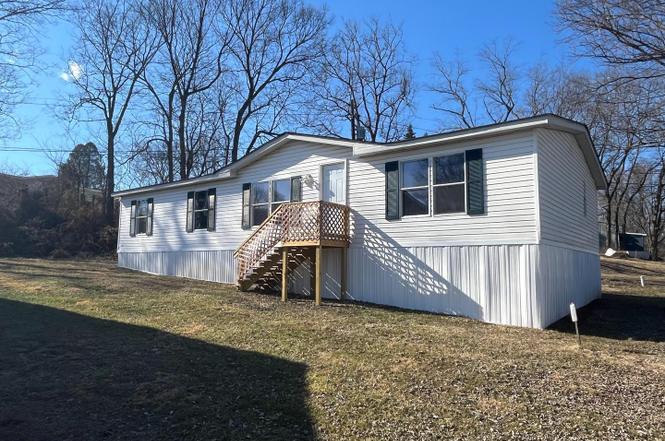
68 Gail Dr · Martinsburg, WV
Flood risk 4/10 · Minor
- FEMA flood zone
- X (unshaded)
- Chance of flooding over 30 yrs
- 0.22%
- Est. flood insurance / yr
- $473 – $860
Fire risk 3/10 · Minor
- Est. fire insurance / yr
- $787 – $1,461
Heat risk 5/10 · Moderate
- Hot days now (above 103°F)
- 7 days/yr
- Hot days in 30 yrs
- 16 days/yr
Wind risk 2/10 · Minimal
- Chance of severe wind over 30 yrs
- 2.0%
Air-quality risk 2/10 · Minimal
- Unhealthy air days now
- 0 days/yr
- Unhealthy air days in 30 yrs
- 1 days/yr
Risk factors via First Street. Map © Google.
Why this score? — see what drove the D grade
The composite is a weighted blend of 9 inputs, each scored 0–100. Each bar is that input's sub-score; the figure is the points it added to the 100-point composite (weight × sub-score).
- Cash flow +15.0/30.0
- ARV discount +7.5/15.0
- 1% rule +5.0/10.0
- DSCR +5.0/10.0
- Livability +3.8/5.0
- Schools +2.6/10.0
- Rent growth +2.5/5.0
- Condition / age +2.5/5.0
- Appreciation +0.0/10.0
$45,000
🖨 Deal sheet 📄 Offer letter ✓ Due diligence
Listing remarks
Property was originally planned for renovations; however, seller has elected to offer the home as-is. Seller has not occupied the property and has limited knowledge of its condition. No repairs will be made. Ideal for investors or buyers looking for a renovation project. This is a manufactured/mobile home located within a leased lot community. Buyer responsible for all due diligence and park approval. Broker/Owner: Listing Broker holds an ownership interest in the property. Priced accordingly for its current condition. Serious inquiries only. Property has existing ductwork/ventilation in place; however, no furnace or heating unit is currently installed.
Key facts
- Built 1995
- Listed 75 days
Property features AI
Finance
- Other: Ownership is land lease
- HOA & community: Land lease of $450 monthly; Land lease years remaining: 0
Exterior
- Parking: Driveway
- Utilities: Public water; Community septic tank
- Home design: Manufactured home; Above-grade living space (approximately 1,300 finished)
- Construction: Aluminum siding; Above grade structure
- Exterior features: Outside city limits; No tidal water
Interior
- Bedrooms: 3 bedrooms on the main level
- Bathrooms: 2 full bathrooms on the main level; 2 full bathrooms total
- Heating & cooling: Central heating; Electric heating fuel; Electric hot water
- Interior features: Estimated living area; No basement
Neighborhood map
What this means for you Summary
Snapshot
- This is a 3-bed/2.0-bath single-family listed at $45k.
Deal economics
- At list price, monthly cash flow is $1k ($15k/yr) — positive.
- The deal already cash-flows at list — no discount required.
- Meets the 1% rule at list price ($2k rent vs $45k).
- Recommended offer: $42k (6.0% below list) — sets the bar for market timing.
- Cap rate 40.2% vs local median 4.0% in Martinsburg — top-decile yield for the area; either an underpriced asset or a hidden risk that comps aren't pricing in. Stress-test before assuming the spread holds.
Location & tenants
- Location reads 75/100 on livability (#29 in WV, #4,057 nationally) — a middle-class / working-renter tenant base. Strengths: amenities A+, cost of living A+, housing A+; Watch: commute F, employment D-.
- Berkeley County Schools (other): math 21% / reading 38% proficiency, ranked #24 of 55 in WV (top 44%) — low school quality limits family demand, transient renter base, plan for 1-2y turnover.
- Market conditions: 255 active listings in the ZIP; 3 comparable units currently listed for rent nearby; rentals leasing fast (median 14d on market — plan ~1-2 weeks tenant-placement turnaround); solid renter incomes; 1,460 units permitted in Berkeley County in 2024 (16 in 5+ unit buildings).
Forward outlook
- Local home prices are declining (-3.0%/yr); year-one equity from $311 of loan paydown is wiped out by about $1k of value loss. Plan a longer hold.
- Berkeley County population projected at +25% by 2050 — long-run rental-demand tailwind backs the buy-and-hold thesis.
- At projected returns (-3.0% appreciation + 3.0% rent growth), your $13k cash investment doubles in ~1 year — after that, you're playing with house money.
Negotiation context
- It's been on market 75 days — a 6% lower offer ($42k) is reasonable based on typical stale-listing flexibility.
- 2 sale attempts; this cycle's ask has dropped $15k (25%) from the opening price — seller is motivated, your offer sets the floor, not the list.
Risks & watch-outs
- Climate carrying-cost: extreme-heat days projected 7→16/yr by 2055 (HVAC capex compounding) — expect insurance premiums to compound above CPI over the hold.
Questions for the listing agent
- It's been on market 75 days. Have you received any prior offers? Is the seller open to a 6% concession, seller financing, or rate buy-down credit?
- Why hasn't it sold? Are there any deal-killer items the seller is aware of (foundation, flood, title, zoning, code violations)?
- Is there a deadline driving the sale (1031 exchange, divorce, estate, relocation)? That informs how much negotiation room exists.
- The area grade is low — what's the realistic commute time and amenity access for the typical tenant pool here? Any planned neighborhood developments (good or bad) we should know about?
- What's the average days-on-market for RENTAL listings here right now (not sales)? A rising rental-DOM trend means longer vacancies and softer asking-rent achievability than the comps imply.
- What's the recent tenant-quality profile in this submarket — average credit score on applications, eviction rate, late-payment / NSF rate, and stable-employment percentage? A property-management company in the area should have these aggregated.
- How much new for-sale + rental construction is in the pipeline within 1–3 miles? Heavy new supply typically softens prices + rents 12–24 months out; constrained supply supports both.
Investment metrics
- 1% rule
- 4.45% ✓
- Cap rate
- 40.20%
- Cash-on-cash
- 121.09%
- DSCR
- 6.39
- GRM
- 1.9
CMA / ARV
- ARV (on-the-fly)
- $146,900
- Comps found
- 3
Show comp detail 3 sales within ~0.75 mi
| Address | Dist | Beds/Ba | Sqft | Sold | Price | $/sf | Match |
|---|---|---|---|---|---|---|---|
| 141 Janesa Dr | 0.32mi | 3/2.0 | 1,279 (-2%) | 1mo | $75,000 | $59 | 82 |
| 31 Gail Dr | 0.06mi | 3/2.0 | 1,110 (-15%) | 6mo | $125,000 | $113 | 68 |
| 170 Aldrin Ln | 0.47mi | 3/1.5 | 1,380 (+6%) | 6mo | $291,000 | $211 | 61 |
Match score weights: distance 35% · size 25% · config 20% · recency 20%. Top-matched comps best support the ARV.
Projected returns pro-forma
-3.0% appreciation · 3.0% rent growth · sell at horizon
- IRR
- —
- Equity multiple
- 6.85×
- Total profit
- $73,715
- Equity at exit
- $6,710
- IRR
- —
- Equity multiple
- 14.38×
- Total profit
- $168,583
- Equity at exit
- $3,891
Cash invested: $12,600 (down + closing). Projections, not guarantees.
Landlord ↔ Tenant lean methodology
- Overall (STATE)
- 83 Strongly Landlord-Friendly
- State West Virginia
- 83 Strongly Landlord-Friendly · R+22
- County
- — inherits STATE
- City
- — inherits STATE
ZIP-level market 25403
- Home prices YoY
- -15.2%
- Active inventory
- 255
- Price-to-rent
- 1.9×
Monthly cashflow live
- Estimated rent
- $2,003 medium interval (Pro) →
- Mortgage (P&I)
- −$236
- Tax est. 1.5%
- −$56 /mo · $675/yr
- Insurance
- −$19
- HOA
- −$0
- Vacancy / Maint / Mgmt
- −$421
- Net cashflow
- $1,271
Break-even live
UW: 25.0% down · 7.5% · 30yr · 1.5% tax · 5.0% vac · 8.0% maint · 8.0% mgmt
Financing live
Cash to close
- Down payment
- $11,250
- Closing costs
- $1,350
- Reserves months
- —
- Total cash needed
- —
Loan-product check · same deal, 3 products live
Conventional
25% down · 7.5% · 30yr
- Down + closing
- —
- Monthly P&I
- —
- Monthly cashflow
- —
- DSCR
- —
- Eligible?
- —
Personal DTI + credit; lowest rate.
DSCR
20% down · 8.5% · 30yr
- Down + closing
- —
- Monthly P&I
- —
- Monthly cashflow
- —
- DSCR
- —
- Eligible?
- —
No personal income docs; deal must DSCR.
Hard money
10% down · 12.0% · 12mo
- Down + closing
- —
- Monthly P&I
- —
- Monthly cashflow
- —
- DSCR
- —
- Eligible?
- —
Short-term bridge; refi at stabilization.
Rent comps 3 comps
| Address | Beds | Baths | Sqft | Rent | $/sqft | DOM | Units | Dist |
|---|---|---|---|---|---|---|---|---|
| 57 Sebago Pl Martinsburg, WV | 3.0 | 2.0 | 1200 | $1,650 | $1.38 | 13d | 1 | 0.96mi |
| 62 Rhea Dr Martinsburg, WV | 3.0 | 2.5 | 1414 | $1,900 | $1.34 | 13d | 1 | 1.11mi |
| 63 Orpington Dr Martinsburg, WV | 4.0 | 2.0 | 1705 | $2,450 | $1.44 | 13d | 1 | 1.31mi |
Listing history 19 events
-
2026-06-18days on market $45,000 Active 75 DOM
-
2026-06-17days on market $45,000 Active 74 DOM
-
2026-06-16days on market $45,000 Active 73 DOM
-
2026-06-15days on market $45,000 Active 72 DOM
-
2026-06-14days on market $45,000 Active 70 DOM
-
2026-06-13days on market $45,000 Active 69 DOM
-
2026-06-10days on market $45,000 Active 67 DOM
-
2026-06-09days on market $45,000 Active 66 DOM
-
2026-06-09price $45,000 Active 65 DOM
-
2026-06-08days on market $55,000 Active 65 DOM
-
2026-06-07days on market $55,000 Active 64 DOM
-
2026-05-31days on market $55,000 Active 61 DOM
-
2026-05-30days on market $55,000 Active 60 DOM
-
2026-04-13price $55,000
-
2026-04-13status Active
-
2026-04-01historical Active Under Contract
-
2026-03-18price $60,000
-
2026-03-18$60,000 Active
-
2026-03-10historical $110,000
ⓘ Source: listings_history table (triggers on properties + properties_extension) + one-shot
backfill from property_details.listing_events for pre-trigger history.
Climate risk First Street
- Flood 4/10 Moderate FEMA zone X (unshaded) · 22% chance over 30 yrs
- Wildfire 3/10 Moderate
- Heat 5/10 Major 7 d/yr ≥103°F today · 16 d/yr by 30 yrs out
- Wind 2/10 Low 2% chance of damaging wind over 30 yrs
- Air quality 2/10 Low 0 unhealthy d/yr today · 1 by 30 yrs out
Nearby sold comps map
Loading sold comps map…
Walkable amenities ~0.75 mi
Loading nearby amenities…
Taxation est. · year 1
- Rental income
- $24,036
- − Mortgage interest
- −$2,521
- − Property taxes
- −$675
- − Insurance
- −$225
- − Repairs & maintenance
- −$1,923
- − Management
- −$1,923
- − Depreciation
- −$1,309
- Taxable income
- $15,461
- Est. tax owed @ 24.0%
- −$3,711
- After-tax cash flow
- $11,546/yr
For passive investors: Depreciation is non-cash, so a rental often shows a tax loss while cash-flowing — sheltering income. Rental losses are passive: they offset passive income freely, and up to $25,000/yr can offset ordinary (W-2) income if you actively participate and your MAGI is under $100k (phasing out to $0 by $150k); unused losses carry forward. On sale, claimed depreciation is recaptured at up to 25%, and gains may owe capital-gains tax (a 1031 exchange can defer both). Figures are a year-1 estimate at your 24.0% rate — not tax advice; consult a CPA.
Schools (NCES district)
- District
- Berkeley County Schools
- NCES district ID
- 5400060
- Math proficiency
- 21% ▼ -12.00%
- Reading proficiency
- 38% ▼ -6.00%
- Median HH income
- $54,599
- Composite
- 26.16/100
- National rank
- #7273
- State rank
- #24 of 55 in WV
Livability — Martinsburg
- Score
- 75/100
- State rank
- #29
- US rank
- #4057
Category grades
Schools grade is shown separately in the Schools card above.
Census & demographics
- County
- Berkeley County · 85,235 people
- City population
- 55,439
- Metro
- Hagerstown-Martinsburg, MD-WV
- Population (ZIP)
- 16,470
- Household income
- $87,512
- Rent vs Own
- Severe rent burden
- 120.0
Population outlook (Berkeley County) Hauer SSP2
- Today (2025)
- 127,359 people
- By 2030
- 134,684 · +5.8%
- By 2040
- 148,219 · +16.4%
- By 2050
- 159,300 · +25.1%
- By 2075
- 179,920 · +41.3%
- By 2100
- 183,896 · +44.4%
Race, ethnicity, and origin ACS 2023
- Neighborhood character
- Predominantly White (74%)
- Race & ethnicity
- White 74% Hispanic / Latino 10% Black 8% Two or more races 8% Asian 1%
- Hispanic origin (detail)
- Mexican 3%
- Common ancestry
- Italian 2% Romanian 2% Slovak 1%
- Foreign-born
- 6% · Canada, Guatemala, Vietnam
- Languages at home
- 90% English-only · Spanish 6% Vietnamese 1%
Political lean MEDSL · Berkeley
- 2024 margin
- Solid R (+35.8) · D 31.2% · R 67.0% · Other 1.8%
- 2008→2024 swing
- -22.8pp toward R · 2008: -13.0pp · 2024: -35.8pp
- All cycles
- 2024: R+35.8 2020: R+31.2 2016: R+37.2 2012: R+21.3 2008: R+13.0
Not yet ingested
- Civics
- —
Market trends
- HPI YoY
- ▼ -34.15%
- Current HPI
- 190.9235
- Rent YoY
- —
- Metro
- Hagerstown-Martinsburg, MD-WV
- State GDP YoY
- —
- F500 in state
- 0
Price history
-50.0% since first listed6 events — show timeline
- 2026-04-13 Price Changed $55,000 BRIGHT MLS
- 2026-04-13 Relisted — BRIGHT MLS
- 2026-04-01 Contingent — BRIGHT MLS
- 2026-03-18 Price Changed $60,000 BRIGHT MLS
- 2026-03-18 Listed $60,000 BRIGHT MLS
- 2026-03-10 Coming Soon $110,000 BRIGHT MLS
Cash-flow waterfall
monthlySold comps — $/sqft
last 12 mo · ≤1 miLoading sold comps…