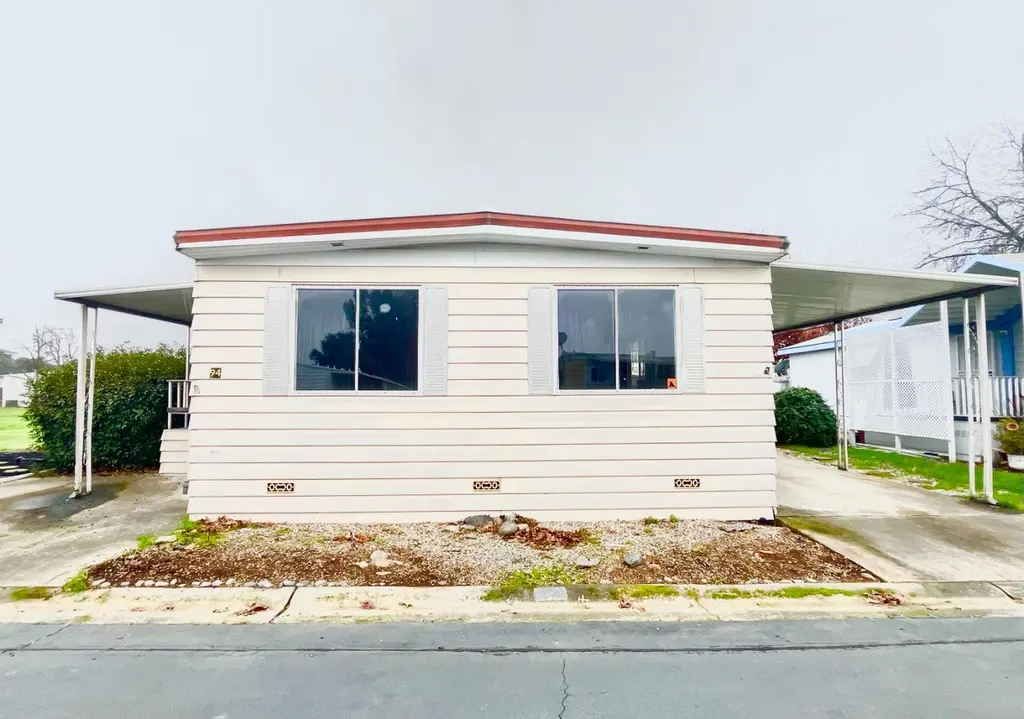
8665 Florin Rd #94 · Florin, CA
Flood risk 1/10 · Minimal
- FEMA flood zone
- X (unshaded)
- Chance of flooding over 30 yrs
- 0.0%
- Est. flood insurance / yr
- $507 – $1,088
Fire risk 5/10 · Moderate
- Est. fire insurance / yr
- $659 – $1,223
Heat risk 7/10 · Major
- Hot days now (above 102°F)
- 6 days/yr
- Hot days in 30 yrs
- 11 days/yr
Wind risk 1/10 · Minimal
- Chance of severe wind over 30 yrs
- —
Air-quality risk 10/10 · Severe
- Unhealthy air days now
- 28 days/yr
- Unhealthy air days in 30 yrs
- 33 days/yr
Risk factors via First Street. Map © Google.
Why this score? — see what drove the B- grade
The composite is a weighted blend of 9 inputs, each scored 0–100. Each bar is that input's sub-score; the figure is the points it added to the 100-point composite (weight × sub-score).
- Cash flow +26.7/30.0
- 1% rule +10.0/10.0
- ARV discount +9.3/15.0
- DSCR +9.1/10.0
- Schools +4.1/10.0
- Livability +2.9/5.0
- Rent growth +2.4/5.0
- Condition / age +2.2/5.0
- Appreciation +1.3/10.0
$129,900
🖨 Deal sheet (PDF) 📄 Offer letter ✓ Due diligence
Listing remarks
Turn-key and tucked away, this home features new flooring, an updated bathroom, and a low-maintenance yard, making it an easy move-in option with minimal upkeep. The setting feels secluded, offering privacy without isolation. Located in a resident-owned mobile home park, there is no space rent. Instead, owners pay an HOA fee, which is significantly lower than typical park rent in comparable communities. This structure offers long-term affordability and stability that's increasingly hard to find. A solid option for buyers looking for low ownership costs, a quiet setting, and a home that's already been refreshed where it counts.
Key facts
- Low-maintenance yard
- New flooring
- Updated bathroom
Tags
Neighborhood map
What this means for you Summary
Snapshot
- This is a 2-bed/2.0-bath manufactured listed at $130k. Condition is rated fair.
Deal economics
- At list price, monthly cash flow is $350 ($4k/yr) — positive.
- The deal already cash-flows at list — no discount required.
- Meets the 1% rule at list price ($2k rent vs $130k).
- Recommended offer: $114k (12.0% below list) — sets the bar for market timing.
- Cap rate 9.5% vs local median 3.6% in Florin — top-decile yield for the area; either an underpriced asset or a hidden risk that comps aren't pricing in. Stress-test before assuming the spread holds.
Location & tenants
- Location reads 58/100 on livability (#673 in CA) — a working-class tenant base; expect higher turnover. Strengths: housing A; Watch: employment D, schools D-, crime F.
- Elk Grove Unified (suburban): math 40% / reading 51% proficiency, ranked #165 of 517 in CA (top 32%) — families likely to look elsewhere, expect single-tenant / working-renter base with shorter leases.
- Market conditions: Rents soft (-0.2%/yr); 212 active listings in the ZIP; 4 comparable units currently listed for rent nearby; rentals leasing fast (median 8d on market — plan ~1-2 weeks tenant-placement turnaround); solid renter incomes; 6,825 units permitted in Sacramento County in 2024 (1,752 in 5+ unit buildings).
- This rent runs 32% of the median local income ($82k/yr) — at the standard rent-burdened threshold; future hikes will face affordability resistance.
Forward outlook
- Local home prices are declining (-3.0%/yr); year-one equity from $898 of loan paydown is wiped out by about $4k of value loss. Plan a longer hold.
- Sacramento County population projected at +17% by 2050 — long-run rental-demand tailwind backs the buy-and-hold thesis.
Negotiation context
- It's been on market 129 days — a 12% lower offer ($114k) is reasonable based on typical stale-listing flexibility.
Risks & watch-outs
- Watch-outs: HOA is 21% of rent.
- Climate carrying-cost: moderate wildfire risk; extreme-heat days projected 6→11/yr by 2055 (HVAC capex compounding) — expect insurance premiums to compound above CPI over the hold.
Questions for the listing agent
- It's been on market 129 days. Have you received any prior offers? Is the seller open to a 12% concession, seller financing, or rate buy-down credit?
- Have any recent inspections been done? Can we get a copy of the seller's disclosures and any deferred-maintenance estimates?
- Built in 1972 — when were the roof, HVAC, electrical panel, plumbing, and water heater last replaced?
- What does the HOA fee cover, when was the last increase, and are there any pending special assessments or reserve-fund shortfalls?
- Why hasn't it sold? Are there any deal-killer items the seller is aware of (foundation, flood, title, zoning, code violations)?
- Is there a deadline driving the sale (1031 exchange, divorce, estate, relocation)? That informs how much negotiation room exists.
- Schools are D-rated, which usually means shorter tenancies and higher turnover. Who's the typical renter profile here, and what's been the actual vacancy rate?
- Crime grade is F in this area — have there been break-ins, vandalism, or insurance claims at this property in the last 3 years? What carrier currently insures it and at what premium?
- What's the average days-on-market for RENTAL listings here right now (not sales)? A rising rental-DOM trend means longer vacancies and softer asking-rent achievability than the comps imply.
- What's the recent tenant-quality profile in this submarket — average credit score on applications, eviction rate, late-payment / NSF rate, and stable-employment percentage? A property-management company in the area should have these aggregated.
- How much new for-sale + rental construction is in the pipeline within 1–3 miles? Heavy new supply typically softens prices + rents 12–24 months out; constrained supply supports both.
Investment metrics
- 1% rule
- 1.66% ✓
- Cap rate
- 9.52%
- Cash-on-cash
- 11.54%
- DSCR
- 1.51
- GRM
- 5.0
CMA / ARV
- ARV (median comp)
- $135,304
- List price
- $129,900
- Delta
- -3.99%
- Verdict
- FAIR
- Comps
- 20 within 1.0 mi
Show comp detail 12 sales within ~0.75 mi
| Address | Dist | Beds/Ba | Sqft | Sold | Price | $/sf | Match |
|---|---|---|---|---|---|---|---|
| 8665 Florin Rd #94 | 0.00mi | 2/2.0 | 1,344 (0%) | 0mo | $103,000 | $77 | 100 |
| 8665 Florin Rd #129 | 0.10mi | 3/2.0 (+1) | 1,340 (-0%) | 6mo | $185,000 | $138 | 85 |
| 8665 Florin Rd #31 | 0.06mi | 3/2.0 (+1) | 1,300 (-3%) | 7mo | $50,000 | $38 | 81 |
| 8665 Florin Rd #134 | 0.06mi | 2/2.0 | 1,440 (+7%) | 7mo | $107,000 | $74 | 80 |
| 8665 Florin Rd #12 | 0.18mi | 2/2.0 | 1,392 (+4%) | 8mo | $140,000 | $101 | 79 |
| 8665 Florin Rd #9 | 0.18mi | 2/2.0 | 1,200 (-11%) | 8mo | $127,000 | $106 | 67 |
| 7406 Pardis Ln | 0.63mi | 2/2.0 | 1,400 (+4%) | 1mo | $170,000 | $121 | 62 |
| 7406 Pardis Ln | 0.63mi | 2/2.0 | 1,400 (+4%) | 1mo | $170,000 | $121 | 62 |
| 7403 Beret Ln | 0.72mi | 2/2.0 | 1,344 (0%) | 9mo | $245,000 | $182 | 59 |
| 8676 Beauxart Cir | 0.59mi | 2/2.0 | 1,440 (+7%) | 5mo | $322,000 | $224 | 56 |
| 8622 Beauxart Cir #39 | 0.70mi | 2/2.0 | 1,200 (-11%) | 1mo | $270,000 | $225 | 48 |
| 7430 Bouvais Cir | 0.66mi | 2/2.0 | 1,536 (+14%) | 6mo | $225,000 | $146 | 40 |
Match score weights: distance 35% · size 25% · config 20% · recency 20%. Top-matched comps best support the ARV.
Projected returns pro-forma
-3.0% appreciation · 0.0% rent growth · sell at horizon
- IRR
- -3.7%
- Equity multiple
- 0.87×
- Total profit
- $-4,780
- Equity at exit
- $19,369
- IRR
- 0.7%
- Equity multiple
- 1.04×
- Total profit
- $1,378
- Equity at exit
- $11,231
Cash invested: $36,372 (down + closing). Projections, not guarantees.
Landlord ↔ Tenant lean methodology
- Overall (STATE)
- 18 Strongly Tenant-Friendly
- State California
- 18 Strongly Tenant-Friendly · D+13
- County
- — inherits STATE
- City
- — inherits STATE
ZIP-level market 95828
- Home prices YoY
- -0.8%
- Rents YoY
- -0.2%
- Active inventory
- 212
- Price-to-rent
- 5.0×
Monthly cashflow live
- Estimated rent
- $2,155 medium interval (Pro) →
- Mortgage (P&I)
- −$681
- Tax est. 1.5%
- −$162 /mo · $1,948/yr
- Insurance
- −$54
- HOA
- −$455
- Vacancy / Maint / Mgmt
- −$453
- Net cashflow
- $350
Break-even live
Sensitivity live
| Price | -10% $439 | -5% $395 | +0% $350 | +5% $305 | +10% $260 |
|---|---|---|---|---|---|
| Rent | -10% $179 | -5% $265 | +0% $350 | +5% $435 | +10% $520 |
| Rate | -1.0pp $415 | -0.5pp $383 | base $350 | +0.5pp $316 | +1.0pp $282 |
UW: 25.0% down · 7.5% · 30yr · 1.5% tax · 5.0% vac · 8.0% maint · 8.0% mgmt
Financing live
Cash to close
- Down payment
- $32,475
- Closing costs
- $3,897
- Reserves months
- —
- Total cash needed
- —
Loan-product check · same deal, 3 products live
Conventional
25% down · 7.5% · 30yr
- Down + closing
- —
- Monthly P&I
- —
- Monthly cashflow
- —
- DSCR
- —
- Eligible?
- —
Personal DTI + credit; lowest rate.
DSCR
20% down · 8.5% · 30yr
- Down + closing
- —
- Monthly P&I
- —
- Monthly cashflow
- —
- DSCR
- —
- Eligible?
- —
No personal income docs; deal must DSCR.
Hard money
10% down · 12.0% · 12mo
- Down + closing
- —
- Monthly P&I
- —
- Monthly cashflow
- —
- DSCR
- —
- Eligible?
- —
Short-term bridge; refi at stabilization.
Rent comps 4 comps
| Address | Beds | Baths | Sqft | Rent | $/sqft | DOM | Units | Dist |
|---|---|---|---|---|---|---|---|---|
| 8550 Florin Rd Sacramento, CA | 1.0–2.0 | 1.0 | 776 | $1,795 | $2.31 | 2d | 16 | 0.35mi |
| 8604 Maple Grove Ct Sacramento, CA | 2.0 | 2.0 | 1557 | $2,195 | $1.41 | 24d | 1 | 1.22mi |
| 8604 Maple Grove Ct Sacramento, CA | 2.0 | 2.0 | 1557 | $2,195 | $1.41 | 8d | 1 | 1.22mi |
| 7756 Southbreeze Dr Sacramento, CA | 3.0 | 2.0 | 1302 | $2,395 | $1.84 | 2d | 1 | 1.42mi |
HOA detail
- Monthly dues
- $455 · $5,460/yr
Climate risk First Street
- Flood 1/10 Low FEMA zone X (unshaded) · 0% chance over 30 yrs
- Wildfire 5/10 Major
- Heat 7/10 Severe 6 d/yr ≥102°F today · 11 d/yr by 30 yrs out
- Wind 1/10 Low
- Air quality 10/10 Extreme 28 unhealthy d/yr today · 33 by 30 yrs out
Nearby sold comps map
Loading sold comps map…
Walkable amenities ~0.75 mi
Loading nearby amenities…
Taxation est. · year 1
- Rental income
- $25,859
- − Mortgage interest
- −$7,276
- − Property taxes
- −$1,948
- − Insurance
- −$650
- − Repairs & maintenance
- −$2,069
- − Management
- −$2,069
- − HOA
- −$5,460
- − Depreciation
- −$3,779
- Taxable income
- $2,608
- Est. tax owed @ 24.0%
- −$626
- After-tax cash flow
- $3,570/yr
For passive investors: Depreciation is non-cash, so a rental often shows a tax loss while cash-flowing — sheltering income. Rental losses are passive: they offset passive income freely, and up to $25,000/yr can offset ordinary (W-2) income if you actively participate and your MAGI is under $100k (phasing out to $0 by $150k); unused losses carry forward. On sale, claimed depreciation is recaptured at up to 25%, and gains may owe capital-gains tax (a 1031 exchange can defer both). Figures are a year-1 estimate at your 24.0% rate — not tax advice; consult a CPA.
Condition & rehab AI · 12 photos
This mobile home is in fair condition with cosmetic updates needed to enhance its curb appeal and interior aesthetics, making it a solid option for low ownership costs and a quiet setting.
Repairs flagged
- Minor kitchen cabinets — slight wear
- Minor bathroom cabinets — slight wear
- Minor exterior siding — visible wear
Value-add opportunities
- Both paint interior walls — enhances curb appeal and interior aesthetics
- Both replace carpeting — improves comfort and reduces maintenance
- Both update kitchen cabinets — modernizes the space and increases appeal
- Both update bathrooms — modernizes the space and increases appeal
Renovation cost estimate screening
| Repair item | Severity | Est. cost |
|---|---|---|
| kitchen cabinets · slight wear | Minor | $500–3,000 |
| bathroom cabinets · slight wear | Minor | $500–3,000 |
| exterior siding · visible wear | Minor | $500–3,000 |
| Total estimated repair cost · 3 items | $1,500–9,000 |
Value-add ROI direction
- Both paint interior walls — enhances curb appeal and interior aesthetics ↑
- Both replace carpeting — improves comfort and reduces maintenance ↑
- Both update kitchen cabinets — modernizes the space and increases appeal ↑
- Both update bathrooms — modernizes the space and increases appeal ↑
ⓘ Cost ranges are severity-bucket heuristics (US national rule-of-thumb). Get contractor quotes + a written scope before underwriting a rehab budget.
Schools (NCES district)
- District
- Elk Grove Unified
- NCES district ID
- 0612330
- Math proficiency
- 40% ▼ -5.00%
- Reading proficiency
- 51% ▼ -5.00%
- Median HH income
- $67,860
- Composite
- 40.72/100
- National rank
- #3658
- State rank
- #165 of 517 in CA
Livability — Florin
- Score
- 58/100
- State rank
- #673
- US rank
- #20705
Category grades
Schools grade is shown separately in the Schools card above.
Census & demographics
- Census place
- Florin, CA
- County
- Sacramento County · 1,539,646 people
- City population
- 60,532
- Metro
- Sacramento-Roseville-Folsom, CA
- Population (ZIP)
- 61,686
- Household income
- $81,778
- Rent vs Own
- Severe rent burden
- 1765.0
Population outlook (Sacramento County) Hauer SSP2
- Today (2025)
- 1,660,763 people
- By 2030
- 1,732,990 · +4.3%
- By 2040
- 1,855,755 · +11.7%
- By 2050
- 1,941,335 · +16.9%
- By 2075
- 2,046,162 · +23.2%
- By 2100
- 1,961,444 · +18.1%
Race, ethnicity, and origin ACS 2023
- Neighborhood character
- Highly diverse neighborhood (Simpson 0.75)
- Race & ethnicity
- Asian 37% Hispanic / Latino 26% White 16% Two or more races 12% Black 10% Pacific Islander 4%
- Hispanic origin (detail)
- Mexican 22%
- Common ancestry
- Italian 1% Russian 1% Portuguese 1%
- Foreign-born
- 35% · Vietnam, Canada, China
- Languages at home
- 47% English-only · Spanish 17% Other Asian/Pacific 13% Vietnamese 8%
Political lean MEDSL · Sacramento
- 2024 margin
- D (+19.7) · D 58.1% · R 38.4% · Other 3.5%
- 2008→2024 swing
- +0.7pp no change · 2008: 19.0pp · 2024: 19.7pp
- All cycles
- 2024: D+19.7 2020: D+25.3 2016: D+23.7 2012: D+16.3 2008: D+19.0
Not yet ingested
- Civics
- —
Market trends
- HPI YoY
- ▼ -7.49%
- Current HPI
- 962.47
- Rent YoY
- ▼ -0.24%
- Metro
- Sacramento-Roseville-Folsom, CA
- State GDP YoY
- ▲ 3.21%
- F500 in state
- 116
Industry mix (Fortune 500 HQ in CA)
| Industry | F500 HQs | Revenue |
|---|---|---|
| Technology | 27 | $1,492B |
|
||
| Financial Services | 3 | $174B |
|
||
| Retail | 3 | $44B |
|
||
| Insurance | 3 | $26B |
|
||
| Media / Entertainment | 2 | $115B |
|
||
| Pharmaceuticals / Biotech | 2 | $62B |
|
||
Cash-flow waterfall
monthlySold comps — $/sqft
last 12 mo · ≤1 miLoading sold comps…