 Duplex
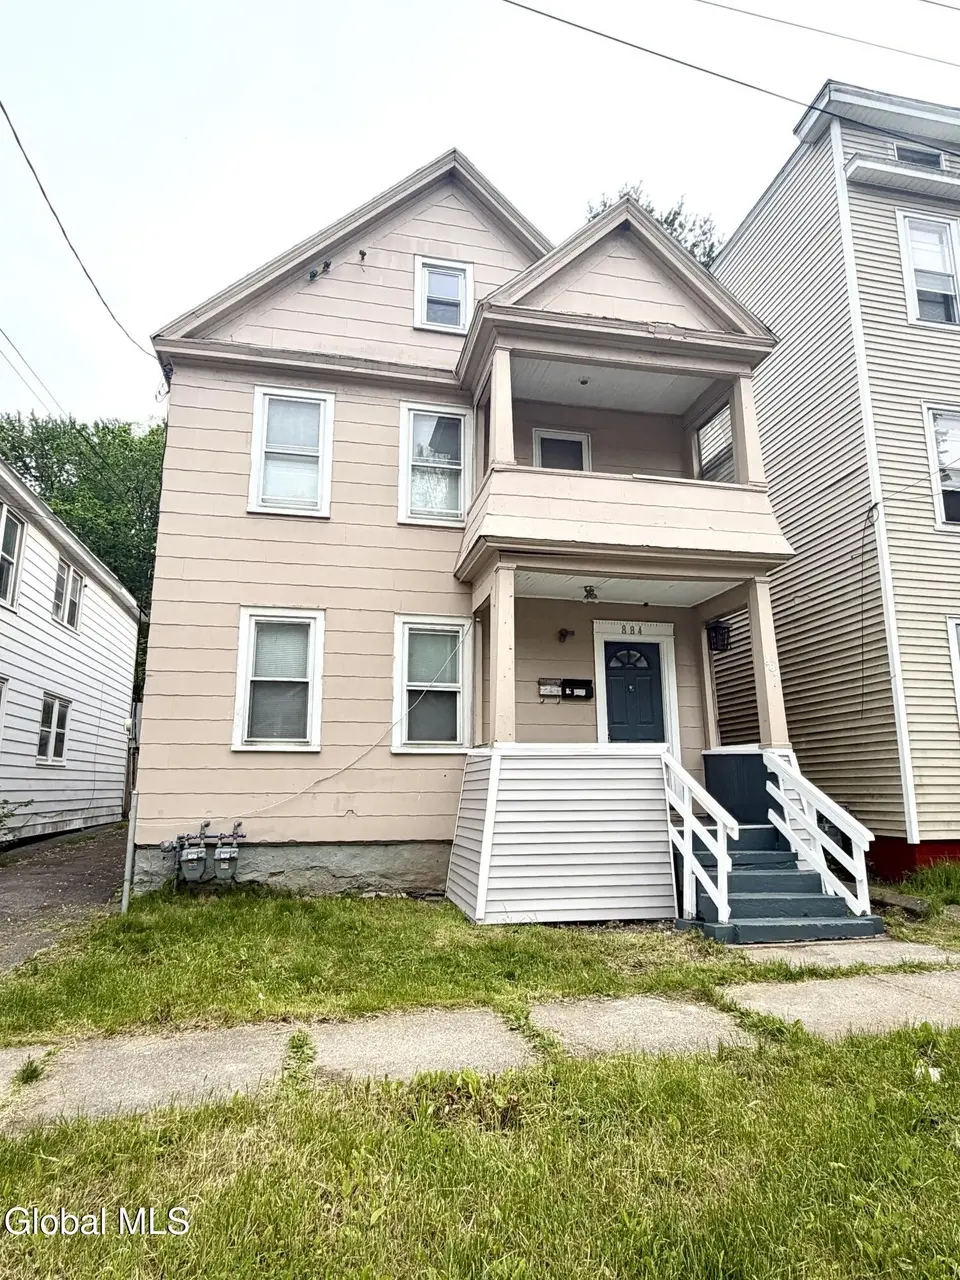
884 Yorkston St · Schenectady, NY
Flood risk 1/10 · Minimal
- FEMA flood zone
- X (unshaded)
- Chance of flooding over 30 yrs
- 0.0%
- Est. flood insurance / yr
- $473 – $860
Fire risk 3/10 · Minor
- Est. fire insurance / yr
- $691 – $1,283
Heat risk 3/10 · Minor
- Hot days now (above 96°F)
- 7 days/yr
- Hot days in 30 yrs
- 16 days/yr
Wind risk 2/10 · Minimal
- Chance of severe wind over 30 yrs
- 4.0%
Air-quality risk 1/10 · Minimal
- Unhealthy air days now
- 0 days/yr
- Unhealthy air days in 30 yrs
- 0 days/yr
Risk factors via First Street. Map © Google.
Why this score? — see what drove the C- grade
The composite is a weighted blend of 9 inputs, each scored 0–100. Each bar is that input's sub-score; the figure is the points it added to the 100-point composite (weight × sub-score).
- Cash flow +26.2/30.0
- DSCR +8.9/10.0
- 1% rule +7.6/10.0
- Livability +3.9/5.0
- Schools +3.0/10.0
- Rent growth +2.5/5.0
- Condition / age +2.5/5.0
- ARV discount +0.0/15.0
- Appreciation +0.0/10.0
$249,900
🖨 Deal sheet 📄 Offer letter ✓ Due diligence
Multi-family units
County records classify this as Multi-Family (2-4 Unit). Listing-text estimate: 2 units. confirmed
Listing remarks
Welcome to this beautifully renovated 2-family home in Schenectady! Both units offer 3 bedrooms and 1 bathroom each, fully updated from top to bottom - featuring a brand new kitchen, updated bathroom, new flooring, fresh paint throughout, and new electrical fixtures. New furnaces in both units, plus a newer hot water tank and roof, give you total peace of mind for years to come. The partially finished attic can easily be converted into additional living space. Live in one unit and let the rent from the other help cover your mortgage - a smart move for any homeowner or investor. Tucked away on a quiet dead-end street, this home is a must-see. Schedule your showing today!
Key facts
- Fresh paint
- Brand new kitchen
- New flooring
Tags
Property features AI
Exterior
- Parking: Driveway with 3 parking spaces
- Utilities: Public water; Public sewer; 100 Amp electric service with circuit breakers; Cable available
- Home design: Duplex; Vinyl siding construction
- Construction: Asphalt roof; Brick/mortar foundation
- Exterior features: Garden; Back yard and perimeter fencing; Level lot
Interior
- Bedrooms: Two units each with 3 bedrooms (one unit on 1st level, one on 2nd level)
- Bathrooms: Two full bathrooms (one full bath on 1st level, one full bath on 2nd level)
- Heating & cooling: Forced air heating (natural gas)
- Interior features: Full unfinished basement with interior entry
Neighborhood map
What this means for you Summary
Snapshot
- This is a 2 × 3-bed/1.0-bath units multifamily listed at $250k.
Deal economics
- At list price, monthly cash flow is $641 ($8k/yr) — positive. Per door: $320/mo.
- The deal already cash-flows at list — no discount required.
- Meets the 1% rule at list price ($3k rent vs $250k).
- Recommended offer: $246k (1.5% below list) — sets the bar for market timing.
- Cap rate 9.4% vs local median 6.3% in Schenectady — top-decile yield for the area; either an underpriced asset or a hidden risk that comps aren't pricing in. Stress-test before assuming the spread holds.
Location & tenants
- Location reads 78/100 on livability (#167 in NY, #2,597 nationally) — a middle-class / working-renter tenant base. Strengths: commute A+, health & safety A+, cost of living A; Watch: employment D+, crime F.
- Schenectady City School District (urban): math 38% / reading 34% proficiency, ranked #556 of 590 in NY (top 94%) — families likely to look elsewhere, expect single-tenant / working-renter base with shorter leases; 65% free/reduced lunch — lower-income household profile, screen leases tightly.
- Zoned schools: Schenectady High School (math 75% / reading 90%, grade A, #446 of 1,100 statewide, top 41%, 2,743 students, 71% FRL).
- Zoned-school proficiency averages 82% at this address vs 36% district-wide (+46 pts) — the actual schools serving this property are materially stronger than the Schenectady City School District average implies; a family-tenant draw the district grade alone would hide.
- Market conditions: 161 active listings in the ZIP; 6 comparable units currently listed for rent nearby; rentals at typical pace (median 14d on market — plan ~3-4 weeks tenant-placement turnaround); solid renter incomes; 154 units permitted in Schenectady County in 2024 (54 in 5+ unit buildings).
Forward outlook
- Local home prices are declining (-3.0%/yr); year-one equity from $2k of loan paydown is wiped out by about $7k of value loss. Plan a longer hold.
- Schenectady County population projected to shrink 4% by 2050 — rents likely to lag national; underwrite the cash flow, not the appreciation.
- At projected returns (-3.0% appreciation + 3.0% rent growth), your $70k cash investment doubles in ~10 years — after that, you're playing with house money.
Negotiation context
- It's been on market 27 days — a 2% lower offer ($246k) is reasonable based on typical stale-listing flexibility.
- 9 sale attempts since 21y ago with the ask held roughly flat each time — persistent listings suggest the price (not the market) is what's stuck; bring a comps-based counter.
- Current owner paid $135k; list at $250k implies a 85% gain — meaningful room to come down on a strong offer.
Risks & watch-outs
- Watch-outs: built in 1900 — expect roof / HVAC / electrical / plumbing capex.
Questions for the listing agent
- Can we see the unit-by-unit rent roll, current vacancy, and any below-market leases? What's the average tenancy length?
- What capital expenditures (roof, boiler, parking lot, exteriors) have been made in the last 5 years, and what's planned in the next 2?
- Built in 1900 — when were the roof, HVAC, electrical panel, plumbing, and water heater last replaced?
- Is there a deadline driving the sale (1031 exchange, divorce, estate, relocation)? That informs how much negotiation room exists.
- Crime grade is F in this area — have there been break-ins, vandalism, or insurance claims at this property in the last 3 years? What carrier currently insures it and at what premium?
- What's the average days-on-market for RENTAL listings here right now (not sales)? A rising rental-DOM trend means longer vacancies and softer asking-rent achievability than the comps imply.
- What's the recent tenant-quality profile in this submarket — average credit score on applications, eviction rate, late-payment / NSF rate, and stable-employment percentage? A property-management company in the area should have these aggregated.
- How much new apartment / multifamily construction is in the pipeline within 1–3 miles? Heavy new supply (>2% of stock underway) typically softens rents 12–24 months out; light construction supports rent growth.
Investment metrics
- 1% rule
- 1.26% ✓
- Cap rate
- 9.37%
- Cash-on-cash
- 10.99%
- DSCR
- 1.49
- GRM
- 6.6
CMA / ARV
- ARV (on-the-fly)
- $198,380
- Comps found
- 12
Show comp detail 12 sales within ~0.75 mi
| Address | Dist | Beds/Ba | Sqft | Sold | Price | $/sf | Match |
|---|---|---|---|---|---|---|---|
| 602 Lansing St | 0.05mi | 4/2.0 | 1,856 (+2%) | 7mo | $176,000 | $95 | 89 |
| 1226 2nd Ave | 0.27mi | 4/2.0 | 1,660 (-9%) | 10mo | $115,000 | $69 | 64 |
| 1180 Van Cortland St | 0.54mi | 3/2.0 (-1) | 1,820 (0%) | 10mo | $222,000 | $122 | 62 |
| 1108 Cutler St | 0.65mi | 4/2.0 | 1,848 (+2%) | 10mo | $278,000 | $150 | 59 |
| 913-915 Bridge St | 0.15mi | 5/2.0 (+1) | 2,056 (+13%) | 10mo | $315,000 | $153 | 58 |
| 634 Hamilton St | 0.41mi | 5/2.0 (+1) | 2,024 (+11%) | 0mo | $210,000 | $104 | 57 |
| 1320 4th Ave | 0.36mi | 4/2.0 | 1,564 (-14%) | 4mo | $242,250 | $155 | 56 |
| 1417 3rd Ave | 0.44mi | 5/3.0 (+1) | 1,600 (-12%) | 2mo | $175,000 | $109 | 49 |
| 1267 Webster St | 0.66mi | 4/2.0 | 1,685 (-7%) | 10mo | $153,000 | $91 | 49 |
| 935 Davis Ter | 0.57mi | 4/2.0 | 2,000 (+10%) | 12mo | $36,000 | $18 | 47 |
| 1007 Strong St | 0.69mi | 4/2.0 | 1,600 (-12%) | 12mo | $181,000 | $113 | 37 |
| 1491 Broadway | 0.54mi | 5/2.0 (+1) | 2,072 (+14%) | 12mo | $44,575 | $22 | 37 |
Match score weights: distance 35% · size 25% · config 20% · recency 20%. Top-matched comps best support the ARV.
Projected returns pro-forma
-3.0% appreciation · 3.0% rent growth · sell at horizon
- IRR
- 0.2%
- Equity multiple
- 1.01×
- Total profit
- $449
- Equity at exit
- $37,261
- IRR
- 9.9%
- Equity multiple
- 1.76×
- Total profit
- $53,442
- Equity at exit
- $21,607
Cash invested: $69,972 (down + closing). Projections, not guarantees.
Landlord ↔ Tenant lean methodology
- Overall (STATE)
- 15 Strongly Tenant-Friendly
- State New York
- 15 Strongly Tenant-Friendly · D+10
- County
- — inherits STATE
- City
- — inherits STATE
ZIP-level market 12303
- Active inventory
- 161
- Price-to-rent
- 13.2×
Monthly cashflow live
- Estimated rent
- $3,145 high interval (Pro) →
- Mortgage (P&I)
- −$1,311
- Tax from tax record
- −$429 /mo · $5,147/yr
- Insurance
- −$104
- HOA
- −$0
- Vacancy / Maint / Mgmt
- −$660
- Net cashflow
- $641
Break-even live
2-unit breakdown (identical units grouped — click to expand)
| Units | Beds | Baths | Est. rent |
|---|---|---|---|
| 2× units | 3 | 1 | $3,146 |
| #1 | 3 | 1 | $1,573 |
| #2 | 3 | 1 | $1,573 |
| Total (2 units) | $3,145 | ||
UW: 25.0% down · 7.5% · 30yr · 1.5% tax · 5.0% vac · 8.0% maint · 8.0% mgmt
Financing live
Cash to close
- Down payment
- $62,475
- Closing costs
- $7,497
- Reserves months
- —
- Total cash needed
- —
Loan-product check · same deal, 3 products live
Conventional
25% down · 7.5% · 30yr
- Down + closing
- —
- Monthly P&I
- —
- Monthly cashflow
- —
- DSCR
- —
- Eligible?
- —
Personal DTI + credit; lowest rate.
DSCR
20% down · 8.5% · 30yr
- Down + closing
- —
- Monthly P&I
- —
- Monthly cashflow
- —
- DSCR
- —
- Eligible?
- —
No personal income docs; deal must DSCR.
Hard money
10% down · 12.0% · 12mo
- Down + closing
- —
- Monthly P&I
- —
- Monthly cashflow
- —
- DSCR
- —
- Eligible?
- —
Short-term bridge; refi at stabilization.
Rent comps 6 comps
| Address | Beds | Baths | Sqft | Rent | $/sqft | DOM | Units | Dist |
|---|---|---|---|---|---|---|---|---|
| 1346 10th Ave Schenectady, NY | 4.0 | 2.0 | 2350 | $2,499 | $1.06 | 14d | 1 | 0.73mi |
| 117 Washington Ave Schenectady, NY | 2.0–4.0 | 1.0–2.0 | 1033 | $2,163 | $2.09 | 14d | 9 | 0.76mi |
| 2007 Campbell Ave Schenectady, NY | 3.0 | 1.0 | 1272 | $1,600 | $1.26 | 14d | 1 | 0.96mi |
| 2030 Euclid Ave Schenectady, NY | 3.0 | 1.0 | 1300 | $2,000 | $1.54 | 19d | 1 | 0.99mi |
| 909 Vischer Ave Schenectady, NY | 3.0 | 1.5 | 1512 | $1,995 | $1.32 | 14d | 1 | 1.43mi |
| 509 Nott St Unit 507 Schenectady, NY | 4.0 | 1.0 | 1400 | $1,695 | $1.21 | 43d | 1 | 1.49mi |
Listing history 42 events
-
2026-06-18days on market $249,900 Active 27 DOM
-
2026-06-17days on market $249,900 Active 26 DOM
-
2026-06-16days on market $249,900 Active 25 DOM
-
2026-06-15days on market $249,900 Active 24 DOM
-
2026-06-14days on market $249,900 Active 22 DOM
-
2026-06-13days on market $249,900 Active 21 DOM
-
2026-06-10days on market $249,900 Active 19 DOM
-
2026-06-09days on market $249,900 Active 18 DOM
-
2026-06-08days on market $249,900 Active 17 DOM
-
2026-06-07days on market $249,900 Active 16 DOM
-
2026-06-03days on market $249,900 Active 12 DOM
-
2026-06-02days on market $249,900 Active 11 DOM
-
2026-06-01days on market $249,900 Active 10 DOM
-
2026-05-31days on market $249,900 Active 9 DOM
-
2026-05-31days on market $249,900 Active 8 DOM
-
2026-05-22$249,900 Active
-
2025-12-30historical
-
2025-10-24price $254,900
-
2025-09-18$264,900 Active
-
2025-05-14soldstatus $135,000
-
2020-06-18historical
-
2020-04-27status Back On Market
-
2020-02-27historical
-
2020-02-07status Back On Market
-
2019-12-09historical
-
2019-12-07status Back On Market
-
2019-10-08historical
-
2019-09-18$65,000 New
-
2016-09-29soldstatus $19,000
-
2016-09-22soldstatus $19,000 Closed (Final Sale)
-
2016-09-13price $1
-
2016-09-13status Pend (Under Cntr)
-
2016-09-13status Price Change
-
2016-09-13status Pend (Under Cntr)
-
2016-08-13price $34,000
-
2016-08-04price $39,900
-
2016-05-27$51,900 New
-
2005-12-29soldstatus $35,555
-
2005-08-10historical
-
2005-06-17$33,000
-
2001-04-17soldstatus $72,000
-
1995-06-09soldstatus $30,000
ⓘ Source: listings_history table (triggers on properties + properties_extension) + one-shot
backfill from property_details.listing_events for pre-trigger history.
Tax reassessment forecast NY · Partial reset (capped growth)
- Current annual tax
- $5,147 · $429/mo
- Projected year-2 tax
- $5,147 · $429/mo
- Expected delta
- $0/yr ($0/mo · 0.0%)
ⓘ Screening estimate from a state-policy table — verify with the county assessor before closing.
Climate risk First Street
- Flood 1/10 Low FEMA zone X (unshaded) · 0% chance over 30 yrs
- Wildfire 3/10 Moderate
- Heat 3/10 Moderate 7 d/yr ≥96°F today · 16 d/yr by 30 yrs out
- Wind 2/10 Low 4% chance of damaging wind over 30 yrs
- Air quality 1/10 Low 0 unhealthy d/yr today · 0 by 30 yrs out
Nearby sold comps map
Loading sold comps map…
Walkable amenities ~0.75 mi
Loading nearby amenities…
Taxation est. · year 1
- Rental income
- $37,740
- − Mortgage interest
- −$13,998
- − Property taxes
- −$5,147
- − Insurance
- −$1,250
- − Repairs & maintenance
- −$3,019
- − Management
- −$3,019
- − Depreciation
- −$7,270
- Taxable income
- $4,037
- Est. tax owed @ 24.0%
- −$969
- After-tax cash flow
- $6,723/yr
For passive investors: Depreciation is non-cash, so a rental often shows a tax loss while cash-flowing — sheltering income. Rental losses are passive: they offset passive income freely, and up to $25,000/yr can offset ordinary (W-2) income if you actively participate and your MAGI is under $100k (phasing out to $0 by $150k); unused losses carry forward. On sale, claimed depreciation is recaptured at up to 25%, and gains may owe capital-gains tax (a 1031 exchange can defer both). Figures are a year-1 estimate at your 24.0% rate — not tax advice; consult a CPA.
Schools (NCES district)
- District
- Schenectady City School District
- NCES district ID
- 3626010
- Math proficiency
- 38% ▲ 12.00%
- Reading proficiency
- 34% ▲ 2.00%
- Median HH income
- $39,453
- Composite
- 30.2/100
- National rank
- #6309
- State rank
- #556 of 590 in NY
Livability — Schenectady
- Score
- 78/100
- State rank
- #167
- US rank
- #2597
Category grades
Schools grade is shown separately in the Schools card above.
Census & demographics
- Census place
- Schenectady, NY
- County
- Schenectady County · 141,369 people
- City population
- 141,369
- Metro
- Albany-Schenectady-Troy, NY
- Population (ZIP)
- 29,360
- Household income
- $84,375
- Rent vs Own
- Severe rent burden
- 1318.0
Population outlook (Schenectady County) Hauer SSP2
- Today (2025)
- 155,046 people
- By 2030
- 154,322 · -0.5%
- By 2040
- 151,796 · -2.1%
- By 2050
- 148,621 · -4.1%
- By 2075
- 141,229 · -8.9%
- By 2100
- 126,014 · -18.7%
Race, ethnicity, and origin ACS 2023
- Neighborhood character
- Predominantly White (66%)
- Race & ethnicity
- White 66% Two or more races 11% Black 10% Hispanic / Latino 9% Asian 4%
- Hispanic origin (detail)
- Mexican 1% Puerto Rican 5%
- Common ancestry
- Romanian 6% Lithuanian 3% Iranian 2%
- Foreign-born
- 10% · Canada, China
- Languages at home
- 90% English-only · Spanish 6% Other Indo-European 2% Chinese 1%
Political lean MEDSL · Schenectady
- 2024 margin
- D (+10.8) · D 55.4% · R 44.6%
- 2008→2024 swing
- -1.8pp toward R · 2008: 12.7pp · 2024: 10.8pp
- All cycles
- 2024: D+10.8 2020: D+15.7 2016: D+5.8 2012: D+15.4 2008: D+12.7
Not yet ingested
- Civics
- —
Market trends
- HPI YoY
- ▼ -151.01%
- Current HPI
- 280.3886
- Rent YoY
- —
- Metro
- Albany-Schenectady-Troy, NY
- State GDP YoY
- ▲ 2.60%
- F500 in state
- 92
Industry mix (Fortune 500 HQ in NY)
| Industry | F500 HQs | Revenue |
|---|---|---|
| Financial Services | 10 | $950B |
|
||
| Consumer Goods | 9 | $162B |
|
||
| Insurance | 4 | $225B |
|
||
| Telecommunications | 2 | $144B |
|
||
| Pharmaceuticals | 2 | $112B |
|
||
| Media / Entertainment | 2 | $69B |
|
||
Price history
+733.0% since first listed27 events — show timeline
- 2026-05-22 Listed $249,900 Global MLS
- 2025-12-30 Listing Removed — Global MLS
- 2025-10-24 Price Changed $254,900 Global MLS
- 2025-09-18 Listed $264,900 Global MLS
- 2025-05-14 Sold (Public Records) $135,000 Public Records
- 2020-06-18 Listing Removed — Global MLS
- 2020-04-27 Relisted — Global MLS
- 2020-02-27 Listing Removed — Global MLS
- 2020-02-07 Relisted — Global MLS
- 2019-12-09 Listing Removed — Global MLS
- 2019-12-07 Relisted — Global MLS
- 2019-10-08 Listing Removed — Global MLS
- 2019-09-18 Listed $65,000 Global MLS
- 2016-09-29 Sold (Public Records) $19,000 Public Records
- 2016-09-22 Sold (MLS) $19,000 Global MLS
- 2016-09-13 Price Changed $1 Global MLS
- 2016-09-13 Pending — Global MLS
- 2016-09-13 Relisted — Global MLS
- 2016-09-13 Pending — Global MLS
- 2016-08-13 Price Changed $34,000 Global MLS
- 2016-08-04 Price Changed $39,900 Global MLS
- 2016-05-27 Listed $51,900 Global MLS
- 2005-12-29 Sold (MLS) $35,555 Global MLS
- 2005-08-10 Listing Removed — Global MLS
- 2005-06-17 Listed $33,000 Global MLS
- 2001-04-17 Sold (Public Records) $72,000 Public Records
- 1995-06-09 Sold (Public Records) $30,000 Public Records
Property tax history
+0.8%/yrLatest (2025): $5,147 · +2.5% YoY. Source: county tax records.
Cash-flow waterfall
monthlySold comps — $/sqft
last 12 mo · ≤1 miLoading sold comps…