 Triplex
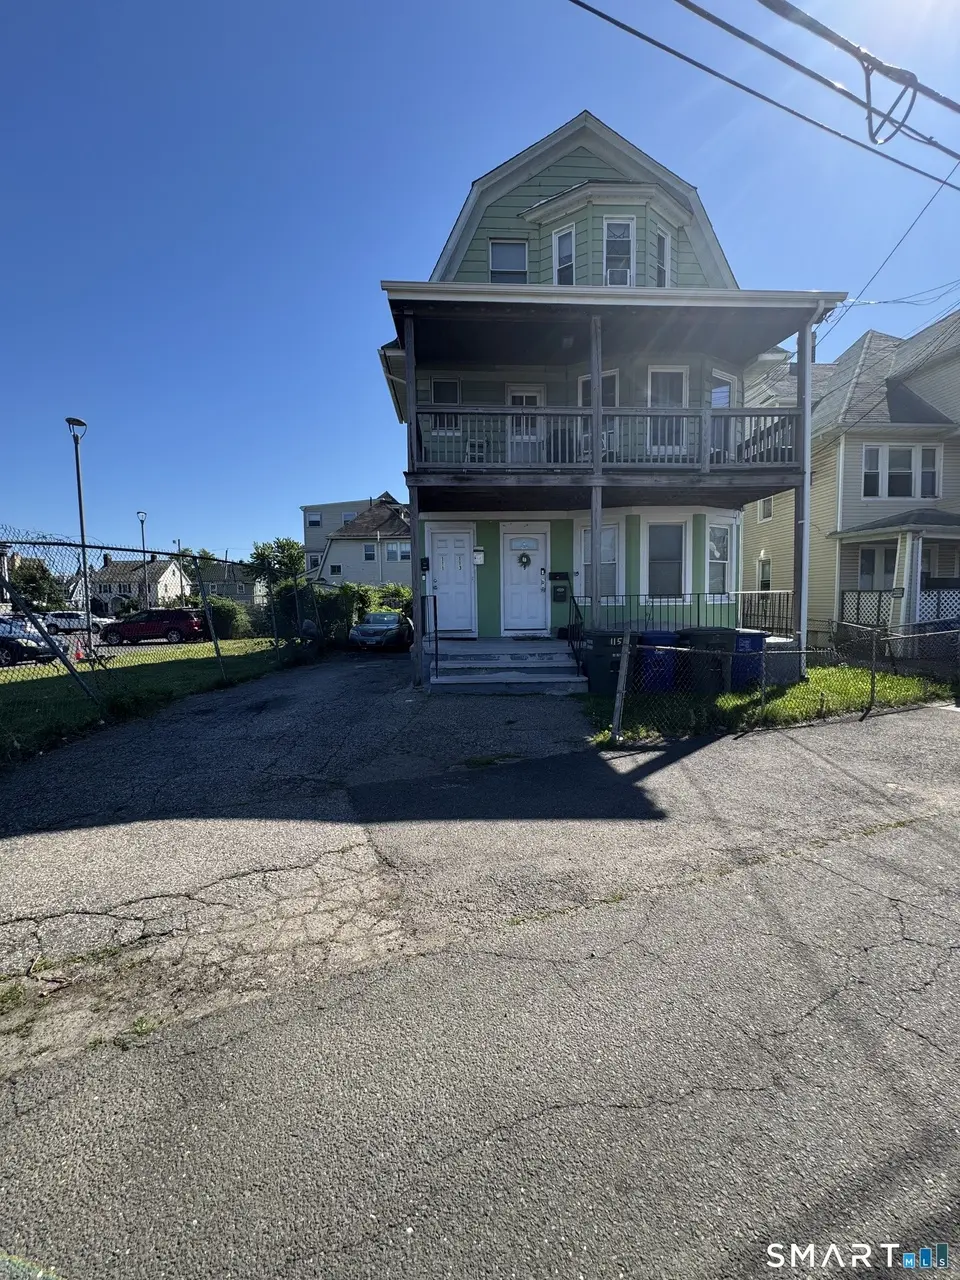
111 Calhoun Pl · Bridgeport, CT
Flood risk 1/10 · Minimal
- FEMA flood zone
- X (unshaded)
- Chance of flooding over 30 yrs
- 0.0%
- Est. flood insurance / yr
- $473 – $860
Fire risk 1/10 · Minimal
- Est. fire insurance / yr
- $829 – $1,539
Heat risk 6/10 · Moderate
- Hot days now (above 97°F)
- 7 days/yr
- Hot days in 30 yrs
- 16 days/yr
Wind risk 6/10 · Moderate
- Chance of severe wind over 30 yrs
- 41.0%
Air-quality risk 4/10 · Minor
- Unhealthy air days now
- 5 days/yr
- Unhealthy air days in 30 yrs
- 7 days/yr
Risk factors via First Street. Map © Google.
Why this score? — see what drove the D+ grade
The composite is a weighted blend of 9 inputs, each scored 0–100. Each bar is that input's sub-score; the figure is the points it added to the 100-point composite (weight × sub-score).
- Cash flow +21.4/30.0
- DSCR +6.8/10.0
- 1% rule +5.2/10.0
- Livability +4.0/5.0
- ARV discount +3.8/15.0
- Rent growth +3.3/5.0
- Condition / age +2.5/5.0
- Schools +1.2/10.0
- Appreciation +0.0/10.0
$650,000
🖨 Deal sheet 📄 Offer letter ✓ Due diligence
Multi-family units
County records classify this as Multi-Family (2-4 Unit). Listing-text estimate: 3 units. confirmed
Listing remarks MLS
3 Family house, offering 2 bedrooms each floor, 1st and 2nd floor freshly paint. close to 95 route 8, town hall and kolbe cathedral High School. make an offer!!!
Key facts
- 2,613 sq ft lot
- 3 parking spots
- Built 1917
Property features AI
Exterior
- Parking: Off-street parking; 3 total parking spaces
- Utilities: Public water (in street); Public sewer (in street); Gas available in street
- Home design: Multi-family (3-family)
- Construction: Frame construction; Block foundation; Asphalt shingle roof
- Exterior features: Level lot; Aluminum and stucco siding; Green exterior color
Interior
- Bedrooms: 6 bedrooms
- Bathrooms: 3 full bathrooms
- Heating & cooling: Hot air heat; Window unit cooling; 30-gallon hot water tank
- Interior features: Full basement; Attic
Neighborhood map
What this means for you Summary
Snapshot
- This is a 3 × 2-bed/1.0-bath units multifamily listed at $650k.
Deal economics
- At list price, monthly cash flow is $968 ($12k/yr) — positive. Per door: $323/mo.
- The deal already cash-flows at list — no discount required.
- Meets the 1% rule at list price ($7k rent vs $650k).
- Cap rate 8.1% vs local median 5.0% in Bridgeport — top-decile yield for the area; either an underpriced asset or a hidden risk that comps aren't pricing in. Stress-test before assuming the spread holds.
Location & tenants
- Location reads 81/100 on livability (#15 in CT, #1,374 nationally) — a professional / high-income tenant draw. Strengths: amenities A+, commute A+, health & safety A+; Watch: crime C-, employment D+, schools D-.
- Bridgeport School District (urban): math 9% / reading 19% proficiency, ranked #151 of 153 in CT (top 99%) — low school quality limits family demand, transient renter base, plan for 1-2y turnover; 97% free/reduced lunch — lower-income household profile, screen leases tightly.
- Market conditions: Rents rising (+3.1%/yr); 152 active listings in the ZIP; 5 comparable units currently listed for rent nearby; rentals at typical pace (median 24d on market — plan ~3-4 weeks tenant-placement turnaround); 40% of comp listings sitting > 30 days — soft ceiling on asking rent; 852 units permitted in Greater Bridgeport Planning Region in 2024 (698 in 5+ unit buildings).
- At $6,600/mo this rent would consume 108% of the median local household income ($73k/yr) (locally 2163% of renters already pay >50% of income on rent) — very limited rent-growth headroom before tenants either downsize or default.
Forward outlook
- Local home prices are declining (-3.0%/yr); year-one equity from $4k of loan paydown is wiped out by about $20k of value loss. Plan a longer hold.
Negotiation context
- Only 14 days on market — expect competitive offers; lowballing is unlikely to land.
- 6 sale attempts since 32y ago with the ask held roughly flat each time — persistent listings suggest the price (not the market) is what's stuck; bring a comps-based counter.
- Current owner paid $205k; list at $650k implies a 217% gain — meaningful room to come down on a strong offer.
Risks & watch-outs
- Watch-outs: built in 1917 — expect roof / HVAC / electrical / plumbing capex.
- Climate carrying-cost: major wind risk, 41% chance of damaging wind over 30y; extreme-heat days projected 7→16/yr by 2055 (HVAC capex compounding) — expect insurance premiums to compound above CPI over the hold.
Questions for the listing agent
- Can we see the unit-by-unit rent roll, current vacancy, and any below-market leases? What's the average tenancy length?
- What capital expenditures (roof, boiler, parking lot, exteriors) have been made in the last 5 years, and what's planned in the next 2?
- Built in 1917 — when were the roof, HVAC, electrical panel, plumbing, and water heater last replaced?
- Is there a deadline driving the sale (1031 exchange, divorce, estate, relocation)? That informs how much negotiation room exists.
- Schools are D-rated, which usually means shorter tenancies and higher turnover. Who's the typical renter profile here, and what's been the actual vacancy rate?
- The area grade is low — what's the realistic commute time and amenity access for the typical tenant pool here? Any planned neighborhood developments (good or bad) we should know about?
- What's the average days-on-market for RENTAL listings here right now (not sales)? A rising rental-DOM trend means longer vacancies and softer asking-rent achievability than the comps imply.
- What's the recent tenant-quality profile in this submarket — average credit score on applications, eviction rate, late-payment / NSF rate, and stable-employment percentage? A property-management company in the area should have these aggregated.
- How much new apartment / multifamily construction is in the pipeline within 1–3 miles? Heavy new supply (>2% of stock underway) typically softens rents 12–24 months out; light construction supports rent growth.
Investment metrics
- 1% rule
- 1.02% ✓
- Cap rate
- 8.08%
- Cash-on-cash
- 6.39%
- DSCR
- 1.28
- GRM
- 8.2
CMA / ARV
- ARV (on-the-fly)
- $600,980
- Comps found
- 12
Show comp detail 12 sales within ~0.75 mi
| Address | Dist | Beds/Ba | Sqft | Sold | Price | $/sf | Match |
|---|---|---|---|---|---|---|---|
| 41-43 Worth St | 0.28mi | 5/3.0 (-1) | 3,044 (+1%) | 0mo | $640,000 | $210 | 80 |
| 103 Highland Ave | 0.26mi | 6/3.0 | 3,122 (+3%) | 10mo | $510,000 | $163 | 74 |
| 213 Harral Ave | 0.09mi | 7/4.0 (+1) | 3,259 (+8%) | 6mo | $650,000 | $199 | 68 |
| 227-229 Laurel Ave | 0.42mi | 6/4.0 | 3,072 (+2%) | 16mo | $691,875 | $225 | 60 |
| 392 Laurel Ave | 0.54mi | 6/3.0 | 3,138 (+4%) | 11mo | $489,500 | $156 | 59 |
| 1599 Park Ave | 0.42mi | 6/2.0 | 3,126 (+4%) | 15mo | $595,000 | $190 | 58 |
| 1522 North Ave | 0.55mi | 7/3.0 (+1) | 2,834 (-6%) | 2mo | $460,000 | $162 | 58 |
| 592 Norman St | 0.33mi | 5/3.0 (-1) | 2,636 (-13%) | 3mo | $510,000 | $193 | 56 |
| 73 Yale St | 0.64mi | 5/3.0 (-1) | 3,044 (+1%) | 14mo | $580,000 | $191 | 52 |
| 414 Wood Ave | 0.53mi | 6/3.0 | 2,653 (-12%) | 4mo | $700,000 | $264 | 52 |
| 1391 North Ave | 0.56mi | 7/2.0 (+1) | 2,816 (-7%) | 13mo | $600,000 | $213 | 43 |
| 533 Clinton Ave | 0.75mi | 6/2.0 | 3,459 (+14%) | 4mo | $690,000 | $199 | 34 |
Match score weights: distance 35% · size 25% · config 20% · recency 20%. Top-matched comps best support the ARV.
Projected returns pro-forma
-3.0% appreciation · 3.12% rent growth · sell at horizon
- IRR
- -6.3%
- Equity multiple
- 0.76×
- Total profit
- $-42,898
- Equity at exit
- $96,917
- IRR
- 3.4%
- Equity multiple
- 1.25×
- Total profit
- $45,144
- Equity at exit
- $56,200
Cash invested: $182,000 (down + closing). Projections, not guarantees.
Landlord ↔ Tenant lean methodology
- Overall (STATE)
- 27 Tenant-Leaning
- State Connecticut
- 27 Tenant-Leaning · D+7
- County
- — inherits STATE
- City
- — inherits STATE
ZIP-level market 06606
- Rents YoY
- 3.1%
- Active inventory
- 152
- Price-to-rent
- 24.6×
Monthly cashflow live
- Estimated rent
- $6,600 high interval (Pro) →
- Mortgage (P&I)
- −$3,409
- Tax from tax record
- −$566 /mo · $6,792/yr
- Insurance
- −$271
- HOA
- −$0
- Vacancy / Maint / Mgmt
- −$1,386
- Net cashflow
- $968
Break-even live
3-unit breakdown (identical units grouped — click to expand)
| Units | Beds | Baths | Est. rent |
|---|---|---|---|
| 3× units | 2 | 1 | $6,600 |
| #1 | 2 | 1 | $2,200 |
| #2 | 2 | 1 | $2,200 |
| #3 | 2 | 1 | $2,200 |
| Total (3 units) | $6,600 | ||
UW: 25.0% down · 7.5% · 30yr · 1.5% tax · 5.0% vac · 8.0% maint · 8.0% mgmt
Financing live
Cash to close
- Down payment
- $162,500
- Closing costs
- $19,500
- Reserves months
- —
- Total cash needed
- —
Loan-product check · same deal, 3 products live
Conventional
25% down · 7.5% · 30yr
- Down + closing
- —
- Monthly P&I
- —
- Monthly cashflow
- —
- DSCR
- —
- Eligible?
- —
Personal DTI + credit; lowest rate.
DSCR
20% down · 8.5% · 30yr
- Down + closing
- —
- Monthly P&I
- —
- Monthly cashflow
- —
- DSCR
- —
- Eligible?
- —
No personal income docs; deal must DSCR.
Hard money
10% down · 12.0% · 12mo
- Down + closing
- —
- Monthly P&I
- —
- Monthly cashflow
- —
- DSCR
- —
- Eligible?
- —
Short-term bridge; refi at stabilization.
Rent comps 5 comps
| Address | Beds | Baths | Sqft | Rent | $/sqft | DOM | Units | Dist |
|---|---|---|---|---|---|---|---|---|
| 107 Catherine St Bridgeport, CT | 7.0 | 2.5 | 4104 | $2,900 | $0.71 | 14d | 1 | 0.40mi |
| 1566 North Ave Bridgeport, CT | 5.0 | 1.0 | 2837 | $2,500 | $0.88 | 43d | 1 | 0.51mi |
| 241 Lewis St Unit 241 Bridgeport, CT | 6.0 | 2.0 | 2300 | $3,500 | $1.52 | 43d | 1 | 0.67mi |
| 7 Armstrong Pl Bridgeport, CT | 5.0 | 1.0 | 2449 | $2,750 | $1.12 | 23d | 1 | 0.79mi |
| 41 Perth St Bridgeport, CT | 6.0 | 2.0 | 2640 | $2,200 | $0.83 | 14d | 1 | 1.37mi |
Listing history 11 events
-
2026-06-18days on market $650,000 Active 14 DOM
-
2026-06-17days on market $650,000 Active 13 DOM
-
2026-06-16days on market $650,000 Active 12 DOM
-
2026-06-15days on market $650,000 Active 11 DOM
-
2026-06-13days on market $650,000 Active 9 DOM
-
2026-06-13days on market $650,000 Active 8 DOM
-
2026-06-10days on market $650,000 Active 6 DOM
-
2026-06-09days on market $650,000 Active 5 DOM
-
2026-06-08days on market $650,000 Active 4 DOM
-
2026-06-07remarks 84-char remark
-
2026-06-07$650,000 Active 3 DOM
ⓘ Source: listings_history table (triggers on properties + properties_extension) + one-shot
backfill from property_details.listing_events for pre-trigger history.
Tax reassessment forecast CT · Partial reset (capped growth)
- Current annual tax
- $6,792 · $566/mo
- Projected year-2 tax
- $10,351 · $863/mo
- Expected delta
- +$3,559/yr (+$297/mo · 52.4%)
ⓘ Screening estimate from a state-policy table — verify with the county assessor before closing.
Climate risk First Street
- Flood 1/10 Low FEMA zone X (unshaded) · 0% chance over 30 yrs
- Wildfire 1/10 Low
- Heat 6/10 Major 7 d/yr ≥97°F today · 16 d/yr by 30 yrs out
- Wind 6/10 Major 41% chance of damaging wind over 30 yrs
- Air quality 4/10 Moderate 5 unhealthy d/yr today · 7 by 30 yrs out
Nearby sold comps map
Loading sold comps map…
Walkable amenities ~0.75 mi
Loading nearby amenities…
Taxation est. · year 1
- Rental income
- $79,200
- − Mortgage interest
- −$36,410
- − Property taxes
- −$6,792
- − Insurance
- −$3,250
- − Repairs & maintenance
- −$6,336
- − Management
- −$6,336
- − Depreciation
- −$18,909
- Taxable income
- $1,167
- Est. tax owed @ 24.0%
- −$280
- After-tax cash flow
- $11,342/yr
For passive investors: Depreciation is non-cash, so a rental often shows a tax loss while cash-flowing — sheltering income. Rental losses are passive: they offset passive income freely, and up to $25,000/yr can offset ordinary (W-2) income if you actively participate and your MAGI is under $100k (phasing out to $0 by $150k); unused losses carry forward. On sale, claimed depreciation is recaptured at up to 25%, and gains may owe capital-gains tax (a 1031 exchange can defer both). Figures are a year-1 estimate at your 24.0% rate — not tax advice; consult a CPA.
Schools (NCES district)
- District
- Bridgeport School District
- NCES district ID
- 0900450
- Math proficiency
- 9% ▼ -7.00%
- Reading proficiency
- 19% ▼ -10.00%
- Median HH income
- $41,507
- Composite
- 12.09/100
- National rank
- #9656
- State rank
- #151 of 153 in CT
Livability — Bridgeport
- Score
- 81/100
- State rank
- #15
- US rank
- #1374
Category grades
Schools grade is shown separately in the Schools card above.
Census & demographics
- Census place
- Bridgeport, CT
- County
- Fairfield County · 765,532 people
- City population
- 149,153
- Metro
- Bridgeport-Stamford-Norwalk, CT
- Population (ZIP)
- 49,308
- Household income
- $73,372
- Rent vs Own
- Severe rent burden
- 2163.0
Population outlook (Greater Bridgeport County) Hauer SSP2
- By 2040
- 365,581
Race, ethnicity, and origin ACS 2023
- Neighborhood character
- Highly diverse neighborhood (Simpson 0.73)
- Race & ethnicity
- Hispanic / Latino 37% White 31% Black 19% Two or more races 11% Asian 7%
- Hispanic origin (detail)
- Mexican 5% Puerto Rican 12% Dominican 4%
- Common ancestry
- Estonian 5% Russian 4% Romanian 3%
- Foreign-born
- 37% · Canada, Jamaica, Vietnam
- Languages at home
- 50% English-only · Spanish 27% Other Indo-European 15% French/Haitian/Cajun 2%
Political lean MEDSL · Greater Bridgeport
- 2024 margin
- Strong D (+23.3) · D 60.9% · R 37.6% · Other 1.5%
- All cycles
- 2024: D+23.3
Not yet ingested
- Civics
- —
Market trends
- HPI YoY
- ▼ -270.11%
- Current HPI
- 345.647
- Rent YoY
- ▲ 3.12%
- Metro
- Bridgeport-Stamford-Norwalk, CT
- State GDP YoY
- ▲ 1.06%
- F500 in state
- 38
Industry mix (Fortune 500 HQ in CT)
| Industry | F500 HQs | Revenue |
|---|---|---|
| Industrial Machinery | 4 | $38B |
|
||
| Insurance | 3 | $71B |
|
||
| Financial Services | 2 | $25B |
|
||
| Transportation / Logistics | 2 | $18B |
|
||
| Healthcare | 1 | $247B |
|
||
| Telecommunications | 1 | $55B |
|
||
Price history
+1202.6% since first listed19 events — show timeline
- 2026-06-04 Listed $650,000 Smart MLS
- 2019-02-04 Sold (Public Records) $205,000 Public Records
- 2019-02-01 Sold (MLS) $205,000 Smart MLS
- 2018-12-28 Listing Removed — Smart MLS
- 2018-11-13 Contingent — Smart MLS
- 2018-08-31 Price Changed $249,000 Smart MLS
- 2018-06-08 Price Changed $255,000 Smart MLS
- 2018-06-06 Listed $155,000 Smart MLS
- 2006-11-06 Sold (Public Records) $249,900 Public Records
- 2006-11-06 Sold (Public Records) $249,900 Public Records
- 2006-10-31 Sold (MLS) $249,900 Smart MLS
- 2006-04-12 Listed $249,900 Smart MLS
- 2004-10-18 Sold (MLS) $180,000 Smart MLS
- 2004-07-08 Listed $189,900 Smart MLS
- 2002-02-25 Sold (Public Records) $59,000 Public Records
- 1995-09-26 Sold (MLS) $14,000 Smart MLS
- 1995-09-19 Listed $19,900 Smart MLS
- 1995-05-09 Listing Removed — Smart MLS
- 1994-11-09 Listed $49,900 Smart MLS
Property tax history
+0.9%/yrLatest (2023): $6,792 · +0.0% YoY. Source: county tax records.
Cash-flow waterfall
monthlySold comps — $/sqft
last 12 mo · ≤1 miLoading sold comps…