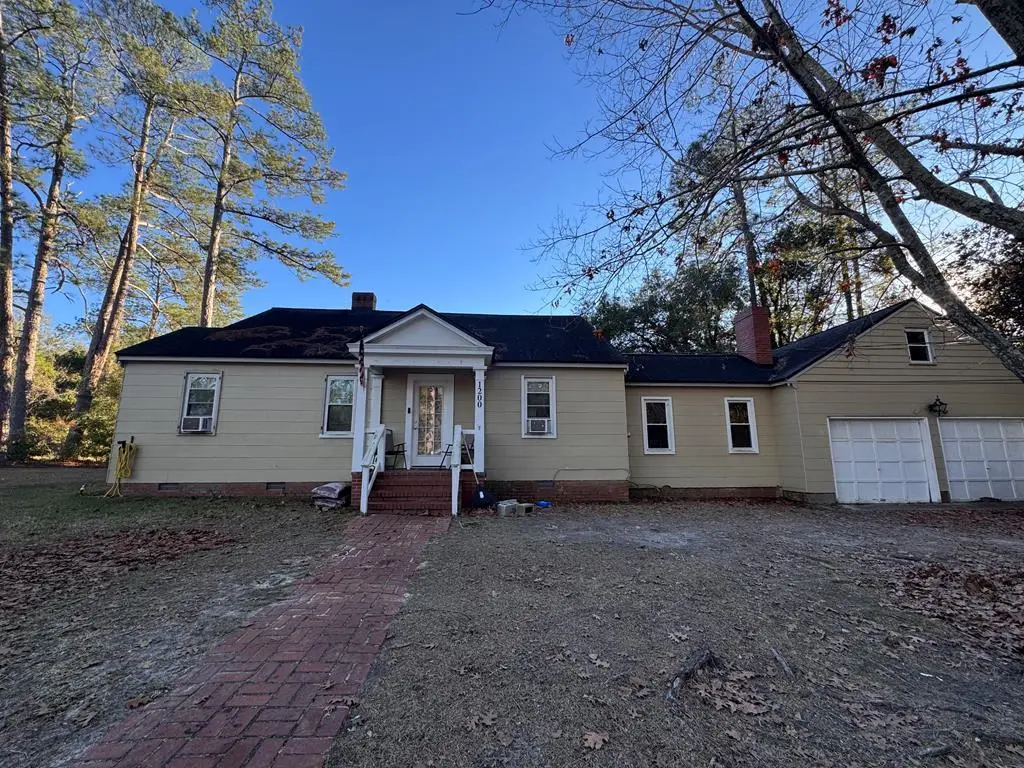
1200 10th St St SW · Moultrie, GA
Flood risk 1/10 · Minimal
- FEMA flood zone
- X (unshaded)
- Chance of flooding over 30 yrs
- 0.0%
- Est. flood insurance / yr
- $507 – $1,088
Fire risk 4/10 · Minor
- Est. fire insurance / yr
- $963 – $1,789
Heat risk 7/10 · Major
- Hot days now (above 107°F)
- 7 days/yr
- Hot days in 30 yrs
- 19 days/yr
Wind risk 8/10 · Major
- Chance of severe wind over 30 yrs
- 99.0%
Air-quality risk 4/10 · Minor
- Unhealthy air days now
- 7 days/yr
- Unhealthy air days in 30 yrs
- 7 days/yr
Risk factors via First Street. Map © Google.
Why this score? — see what drove the D grade
The composite is a weighted blend of 9 inputs, each scored 0–100. Each bar is that input's sub-score; the figure is the points it added to the 100-point composite (weight × sub-score).
- Cash flow +21.1/30.0
- DSCR +6.7/10.0
- 1% rule +4.4/10.0
- Livability +3.0/5.0
- Rent growth +2.5/5.0
- Condition / age +2.5/5.0
- Schools +2.2/10.0
- ARV discount +0.2/15.0
- Appreciation +0.0/10.0
$179,900
🖨 Deal sheet (PDF) 📄 Offer letter ✓ Due diligence
Listing remarks MLS
With 4 bedrooms and 3 baths, this 1710 sq ft home has so much to offer with original hardwood floors and tile through out, living room with fireplace and sunroom. Unique spaces throughout the home can become office or playroom areas to make your vision come to life! Owner is willing to make sure that the home passes for your FHA loan!
Key facts
- Tile throughout
- Unique spaces
- Sunroom
Tags
Neighborhood map
What this means for you Summary
Snapshot
- This is a 4-bed/2.0-bath single-family listed at $180k.
Deal economics
- At list price, monthly cash flow is $257 ($3k/yr) — positive.
- The deal already cash-flows at list — no discount required.
- To meet the 1% rule (rent ≥ 1% of price), the offer needs to be $170k (5.5% below list).
- Recommended offer: $158k (12.0% below list) — sets the bar for market timing.
- Cap rate 8.0% vs local median 4.4% in Moultrie — top-decile yield for the area; either an underpriced asset or a hidden risk that comps aren't pricing in. Stress-test before assuming the spread holds.
Location & tenants
- Location reads 60/100 on livability (#374 in GA) — a middle-class / working-renter tenant base. Strengths: cost of living A+, housing A+; Watch: crime F, commute F, employment F.
- Colquitt County (town): math 29% / reading 25% proficiency, ranked #117 of 174 in GA (top 67%) — low school quality limits family demand, transient renter base, plan for 1-2y turnover; 67% free/reduced lunch — lower-income household profile, screen leases tightly.
- Zoned schools: Wright Elementary School (math 62% / reading 47%, grade C, #185 of 1,228 statewide, top 16%, 521 students, 97% FRL); Willie J. Williams Middle School (math 25% / reading 24%, grade F, #301 of 470 statewide, top 66%, 1,369 students, 85% FRL); Colquitt County High School (math 50% / reading 18%, grade F, #98 of 424 statewide, top 23%, 1,787 students, 64% FRL).
- Market conditions: 139 active listings in the ZIP; 1 comparable units currently listed for rent nearby; 94 units permitted in Colquitt County in 2024 (0 in 5+ unit buildings).
Forward outlook
- Local home prices are declining (-3.0%/yr); year-one equity from $1k of loan paydown is wiped out by about $5k of value loss. Plan a longer hold.
- Colquitt County population projected to shrink 5% by 2050 — rents likely to lag national; underwrite the cash flow, not the appreciation.
Negotiation context
- It's been on market 129 days — a 12% lower offer ($158k) is reasonable based on typical stale-listing flexibility.
- 4 sale attempts since 19y ago; this cycle's ask has dropped $15k (8%) from the opening price — seller is motivated, your offer sets the floor, not the list.
- Current owner paid $32k; list at $180k implies a 462% gain — meaningful room to come down on a strong offer.
Risks & watch-outs
- Climate carrying-cost: severe wind risk, 99% chance of damaging wind over 30y; extreme-heat days projected 7→19/yr by 2055 (HVAC capex compounding) — expect insurance premiums to compound above CPI over the hold.
Questions for the listing agent
- It's been on market 129 days. Have you received any prior offers? Is the seller open to a 12% concession, seller financing, or rate buy-down credit?
- Built in 1965 — when were the roof, HVAC, electrical panel, plumbing, and water heater last replaced?
- Why hasn't it sold? Are there any deal-killer items the seller is aware of (foundation, flood, title, zoning, code violations)?
- Is there a deadline driving the sale (1031 exchange, divorce, estate, relocation)? That informs how much negotiation room exists.
- Schools are F-rated, which usually means shorter tenancies and higher turnover. Who's the typical renter profile here, and what's been the actual vacancy rate?
- Crime grade is F in this area — have there been break-ins, vandalism, or insurance claims at this property in the last 3 years? What carrier currently insures it and at what premium?
- The area grade is low — what's the realistic commute time and amenity access for the typical tenant pool here? Any planned neighborhood developments (good or bad) we should know about?
- What's the average days-on-market for RENTAL listings here right now (not sales)? A rising rental-DOM trend means longer vacancies and softer asking-rent achievability than the comps imply.
- What's the recent tenant-quality profile in this submarket — average credit score on applications, eviction rate, late-payment / NSF rate, and stable-employment percentage? A property-management company in the area should have these aggregated.
- How much new for-sale + rental construction is in the pipeline within 1–3 miles? Heavy new supply typically softens prices + rents 12–24 months out; constrained supply supports both.
Investment metrics
- 1% rule
- 0.94% ✗
- Cap rate
- 8.00%
- Cash-on-cash
- 6.11%
- DSCR
- 1.27
- GRM
- 8.8
CMA / ARV
- ARV (median comp)
- $154,914
- List price
- $179,900
- Delta
- 16.13%
- Verdict
- OVERPRICED
- Comps
- 20 within 1.0 mi
Show comp detail 9 sales within ~0.75 mi
| Address | Dist | Beds/Ba | Sqft | Sold | Price | $/sf | Match |
|---|---|---|---|---|---|---|---|
| 1008 Highland Blvd | 0.04mi | 3/2.0 (-1) | 1,560 (-9%) | 2mo | $129,900 | $83 | 77 |
| 908 West Blvd | 0.57mi | 3/1.0 (-1) | 1,692 (-1%) | 1mo | $185,400 | $110 | 62 |
| 216 7th Ave Ave SW | 0.65mi | 3/2.0 (-1) | 1,713 (+0%) | 10mo | $190,000 | $111 | 56 |
| 1504 10th St St SW | 0.40mi | 3/2.0 (-1) | 1,509 (-12%) | 11mo | $163,000 | $108 | 48 |
| 1501 9th St St SW | 0.37mi | 4/2.0 | 1,946 (+14%) | 20mo | $229,900 | $118 | 43 |
| 912 West Blvd | 0.55mi | 4/4.0 | 1,890 (+10%) | 8mo | $257,000 | $136 | 42 |
| 610 4th Ave Ave SW | 0.70mi | 4/2.0 | 1,467 (-14%) | 5mo | $187,500 | $128 | 39 |
| 1327 4th St SW | 0.60mi | 3/2.0 (-1) | 1,481 (-13%) | 18mo | $225,000 | $152 | 30 |
| 1336 4th St St SW | 0.61mi | 3/2.0 (-1) | 1,500 (-12%) | 24mo | $175,000 | $117 | 26 |
Match score weights: distance 35% · size 25% · config 20% · recency 20%. Top-matched comps best support the ARV.
Projected returns pro-forma
-3.0% appreciation · 3.0% rent growth · sell at horizon
- IRR
- -6.9%
- Equity multiple
- 0.74×
- Total profit
- $-12,877
- Equity at exit
- $26,824
- IRR
- 2.6%
- Equity multiple
- 1.19×
- Total profit
- $9,548
- Equity at exit
- $15,554
Cash invested: $50,372 (down + closing). Projections, not guarantees.
Landlord ↔ Tenant lean methodology
- Overall (STATE)
- 90 Strongly Landlord-Friendly
- State Georgia
- 90 Strongly Landlord-Friendly · R+3
- County
- — inherits STATE
- City
- — inherits STATE
ZIP-level market 31768
- Home prices YoY
- -33.0%
- Active inventory
- 139
- Price-to-rent
- 8.8×
Monthly cashflow live
- Estimated rent
- $1,700 medium interval (Pro) →
- Mortgage (P&I)
- −$943
- Tax from tax record
- −$68 /mo · $816/yr
- Insurance
- −$75
- HOA
- −$0
- Vacancy / Maint / Mgmt
- −$357
- Net cashflow
- $257
Break-even live
Sensitivity live
| Price | -10% $358 | -5% $308 | +0% $257 | +5% $206 | +10% $155 |
|---|---|---|---|---|---|
| Rent | -10% $122 | -5% $189 | +0% $257 | +5% $324 | +10% $391 |
| Rate | -1.0pp $347 | -0.5pp $302 | base $257 | +0.5pp $210 | +1.0pp $163 |
UW: 25.0% down · 7.5% · 30yr · 1.5% tax · 5.0% vac · 8.0% maint · 8.0% mgmt
Financing live
Cash to close
- Down payment
- $44,975
- Closing costs
- $5,397
- Reserves months
- —
- Total cash needed
- —
Loan-product check · same deal, 3 products live
Conventional
25% down · 7.5% · 30yr
- Down + closing
- —
- Monthly P&I
- —
- Monthly cashflow
- —
- DSCR
- —
- Eligible?
- —
Personal DTI + credit; lowest rate.
DSCR
20% down · 8.5% · 30yr
- Down + closing
- —
- Monthly P&I
- —
- Monthly cashflow
- —
- DSCR
- —
- Eligible?
- —
No personal income docs; deal must DSCR.
Hard money
10% down · 12.0% · 12mo
- Down + closing
- —
- Monthly P&I
- —
- Monthly cashflow
- —
- DSCR
- —
- Eligible?
- —
Short-term bridge; refi at stabilization.
Rent comps 1 comps
| Address | Beds | Baths | Sqft | Rent | $/sqft | DOM | Units | Dist |
|---|---|---|---|---|---|---|---|---|
| 203 17th Ave SE Moultrie, GA | 3.0 | 1.5 | 1815 | $1,700 | $0.94 | 23d | 1 | 1.00mi |
Listing history 32 events
-
2026-06-21days on market $179,900 Active 129 DOM
-
2026-06-21days on market $179,900 Active 128 DOM
-
2026-06-18days on market $179,900 Active 126 DOM
-
2026-06-17days on market $179,900 Active 125 DOM
-
2026-06-16days on market $179,900 Active 124 DOM
-
2026-06-15days on market $179,900 Active 123 DOM
-
2026-06-13days on market $179,900 Active 121 DOM
-
2026-06-12days on market $179,900 Active 120 DOM
-
2026-06-09days on market $179,900 Active 117 DOM
-
2026-06-08days on market $179,900 Active 116 DOM
-
2026-06-07days on market $179,900 Active 115 DOM
-
2026-06-07days on market $179,900 Active 114 DOM
-
2026-06-04days on market $179,900 Active 111 DOM
-
2026-06-02days on market $179,900 Active 110 DOM
-
2026-06-01days on market $179,900 Active 109 DOM
-
2026-05-31days on market $179,900 Active 108 DOM
-
2026-05-31days on market $179,900 Active 107 DOM
-
2026-04-25price $179,900 336-char remark
Show marketing remark (336 chars)
With 4 bedrooms and 3 baths, this 1710 sq ft home has so much to offer with original hardwood floors and tile through out, living room with fireplace and sunroom. Unique spaces throughout the home can become office or playroom areas to make your vision come to life! Owner is willing to make sure that the home passes for your FHA loan!
-
2026-02-12$195,000 Active 336-char remark
Show marketing remark (336 chars)
With 4 bedrooms and 3 baths, this 1710 sq ft home has so much to offer with original hardwood floors and tile through out, living room with fireplace and sunroom. Unique spaces throughout the home can become office or playroom areas to make your vision come to life! Owner is willing to make sure that the home passes for your FHA loan!
-
2025-02-11historical
-
2024-10-03price $149,900
-
2024-09-18price $154,900
-
2024-08-26price $160,000
-
2024-08-18price $165,000
-
2024-08-11$170,000 New
-
2013-01-28soldstatus $32,000
-
2012-11-27$30,000
-
2008-04-07soldstatus $92,000
-
2008-04-07soldstatus $92,000
-
2007-07-10$89,900
-
1998-12-17soldstatus $60,000
-
1993-07-22soldstatus $55,000
ⓘ Source: listings_history table (triggers on properties + properties_extension) + one-shot
backfill from property_details.listing_events for pre-trigger history.
Tax reassessment forecast GA · Resets to sale price
- Current annual tax
- $816 · $68/mo
- Projected year-2 tax
- $1,655 · $138/mo
- Expected delta
- +$839/yr (+$70/mo · 102.9%)
ⓘ Screening estimate from a state-policy table — verify with the county assessor before closing.
Climate risk First Street
- Flood 1/10 Low FEMA zone X (unshaded) · 0% chance over 30 yrs
- Wildfire 4/10 Moderate
- Heat 7/10 Severe 7 d/yr ≥107°F today · 19 d/yr by 30 yrs out
- Wind 8/10 Severe 99% chance of damaging wind over 30 yrs
- Air quality 4/10 Moderate 7 unhealthy d/yr today · 7 by 30 yrs out
Nearby sold comps map
Loading sold comps map…
Walkable amenities ~0.75 mi
Loading nearby amenities…
Taxation est. · year 1
- Rental income
- $20,400
- − Mortgage interest
- −$10,077
- − Property taxes
- −$816
- − Insurance
- −$900
- − Repairs & maintenance
- −$1,632
- − Management
- −$1,632
- − Depreciation
- −$5,233
- Taxable income
- $110
- Est. tax owed @ 24.0%
- −$26
- After-tax cash flow
- $3,053/yr
For passive investors: Depreciation is non-cash, so a rental often shows a tax loss while cash-flowing — sheltering income. Rental losses are passive: they offset passive income freely, and up to $25,000/yr can offset ordinary (W-2) income if you actively participate and your MAGI is under $100k (phasing out to $0 by $150k); unused losses carry forward. On sale, claimed depreciation is recaptured at up to 25%, and gains may owe capital-gains tax (a 1031 exchange can defer both). Figures are a year-1 estimate at your 24.0% rate — not tax advice; consult a CPA.
Schools (NCES district)
- District
- Colquitt County
- NCES district ID
- 1301380
- Math proficiency
- 29% ▼ -7.00%
- Reading proficiency
- 25% ▼ -5.00%
- Median HH income
- $32,950
- Composite
- 22.11/100
- National rank
- #8176
- State rank
- #117 of 174 in GA
Livability — Moultrie
- Score
- 60/100
- State rank
- #374
- US rank
- #18973
Category grades
Schools grade is shown separately in the Schools card above.
Census & demographics
- Census place
- Moultrie, GA
- Population (ZIP)
- 21,281
Population outlook (Colquitt County) Hauer SSP2
- Today (2025)
- 46,043 people
- By 2030
- 45,757 · -0.6%
- By 2040
- 44,929 · -2.4%
- By 2050
- 43,901 · -4.7%
- By 2075
- 40,831 · -11.3%
- By 2100
- 37,986 · -17.5%
Race, ethnicity, and origin ACS 2023
- Neighborhood character
- Diverse neighborhood (Simpson 0.61)
- Race & ethnicity
- White 51% Black 33% Hispanic / Latino 14% Two or more races 4% Native American 1%
- Hispanic origin (detail)
- Mexican 10% Puerto Rican 1% Cuban 2%
- Common ancestry
- Serbian 1% Italian 1% Lithuanian 1%
- Foreign-born
- 7% · Canada
- Languages at home
- 86% English-only · Spanish 13% German/W. Germanic 1%
Political lean MEDSL · Colquitt
- 2024 margin
- Solid R (+50.2) · D 24.8% · R 75.0%
- 2008→2024 swing
- -12.6pp toward R · 2008: -37.6pp · 2024: -50.2pp
- All cycles
- 2024: R+50.2 2020: R+47.2 2016: R+47.3 2012: R+39.6 2008: R+37.6
Not yet ingested
- Civics
- —
Market trends
- HPI YoY
- ▼ -93.21%
- Current HPI
- 188.988
- Rent YoY
- —
- Metro
- —
- State GDP YoY
- ▲ 2.66%
- F500 in state
- 28
Industry mix (Fortune 500 HQ in GA)
| Industry | F500 HQs | Revenue |
|---|---|---|
| Paper / Packaging | 2 | $29B |
|
||
| Retail | 1 | $160B |
|
||
| Transportation / Logistics | 1 | $91B |
|
||
| Airlines | 1 | $62B |
|
||
| Consumer Goods | 1 | $47B |
|
||
| Utilities | 1 | $25B |
|
||
Price history
+227.1% since first listed15 events — show timeline
- 2026-04-25 Price Changed $179,900 MBOR
- 2026-02-12 Listed $195,000 MBOR
- 2025-02-11 Listing Removed — GAMLS
- 2024-10-03 Price Changed $149,900 GAMLS
- 2024-09-18 Price Changed $154,900 GAMLS
- 2024-08-26 Price Changed $160,000 GAMLS
- 2024-08-18 Price Changed $165,000 GAMLS
- 2024-08-11 Listed $170,000 GAMLS
- 2013-01-28 Sold (MLS) $32,000 MBOR
- 2012-11-27 Listed $30,000 MBOR
- 2008-04-07 Sold (Public Records) $92,000 Public Records
- 2008-04-07 Sold (MLS) $92,000 MBOR
- 2007-07-10 Listed $89,900 MBOR
- 1998-12-17 Sold (Public Records) $60,000 Public Records
- 1993-07-22 Sold (Public Records) $55,000 Public Records
Property tax history
+4.1%/yrLatest (2025): $816 · +7.1% YoY. Source: county tax records.
Cash-flow waterfall
monthlySold comps — $/sqft
last 12 mo · ≤1 miLoading sold comps…