356 Lee Road 831 · Smiths Station, AL
Flood risk 1/10 · Minimal
- FEMA flood zone
- X (unshaded)
- Chance of flooding over 30 yrs
- 0.0%
- Est. flood insurance / yr
- $507 – $1,088
Fire risk 5/10 · Moderate
- Est. fire insurance / yr
- $916 – $1,700
Heat risk 6/10 · Moderate
- Hot days now (above 105°F)
- 7 days/yr
- Hot days in 30 yrs
- 19 days/yr
Wind risk 6/10 · Moderate
- Chance of severe wind over 30 yrs
- 66.0%
Air-quality risk 2/10 · Minimal
- Unhealthy air days now
- 1 days/yr
- Unhealthy air days in 30 yrs
- 1 days/yr
Risk factors via First Street. Map © Google.
Why this score? — see what drove the B+ grade
The composite is a weighted blend of 9 inputs, each scored 0–100. Each bar is that input's sub-score; the figure is the points it added to the 100-point composite (weight × sub-score).
- Cash flow +30.0/30.0
- ARV discount +15.0/15.0
- 1% rule +10.0/10.0
- DSCR +10.0/10.0
- Livability +3.2/5.0
- Schools +3.0/10.0
- Rent growth +2.5/5.0
- Condition / age +2.5/5.0
- Appreciation +0.0/10.0
$107,000
🖨 Deal sheet 📄 Offer letter ✓ Due diligence
Listing remarks MLS
COMP USE ONLY
Key facts
- Fully bricked
- Barn
- Kitchen remodeled
Tags
Neighborhood map
What this means for you Summary
Snapshot
- This is a 3-bed/2.0-bath manufactured listed at $107k.
Deal economics
- At list price, monthly cash flow is $950 ($11k/yr) — positive.
- The deal already cash-flows at list — no discount required.
- Meets the 1% rule at list price ($2k rent vs $107k).
- Recommended offer: $94k (12.0% below list) — sets the bar for market timing.
- Cap rate 16.9% vs local median 3.5% in Smiths Station — top-decile yield for the area; either an underpriced asset or a hidden risk that comps aren't pricing in. Stress-test before assuming the spread holds.
Location & tenants
- Location reads 65/100 on livability (#129 in AL) — a middle-class / working-renter tenant base. Strengths: cost of living A+, housing A+, crime A-; Watch: schools C-, employment D, amenities F.
- Lee County (rural): math 23% / reading 47% proficiency, ranked #40 of 129 in AL (top 31%) — families likely to look elsewhere, expect single-tenant / working-renter base with shorter leases.
- Market conditions: 125 active listings in the ZIP; 1,858 units permitted in Lee County in 2024 (113 in 5+ unit buildings).
Forward outlook
- Local home prices are declining (-3.0%/yr); year-one equity from $740 of loan paydown is wiped out by about $3k of value loss. Plan a longer hold.
- Lee County population projected at +54% by 2050 — long-run rental-demand tailwind backs the buy-and-hold thesis.
- At projected returns (-3.0% appreciation + 3.0% rent growth), your $30k cash investment doubles in ~4 years — after that, you're playing with house money.
Negotiation context
- It's been on market 144 days — a 12% lower offer ($94k) is reasonable based on typical stale-listing flexibility.
- 2 sale attempts with the ask held roughly flat each time — persistent listings suggest the price (not the market) is what's stuck; bring a comps-based counter.
Risks & watch-outs
- Climate carrying-cost: major wind risk, 66% chance of damaging wind over 30y; moderate wildfire risk; extreme-heat days projected 7→19/yr by 2055 (HVAC capex compounding) — expect insurance premiums to compound above CPI over the hold.
Questions for the listing agent
- It's been on market 144 days. Have you received any prior offers? Is the seller open to a 12% concession, seller financing, or rate buy-down credit?
- Why hasn't it sold? Are there any deal-killer items the seller is aware of (foundation, flood, title, zoning, code violations)?
- Is there a deadline driving the sale (1031 exchange, divorce, estate, relocation)? That informs how much negotiation room exists.
- What's the average days-on-market for RENTAL listings here right now (not sales)? A rising rental-DOM trend means longer vacancies and softer asking-rent achievability than the comps imply.
- What's the recent tenant-quality profile in this submarket — average credit score on applications, eviction rate, late-payment / NSF rate, and stable-employment percentage? A property-management company in the area should have these aggregated.
- How much new for-sale + rental construction is in the pipeline within 1–3 miles? Heavy new supply typically softens prices + rents 12–24 months out; constrained supply supports both.
Investment metrics
- 1% rule
- 1.88% ✓
- Cap rate
- 16.95%
- Cash-on-cash
- 38.05%
- DSCR
- 2.69
- GRM
- 4.4
CMA / ARV
- ARV (median comp)
- $177,613
- List price
- $107,000
- Delta
- -39.76%
- Verdict
- UNDERPRICED
- Comps
- 1 within 2.0 mi
Projected returns pro-forma
-3.0% appreciation · 3.0% rent growth · sell at horizon
- IRR
- 34.1%
- Equity multiple
- 2.44×
- Total profit
- $43,142
- Equity at exit
- $15,954
- IRR
- 41.0%
- Equity multiple
- 4.85×
- Total profit
- $115,363
- Equity at exit
- $9,251
Cash invested: $29,960 (down + closing). Projections, not guarantees.
Landlord ↔ Tenant lean methodology
- Overall (STATE)
- 90 Strongly Landlord-Friendly
- State Alabama
- 90 Strongly Landlord-Friendly · R+15
- County
- — inherits STATE
- City
- — inherits STATE
ZIP-level market 36874
- Home prices YoY
- -28.1%
- Active inventory
- 125
- Price-to-rent
- 4.4×
Monthly cashflow live
- Estimated rent
- $2,015 medium interval (Pro) →
- Mortgage (P&I)
- −$561
- Tax from tax record
- −$36 /mo · $433/yr
- Insurance
- −$45
- HOA
- −$0
- Vacancy / Maint / Mgmt
- −$423
- Net cashflow
- $950
Break-even live
UW: 25.0% down · 7.5% · 30yr · 1.5% tax · 5.0% vac · 8.0% maint · 8.0% mgmt
Financing live
Cash to close
- Down payment
- $26,750
- Closing costs
- $3,210
- Reserves months
- —
- Total cash needed
- —
Loan-product check · same deal, 3 products live
Conventional
25% down · 7.5% · 30yr
- Down + closing
- —
- Monthly P&I
- —
- Monthly cashflow
- —
- DSCR
- —
- Eligible?
- —
Personal DTI + credit; lowest rate.
DSCR
20% down · 8.5% · 30yr
- Down + closing
- —
- Monthly P&I
- —
- Monthly cashflow
- —
- DSCR
- —
- Eligible?
- —
No personal income docs; deal must DSCR.
Hard money
10% down · 12.0% · 12mo
- Down + closing
- —
- Monthly P&I
- —
- Monthly cashflow
- —
- DSCR
- —
- Eligible?
- —
Short-term bridge; refi at stabilization.
Listing history 23 events
-
2026-06-18days on market $107,000 Active 144 DOM
-
2026-06-17days on market $107,000 Active 143 DOM
-
2026-06-16days on market $107,000 Active 142 DOM
-
2026-06-15days on market $107,000 Active 141 DOM
-
2026-06-14days on market $107,000 Active 139 DOM
-
2026-06-13days on market $107,000 Active 138 DOM
-
2026-06-10days on market $107,000 Active 136 DOM
-
2026-06-09days on market $107,000 Active 135 DOM
-
2026-06-08days on market $107,000 Active 134 DOM
-
2026-06-07days on market $107,000 Active 133 DOM
-
2026-06-05days on market $107,000 Active 130 DOM
-
2026-06-03days on market $107,000 Active 129 DOM
-
2026-06-02days on market $107,000 Active 128 DOM
-
2026-06-01days on market $107,000 Active 127 DOM
-
2026-05-31days on market $107,000 Active 126 DOM
-
2026-05-30days on market $107,000 Active 125 DOM
-
2026-04-13soldstatus $115,000 13-char remark
Show marketing remark (13 chars)
COMP USE ONLY
-
2026-01-21$107,000 Active 883-char remark
Show marketing remark (883 chars)
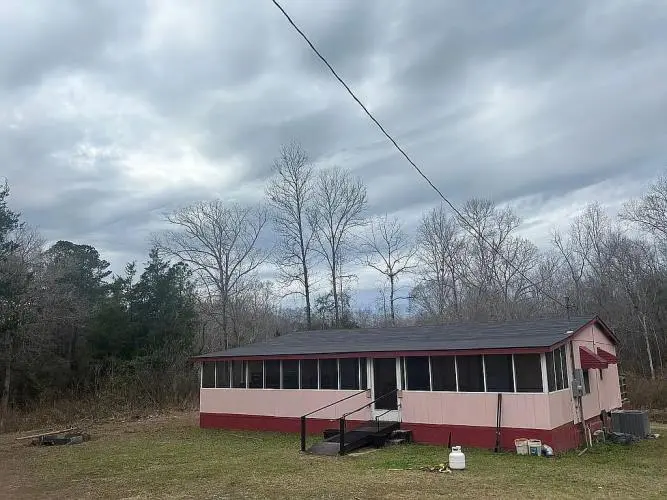
This charming three-bedroom, two-bathroom home sits on a beautiful two-acre lot, offering both space and privacy. Originally a mobile home, it was fully bricked in 2017, giving it the solid look and feel of a traditional house while maintaining its warm, cozy character. The kitchen was completely remodeled in 2023 and features a brand-new design with modern finishes, along with updated appliances that make cooking and entertaining easy. Both bathrooms have also been newly renovated, adding style and comfort throughout the home. Outside, the property truly shines with wide open land and a barn, making it ideal for animals, storage, or hobby use. With peaceful surroundings, plenty of room to roam, and a welcoming atmosphere, this home offers the perfect blend of country living and everyday comfort. Slightly under 2 acres. A new roof was added during the remodeling process.
-
2025-08-06price $112,000
-
2025-06-02price $113,000
-
2025-05-15price $114,000
-
2025-04-15price $115,000
-
2025-02-13$120,000 Active
ⓘ Source: listings_history table (triggers on properties + properties_extension) + one-shot
backfill from property_details.listing_events for pre-trigger history.
Tax reassessment forecast AL · Resets to sale price
- Current annual tax
- $433 · $36/mo
- Projected year-2 tax
- $439 · $37/mo
- Expected delta
- +$6/yr ($0/mo · 1.3%)
ⓘ Screening estimate from a state-policy table — verify with the county assessor before closing.
Climate risk First Street
- Flood 1/10 Low FEMA zone X (unshaded) · 0% chance over 30 yrs
- Wildfire 5/10 Major
- Heat 6/10 Major 7 d/yr ≥105°F today · 19 d/yr by 30 yrs out
- Wind 6/10 Major 66% chance of damaging wind over 30 yrs
- Air quality 2/10 Low 1 unhealthy d/yr today · 1 by 30 yrs out
Nearby sold comps map
Loading sold comps map…
Walkable amenities ~0.75 mi
Loading nearby amenities…
Taxation est. · year 1
- Rental income
- $24,180
- − Mortgage interest
- −$5,994
- − Property taxes
- −$433
- − Insurance
- −$535
- − Repairs & maintenance
- −$1,934
- − Management
- −$1,934
- − Depreciation
- −$3,113
- Taxable income
- $10,237
- Est. tax owed @ 24.0%
- −$2,457
- After-tax cash flow
- $8,944/yr
For passive investors: Depreciation is non-cash, so a rental often shows a tax loss while cash-flowing — sheltering income. Rental losses are passive: they offset passive income freely, and up to $25,000/yr can offset ordinary (W-2) income if you actively participate and your MAGI is under $100k (phasing out to $0 by $150k); unused losses carry forward. On sale, claimed depreciation is recaptured at up to 25%, and gains may owe capital-gains tax (a 1031 exchange can defer both). Figures are a year-1 estimate at your 24.0% rate — not tax advice; consult a CPA.
Schools (NCES district)
- District
- Lee County
- NCES district ID
- 0102070
- Math proficiency
- 23% ▼ -27.00%
- Reading proficiency
- 47% ▬ 0.00%
- Median HH income
- $47,786
- Composite
- 30.04/100
- National rank
- #6355
- State rank
- #40 of 129 in AL
Livability — Smiths Station
- Score
- 65/100
- State rank
- #129
- US rank
- #13134
Category grades
Schools grade is shown separately in the Schools card above.
Census & demographics
- Population (ZIP)
- 10,329
Population outlook (Lee County) Hauer SSP2
- Today (2025)
- 196,440 people
- By 2030
- 217,417 · +10.7%
- By 2040
- 259,467 · +32.1%
- By 2050
- 301,557 · +53.5%
- By 2075
- 402,186 · +104.7%
- By 2100
- 474,503 · +141.6%
Race, ethnicity, and origin ACS 2023
- Neighborhood character
- Predominantly White (77%)
- Race & ethnicity
- White 77% Black 19% Hispanic / Latino 3% Two or more races 2%
- Common ancestry
- Slovak 3% Serbian 2% Lithuanian 1%
- Foreign-born
- 4% · Canada
- Languages at home
- 98% English-only · German/W. Germanic 1% Spanish 1%
Political lean MEDSL · Lee
- 2024 margin
- Strong R (+27.8) · D 35.5% · R 63.3% · Other 1.2%
- 2008→2024 swing
- -8.1pp toward R · 2008: -19.8pp · 2024: -27.8pp
- All cycles
- 2024: R+27.8 2020: R+20.1 2016: R+23.1 2012: R+19.9 2008: R+19.8
Not yet ingested
- Civics
- —
Market trends
- HPI YoY
- ▼ -85.13%
- Current HPI
- 218.2835
- Rent YoY
- —
- Metro
- —
- State GDP YoY
- ▲ 2.94%
- F500 in state
- 4
Industry mix (Fortune 500 HQ in AL)
| Industry | F500 HQs | Revenue |
|---|---|---|
| Financial Services | 1 | $8B |
|
||
| Healthcare | 1 | $5B |
|
||
Price history
-4.2% since first listed7 events — show timeline
- 2026-04-13 Sold (MLS) $115,000 EABOR
- 2026-01-21 Listed $107,000 Fizber.com
- 2025-08-06 Price Changed $112,000 EABOR
- 2025-06-02 Price Changed $113,000 EABOR
- 2025-05-15 Price Changed $114,000 EABOR
- 2025-04-15 Price Changed $115,000 EABOR
- 2025-02-13 Listed $120,000 EABOR
Property tax history
+5.7%/yrLatest (2025): $433 · +6.0% YoY. Source: county tax records.
Cash-flow waterfall
monthlySold comps — $/sqft
last 12 mo · ≤1 miLoading sold comps…