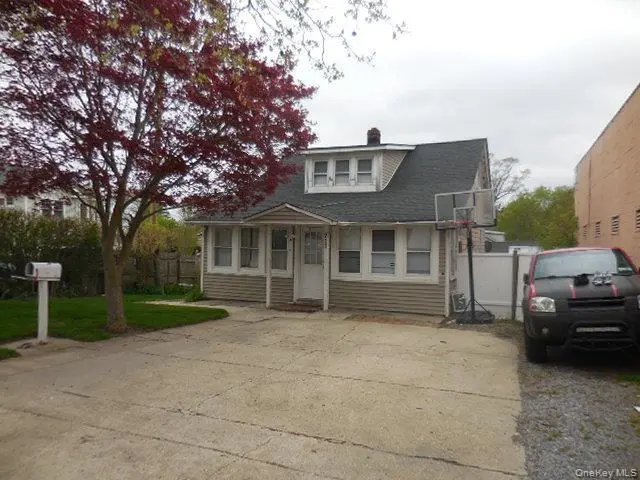
211 Lowndes Ave · Huntington Station, NY
Flood risk 1/10 · Minimal
- FEMA flood zone
- X (unshaded)
- Chance of flooding over 30 yrs
- 0.0%
- Est. flood insurance / yr
- $473 – $860
Fire risk 1/10 · Minimal
- Est. fire insurance / yr
- $691 – $1,283
Heat risk 5/10 · Moderate
- Hot days now (above 97°F)
- 7 days/yr
- Hot days in 30 yrs
- 15 days/yr
Wind risk 8/10 · Major
- Chance of severe wind over 30 yrs
- 80.0%
Air-quality risk 4/10 · Minor
- Unhealthy air days now
- 4 days/yr
- Unhealthy air days in 30 yrs
- 6 days/yr
Risk factors via First Street. Map © Google.
Why this score? — see what drove the C+ grade
The composite is a weighted blend of 9 inputs, each scored 0–100. Each bar is that input's sub-score; the figure is the points it added to the 100-point composite (weight × sub-score).
- Cash flow +19.5/30.0
- ARV discount +15.0/15.0
- DSCR +6.2/10.0
- 1% rule +5.2/10.0
- Schools +4.6/10.0
- Livability +4.0/5.0
- Rent growth +3.6/5.0
- Condition / age +2.5/5.0
- Appreciation +0.0/10.0
$430,600
🖨 Deal sheet 📄 Offer letter ✓ Due diligence
Listing remarks
Corner Lot.
Key facts
- Corner lot
- 4,792 sq ft lot
- Built 1934
Tags
Property features AI
Exterior
- Parking: Driveway; No carport
- Utilities: Electricity connected (PSEG); Water connected; Cesspool sewer
- Home design: Single family residence
- Construction: Vinyl and wood siding construction
- Exterior features: Vinyl siding; Wood siding; Not waterfront
Interior
- Kitchen: Appliances: Other
- Bedrooms: Includes a bedroom on the first floor
- Bathrooms: 1 full bathroom
- Heating & cooling: Hot water heating; No central cooling
- Interior features: First-floor bedroom; 7 total rooms; Basement (see remarks); Attic (see remarks)
Neighborhood map
What this means for you Summary
Snapshot
- This is a 4-bed/1.0-bath single-family listed at $431k.
Deal economics
- At list price, monthly cash flow is $490 ($6k/yr) — positive.
- The deal already cash-flows at list — no discount required.
- Meets the 1% rule at list price ($4k rent vs $431k).
- Recommended offer: $418k (3.0% below list) — sets the bar for market timing.
- Cap rate 7.7% vs local median 4.1% in Huntington Station — top-decile yield for the area; either an underpriced asset or a hidden risk that comps aren't pricing in. Stress-test before assuming the spread holds.
Location & tenants
- Location reads 79/100 on livability (#126 in NY, #2,028 nationally) — a middle-class / working-renter tenant base. Strengths: commute A+, employment A+, housing A+; Watch: amenities D, cost of living F.
- Huntington Union Free School District (suburban): math 45% / reading 52% proficiency, ranked #328 of 590 in NY (top 56%) — families likely to look elsewhere, expect single-tenant / working-renter base with shorter leases.
- Zoned schools: Flower Hill School (math 62% / reading 62%, grade B, #675 of 2,108 statewide, top 35%, 273 students, 56% FRL); J Taylor Finley Middle School (math 25% / reading 44%, grade F, #483 of 729 statewide, top 68%, 623 students, 58% FRL); Huntington High School (math 91% / reading 92%, grade A+, #197 of 1,100 statewide, top 18%, 1,410 students, 56% FRL) — zoned schools average 57% FRL vs 34% district-wide (23 pts higher); higher-poverty schools than district average — tighter screening recommended.
- Zoned-school proficiency averages 63% at this address vs 48% district-wide (+14 pts) — the actual schools serving this property are materially stronger than the Huntington Union Free School District average implies; a family-tenant draw the district grade alone would hide.
- Market conditions: Rents rising fast (+4.5%/yr); 308 active listings in the ZIP; 5 comparable units currently listed for rent nearby; rentals leasing fast (median 1d on market — plan ~1-2 weeks tenant-placement turnaround); high-income renter base; 1,366 units permitted in Suffolk County in 2024 (216 in 5+ unit buildings).
- This rent runs 32% of the median local income ($165k/yr) — at the standard rent-burdened threshold; future hikes will face affordability resistance.
Forward outlook
- Local home prices are declining (-3.0%/yr); year-one equity from $3k of loan paydown is wiped out by about $13k of value loss. Plan a longer hold.
- Suffolk County population projected to shrink 5% by 2050 — rents likely to lag national; underwrite the cash flow, not the appreciation.
Negotiation context
- It's been on market 52 days — a 3% lower offer ($418k) is reasonable based on typical stale-listing flexibility.
- Current owner paid $100k; list at $431k implies a 331% gain — meaningful room to come down on a strong offer.
Risks & watch-outs
- Watch-outs: built in 1934 — expect roof / HVAC / electrical / plumbing capex.
- Climate carrying-cost: severe wind risk, 80% chance of damaging wind over 30y; extreme-heat days projected 7→15/yr by 2055 (HVAC capex compounding) — expect insurance premiums to compound above CPI over the hold.
Questions for the listing agent
- It's been on market 52 days. Have you received any prior offers? Is the seller open to a 3% concession, seller financing, or rate buy-down credit?
- Built in 1934 — when were the roof, HVAC, electrical panel, plumbing, and water heater last replaced?
- Is there a deadline driving the sale (1031 exchange, divorce, estate, relocation)? That informs how much negotiation room exists.
- Schools are D-rated, which usually means shorter tenancies and higher turnover. Who's the typical renter profile here, and what's been the actual vacancy rate?
- What's the average days-on-market for RENTAL listings here right now (not sales)? A rising rental-DOM trend means longer vacancies and softer asking-rent achievability than the comps imply.
- What's the recent tenant-quality profile in this submarket — average credit score on applications, eviction rate, late-payment / NSF rate, and stable-employment percentage? A property-management company in the area should have these aggregated.
- How much new for-sale + rental construction is in the pipeline within 1–3 miles? Heavy new supply typically softens prices + rents 12–24 months out; constrained supply supports both.
Investment metrics
- 1% rule
- 1.02% ✓
- Cap rate
- 7.66%
- Cash-on-cash
- 4.88%
- DSCR
- 1.22
- GRM
- 8.2
CMA / ARV
- ARV (median comp)
- $651,303
- List price
- $430,600
- Delta
- -33.89%
- Verdict
- UNDERPRICED
- Comps
- 20 within 1.0 mi
Show comp detail 12 sales within ~0.75 mi
| Address | Dist | Beds/Ba | Sqft | Sold | Price | $/sf | Match |
|---|---|---|---|---|---|---|---|
| 128 Winding St | 0.14mi | 3/1.0 (-1) | 1,398 (+8%) | 6mo | $635,000 | $454 | 71 |
| 49 Tower St | 0.20mi | 4/1.5 | 1,200 (-8%) | 7mo | $575,000 | $479 | 70 |
| 57 E Pulaski | 0.38mi | 3/2.0 (-1) | 1,400 (+8%) | 4mo | $475,000 | $339 | 58 |
| 7 Cheshire St | 0.42mi | 4/2.0 | 1,115 (-14%) | 1mo | $412,000 | $370 | 52 |
| 30 3rd Ave | 0.47mi | 3/2.0 (-1) | 1,200 (-8%) | 6mo | $575,000 | $479 | 51 |
| 46 3rd Ave | 0.60mi | 3/1.5 (-1) | 1,247 (-4%) | 12mo | $588,000 | $472 | 48 |
| 4 W 11th St | 0.62mi | 4/3.0 | 1,250 (-4%) | 15mo | $599,000 | $479 | 44 |
| 15 Stern Ct | 0.60mi | 3/2.0 (-1) | 1,200 (-8%) | 10mo | $545,000 | $454 | 41 |
| 12 Monaton Dr | 0.71mi | 3/1.0 (-1) | 1,200 (-8%) | 12mo | $630,000 | $525 | 39 |
| 19 David Ct | 0.59mi | 3/1.0 (-1) | 1,200 (-8%) | 22mo | $575,000 | $479 | 36 |
| 81 Bayberry Dr | 0.60mi | 3/2.5 (-1) | 1,402 (+8%) | 16mo | $851,000 | $607 | 34 |
| 276 Nassau Rd | 0.63mi | 3/2.0 (-1) | 1,435 (+10%) | 14mo | $870,000 | $606 | 33 |
Match score weights: distance 35% · size 25% · config 20% · recency 20%. Top-matched comps best support the ARV.
Projected returns pro-forma
-3.0% appreciation · 4.54% rent growth · sell at horizon
- IRR
- -7.0%
- Equity multiple
- 0.74×
- Total profit
- $-31,575
- Equity at exit
- $64,204
- IRR
- 4.5%
- Equity multiple
- 1.35×
- Total profit
- $42,222
- Equity at exit
- $37,230
Cash invested: $120,568 (down + closing). Projections, not guarantees.
Landlord ↔ Tenant lean methodology
- Overall (STATE)
- 15 Strongly Tenant-Friendly
- State New York
- 15 Strongly Tenant-Friendly · D+10
- County
- — inherits STATE
- City
- — inherits STATE
ZIP-level market 11746
- Rents YoY
- 4.5%
- Active inventory
- 308
- Price-to-rent
- 8.2×
Monthly cashflow live
- Estimated rent
- $4,388 high interval (Pro) →
- Mortgage (P&I)
- −$2,258
- Tax from tax record
- −$539 /mo · $6,463/yr
- Insurance
- −$179
- HOA
- −$0
- Vacancy / Maint / Mgmt
- −$921
- Net cashflow
- $490
Break-even live
UW: 25.0% down · 7.5% · 30yr · 1.5% tax · 5.0% vac · 8.0% maint · 8.0% mgmt
Financing live
Cash to close
- Down payment
- $107,650
- Closing costs
- $12,918
- Reserves months
- —
- Total cash needed
- —
Loan-product check · same deal, 3 products live
Conventional
25% down · 7.5% · 30yr
- Down + closing
- —
- Monthly P&I
- —
- Monthly cashflow
- —
- DSCR
- —
- Eligible?
- —
Personal DTI + credit; lowest rate.
DSCR
20% down · 8.5% · 30yr
- Down + closing
- —
- Monthly P&I
- —
- Monthly cashflow
- —
- DSCR
- —
- Eligible?
- —
No personal income docs; deal must DSCR.
Hard money
10% down · 12.0% · 12mo
- Down + closing
- —
- Monthly P&I
- —
- Monthly cashflow
- —
- DSCR
- —
- Eligible?
- —
Short-term bridge; refi at stabilization.
Rent comps 5 comps
| Address | Beds | Baths | Sqft | Rent | $/sqft | DOM | Units | Dist |
|---|---|---|---|---|---|---|---|---|
| 156 E Pulaski Rd Huntington Station, NY | 2.0–3.0 | 1.0 | 936 | $2,955 | $3.16 | 1d | 11 | 0.65mi |
| 1700 E 5th St Huntington Station, NY | 1.0–3.0 | 1.0–2.0 | 1277 | $5,037 | $3.94 | 1d | 1 | 0.79mi |
| 10 Vilno Ct Unit 2 Huntington Station, NY | 3.0 | 1.0 | 1000 | $3,500 | $3.50 | 1d | 1 | 0.86mi |
| 1 E Carver St Huntington, NY | 3.0 | 1.0 | 1060 | $3,875 | $3.66 | 15d | 1 | 1.28mi |
| 245 Main St Unit 1 Huntington, NY | 3.0 | 2.0 | 1600 | $5,995 | $3.75 | 1d | 1 | 1.41mi |
Listing history 18 events
-
2026-06-18days on market $430,600 Active 52 DOM
-
2026-06-17price $430,600 Active 51 DOM
-
2026-06-17days on market $468,000 Active 51 DOM
-
2026-06-16days on market $468,000 Active 50 DOM
-
2026-06-15days on market $468,000 Active 49 DOM
-
2026-06-13days on market $468,000 Active 47 DOM
-
2026-06-13days on market $468,000 Active 46 DOM
-
2026-06-09days on market $468,000 Active 43 DOM
-
2026-06-08days on market $468,000 Active 42 DOM
-
2026-06-07days on market $468,000 Active 41 DOM
-
2026-06-04days on market $468,000 Active 38 DOM
-
2026-06-03days on market $468,000 Active 37 DOM
-
2026-06-02days on market $468,000 Active 36 DOM
-
2026-06-01days on market $468,000 Active 35 DOM
-
2026-05-31days on market $468,000 Active 34 DOM
-
2026-04-27$468,000 Active 11-char remark
-
1990-12-19soldstatus $100,000
-
1985-01-03soldstatus $45,000
ⓘ Source: listings_history table (triggers on properties + properties_extension) + one-shot
backfill from property_details.listing_events for pre-trigger history.
Tax reassessment forecast NY · Partial reset (capped growth)
- Current annual tax
- $6,463 · $539/mo
- Projected year-2 tax
- $6,870 · $573/mo
- Expected delta
- +$407/yr (+$34/mo · 6.3%)
ⓘ Screening estimate from a state-policy table — verify with the county assessor before closing.
Climate risk First Street
- Flood 1/10 Low FEMA zone X (unshaded) · 0% chance over 30 yrs
- Wildfire 1/10 Low
- Heat 5/10 Major 7 d/yr ≥97°F today · 15 d/yr by 30 yrs out
- Wind 8/10 Severe 80% chance of damaging wind over 30 yrs
- Air quality 4/10 Moderate 4 unhealthy d/yr today · 6 by 30 yrs out
Nearby sold comps map
Loading sold comps map…
Walkable amenities ~0.75 mi
Loading nearby amenities…
Taxation est. · year 1
- Rental income
- $52,656
- − Mortgage interest
- −$24,120
- − Property taxes
- −$6,463
- − Insurance
- −$2,153
- − Repairs & maintenance
- −$4,212
- − Management
- −$4,212
- − Depreciation
- −$12,527
- Taxable loss
- −$1,032
- Est. tax savings @ 24.0%
- +$248
- After-tax cash flow
- $6,132/yr
For passive investors: Depreciation is non-cash, so a rental often shows a tax loss while cash-flowing — sheltering income. Rental losses are passive: they offset passive income freely, and up to $25,000/yr can offset ordinary (W-2) income if you actively participate and your MAGI is under $100k (phasing out to $0 by $150k); unused losses carry forward. On sale, claimed depreciation is recaptured at up to 25%, and gains may owe capital-gains tax (a 1031 exchange can defer both). Figures are a year-1 estimate at your 24.0% rate — not tax advice; consult a CPA.
Schools (NCES district)
- District
- Huntington Union Free School District
- NCES district ID
- 3615090
- Math proficiency
- 45% ▼ -8.00%
- Reading proficiency
- 52% ▼ -1.00%
- Median HH income
- $93,547
- Composite
- 45.68/100
- National rank
- #2578
- State rank
- #328 of 590 in NY
Livability — Huntington Station
- Score
- 79/100
- State rank
- #126
- US rank
- #2028
Category grades
Schools grade is shown separately in the Schools card above.
Census & demographics
- Census place
- Huntington Station, NY
- County
- Suffolk County · 679,920 people
- Metro
- New York-Newark-Jersey City, NY-NJ-PA
- Population (ZIP)
- 65,747
- Household income
- $164,589
- Rent vs Own
- Severe rent burden
- 627.0
Population outlook (Suffolk County) Hauer SSP2
- Today (2025)
- 1,505,262 people
- By 2030
- 1,498,318 · -0.5%
- By 2040
- 1,471,101 · -2.3%
- By 2050
- 1,424,848 · -5.3%
- By 2075
- 1,337,157 · -11.2%
- By 2100
- 1,217,720 · -19.1%
Race, ethnicity, and origin ACS 2023
- Neighborhood character
- Diverse neighborhood (Simpson 0.58)
- Race & ethnicity
- White 61% Hispanic / Latino 19% Two or more races 10% Asian 8% Black 7% Native American 1%
- Hispanic origin (detail)
- Mexican 2% Puerto Rican 2%
- Common ancestry
- Romanian 5% Scotch-Irish 3% Italian 1%
- Foreign-born
- 20% · Canada, China, Jamaica
- Languages at home
- 70% English-only · Spanish 15% Other Indo-European 6% Chinese 2%
Political lean MEDSL · Suffolk
- 2024 margin
- Lean R (+10.0) · D 45.0% · R 55.0%
- 2008→2024 swing
- -16.0pp toward R · 2008: 6.0pp · 2024: -10.0pp
- All cycles
- 2024: R+10.0 2020: R+0.0 2016: R+8.2 2012: D+2.9 2008: D+6.0
Not yet ingested
- Civics
- —
Market trends
- HPI YoY
- ▼ -715.60%
- Current HPI
- 317.5657
- Rent YoY
- ▲ 4.54%
- Metro
- New York-Newark-Jersey City, NY-NJ-PA
- State GDP YoY
- ▲ 2.60%
- F500 in state
- 92
Industry mix (Fortune 500 HQ in NY)
| Industry | F500 HQs | Revenue |
|---|---|---|
| Financial Services | 10 | $950B |
|
||
| Consumer Goods | 9 | $162B |
|
||
| Insurance | 4 | $225B |
|
||
| Telecommunications | 2 | $144B |
|
||
| Pharmaceuticals | 2 | $112B |
|
||
| Media / Entertainment | 2 | $69B |
|
||
Price history
+856.9% since first listed4 events — show timeline
- 2026-06-17 Price Changed $430,600 OneKey® MLS as Distributed by MLS Grid
- 2026-04-27 Listed $468,000 OneKey® MLS as Distributed by MLS Grid
- 1990-12-19 Sold (Public Records) $100,000 Public Records
- 1985-01-03 Sold (Public Records) $45,000 Public Records
Property tax history
+2.0%/yrLatest (2025): $6,463 · +0.0% YoY. Source: county tax records.
Cash-flow waterfall
monthlySold comps — $/sqft
last 12 mo · ≤1 miLoading sold comps…