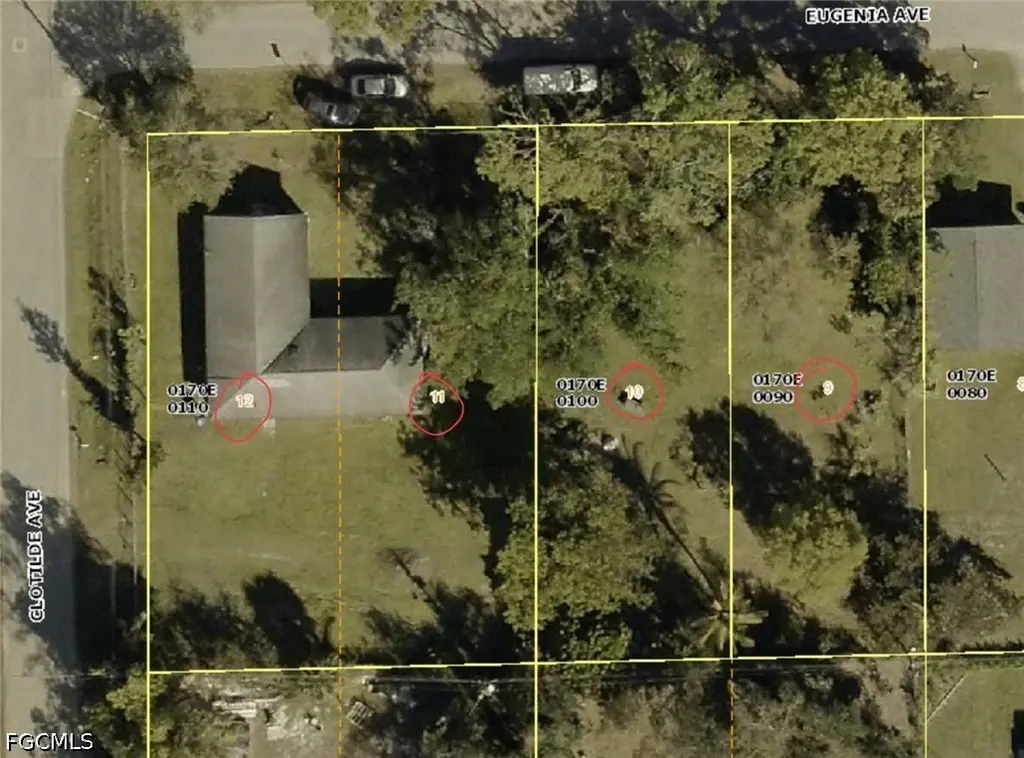
155 Clotilde Ave · Fort Myers, FL
Flood risk 1/10 · Minimal
- FEMA flood zone
- X (unshaded)
- Chance of flooding over 30 yrs
- 0.0%
- Est. flood insurance / yr
- $507 – $1,088
Fire risk 3/10 · Minor
- Est. fire insurance / yr
- $947 – $1,759
Heat risk 10/10 · Severe
- Hot days now (above 107°F)
- 7 days/yr
- Hot days in 30 yrs
- 29 days/yr
Wind risk 10/10 · Severe
- Chance of severe wind over 30 yrs
- 99.0%
Air-quality risk 2/10 · Minimal
- Unhealthy air days now
- 1 days/yr
- Unhealthy air days in 30 yrs
- 1 days/yr
Risk factors via First Street. Map © Google.
Why this score? — see what drove the B- grade
The composite is a weighted blend of 9 inputs, each scored 0–100. Each bar is that input's sub-score; the figure is the points it added to the 100-point composite (weight × sub-score).
- Cash flow +26.8/30.0
- ARV discount +15.0/15.0
- DSCR +9.2/10.0
- 1% rule +6.1/10.0
- Livability +4.3/5.0
- Schools +4.1/10.0
- Condition / age +2.5/5.0
- Rent growth +1.8/5.0
- Appreciation +0.0/10.0
$129,900
🖨 Deal sheet 📄 Offer letter ✓ Due diligence
Listing remarks
Rare opportunity to purchase three parcels together, each with their own parcel ID’s giving a builder ability to split, featuring a variety of fruit trees already in bloom. The largest parcel includes an existing residential structure, however, the list price reflects land value only and structure is considered to have no contributory value and may be a tear-down. Water and electric are currently available on the parcel with the structure. No access to the interior of the home will be permitted except during an accepted contract’s inspection period, at the buyer’s sole risk and for due diligence purposes only. All three properties are priced at land value. New construction
Key facts
- Three adjacent lots
- 0.64 acre lot
- Built 1925
Tags
Property features AI
Finance
- Financial info: Pets allowed
- HOA & community: No association fee
Exterior
- Utilities: Public water; Public sewer; Cable not available
- Home design: Single-story property; Faces west; Tear down / value in land
- Construction: Aluminum siding and wood frame construction; Shingle roof
- Exterior features: Fenced yard; Multiple lots; East exposure
Interior
- Bedrooms: Other room types listed
- Bathrooms: 1 full bathroom
- Interior features: Unfurnished; Other features noted (see remarks)
Neighborhood map
What this means for you Summary
Snapshot
- This is a 2-bed/1.0-bath single-family listed at $130k.
Deal economics
- At list price, monthly cash flow is $356 ($4k/yr) — positive.
- The deal already cash-flows at list — no discount required.
- Meets the 1% rule at list price ($1k rent vs $130k).
- Cap rate 9.6% vs local median 3.0% in Fort Myers — top-decile yield for the area; either an underpriced asset or a hidden risk that comps aren't pricing in. Stress-test before assuming the spread holds.
Location & tenants
- Location reads 86/100 on livability (#14 in FL, #383 nationally) — a professional / high-income tenant draw. Strengths: amenities A+, commute A+, housing A+.
- Lee (suburban): math 47% / reading 50% proficiency, ranked #42 of 73 in FL (top 58%) — families likely to look elsewhere, expect single-tenant / working-renter base with shorter leases.
- Market conditions: Rents soft (-3.0%/yr); 763 active listings in the ZIP; 39 comparable units currently listed for rent nearby; rentals at typical pace (median 21d on market — plan ~3-4 weeks tenant-placement turnaround); 15,411 units permitted in Lee County in 2024 (4,686 in 5+ unit buildings).
Forward outlook
- Local home prices are declining (-3.0%/yr); year-one equity from $898 of loan paydown is wiped out by about $4k of value loss. Plan a longer hold.
- Lee County population projected at +44% by 2050 — long-run rental-demand tailwind backs the buy-and-hold thesis.
Negotiation context
- Only 6 days on market — expect competitive offers; lowballing is unlikely to land.
- Current owner paid $16k; list at $130k implies a 738% gain — meaningful room to come down on a strong offer.
Risks & watch-outs
- Watch-outs: built in 1925 — expect roof / HVAC / electrical / plumbing capex.
- Climate carrying-cost: severe wind risk, 99% chance of damaging wind over 30y; extreme-heat days projected 7→29/yr by 2055 (HVAC capex compounding) — expect insurance premiums to compound above CPI over the hold.
Questions for the listing agent
- Built in 1925 — when were the roof, HVAC, electrical panel, plumbing, and water heater last replaced?
- Is there a deadline driving the sale (1031 exchange, divorce, estate, relocation)? That informs how much negotiation room exists.
- What's the average days-on-market for RENTAL listings here right now (not sales)? A rising rental-DOM trend means longer vacancies and softer asking-rent achievability than the comps imply.
- What's the recent tenant-quality profile in this submarket — average credit score on applications, eviction rate, late-payment / NSF rate, and stable-employment percentage? A property-management company in the area should have these aggregated.
- How much new for-sale + rental construction is in the pipeline within 1–3 miles? Heavy new supply typically softens prices + rents 12–24 months out; constrained supply supports both.
Investment metrics
- 1% rule
- 1.11% ✓
- Cap rate
- 9.58%
- Cash-on-cash
- 11.76%
- DSCR
- 1.52
- GRM
- 7.5
CMA / ARV
- ARV (on-the-fly)
- $200,564
- Comps found
- 3
Show comp detail 3 sales within ~0.75 mi
| Address | Dist | Beds/Ba | Sqft | Sold | Price | $/sf | Match |
|---|---|---|---|---|---|---|---|
| 155 Clotilde Ave | 0.00mi | 2/1.0 | 1,102 (0%) | 0mo | $120,000 | $109 | 100 |
| 36 Castlebar Cir | 0.58mi | 3/2.0 (+1) | 1,092 (-1%) | 13mo | $270,000 | $247 | 52 |
| 41 Roanoke Dr | 0.52mi | 3/2.0 (+1) | 1,038 (-6%) | 16mo | $189,000 | $182 | 44 |
Match score weights: distance 35% · size 25% · config 20% · recency 20%. Top-matched comps best support the ARV.
Projected returns pro-forma
-3.0% appreciation · 0.0% rent growth · sell at horizon
- IRR
- -2.0%
- Equity multiple
- 0.93×
- Total profit
- $-2,635
- Equity at exit
- $19,369
- IRR
- 4.5%
- Equity multiple
- 1.29×
- Total profit
- $10,379
- Equity at exit
- $11,231
Cash invested: $36,372 (down + closing). Projections, not guarantees.
Landlord ↔ Tenant lean methodology
- Overall (STATE)
- 87 Strongly Landlord-Friendly
- State Florida
- 87 Strongly Landlord-Friendly · R+3
- County
- — inherits STATE
- City
- — inherits STATE
ZIP-level market 33905
- Home prices YoY
- -31.4%
- Rents YoY
- -3.0%
- Active inventory
- 763
- Price-to-rent
- 7.5×
Monthly cashflow live
- Estimated rent
- $1,444 high interval (Pro) →
- Mortgage (P&I)
- −$681
- Tax from tax record
- −$49 /mo · $589/yr
- Insurance
- −$54
- HOA
- −$0
- Vacancy / Maint / Mgmt
- −$303
- Net cashflow
- $356
Break-even live
UW: 25.0% down · 7.5% · 30yr · 1.5% tax · 5.0% vac · 8.0% maint · 8.0% mgmt
Financing live
Cash to close
- Down payment
- $32,475
- Closing costs
- $3,897
- Reserves months
- —
- Total cash needed
- —
Loan-product check · same deal, 3 products live
Conventional
25% down · 7.5% · 30yr
- Down + closing
- —
- Monthly P&I
- —
- Monthly cashflow
- —
- DSCR
- —
- Eligible?
- —
Personal DTI + credit; lowest rate.
DSCR
20% down · 8.5% · 30yr
- Down + closing
- —
- Monthly P&I
- —
- Monthly cashflow
- —
- DSCR
- —
- Eligible?
- —
No personal income docs; deal must DSCR.
Hard money
10% down · 12.0% · 12mo
- Down + closing
- —
- Monthly P&I
- —
- Monthly cashflow
- —
- DSCR
- —
- Eligible?
- —
Short-term bridge; refi at stabilization.
Rent comps 39 comps
| Address | Beds | Baths | Sqft | Rent | $/sqft | DOM | Units | Dist |
|---|---|---|---|---|---|---|---|---|
| 322 Louise Ave Fort Myers, FL | 2.0 | 1.0 | 765 | $1,100 | $1.44 | 2d | 1 | 0.18mi |
| 322 Louise Ave Fort Myers, FL | 2.0 | 1.0 | 765 | $1,100 | $1.44 | 19d | 1 | 0.18mi |
| 8 Roanoke Dr Fort Myers, FL | 3.0 | 2.0 | 1056 | $1,495 | $1.42 | 21d | 1 | 0.50mi |
| 227 Maria St Fort Myers, FL | 2.0 | 1.0 | 720 | $1,095 | $1.52 | 23d | 1 | 0.52mi |
| 221 Maria St Unit 225 Fort Myers, FL | 2.0 | 1.0 | 720 | $1,095 | $1.52 | 23d | 1 | 0.53mi |
| 1427 Markland Ave Fort Myers, FL | 1.0 | 1.0 | 800 | $1,025 | $1.28 | 23d | 1 | 0.56mi |
| 216 Maria St Fort Myers, FL | 3.0 | 1.0 | 864 | $1,600 | $1.85 | 23d | 1 | 0.56mi |
| 3875 E Michigan Ave Fort Myers, FL | 1.0–2.0 | 1.0 | 710 | $1,621 | $2.28 | 14d | 1 | 0.71mi |
| 3870 Calle De Jardin Fort Myers, FL | 1.0–3.0 | 1.0–2.0 | 952 | $1,229 | $1.29 | 23d | 1 | 0.75mi |
| 3920 Lora St Fort Myers, FL | 2.0 | 1.0 | 800 | $1,150 | $1.44 | 11d | 1 | 0.75mi |
| 1150 Polk St Fort Myers, FL | 2.0 | 1.0 | 819 | $2,000 | $2.44 | 23d | 1 | 0.79mi |
| 1759 Aquarius Ct Fort Myers, FL | 2.0 | 1.0 | 800 | $1,400 | $1.75 | 14d | 1 | 0.80mi |
| 1759 Aquarius Ct Fort Myers, FL | 2.0 | 1.0 | 800 | $1,400 | $1.75 | 3d | 1 | 0.80mi |
| 4280 Desoto Ave Fort Myers, FL | 2.0 | 2.0 | 948 | $1,700 | $1.79 | 23d | 1 | 0.82mi |
| 4280 Desoto Ave #305 Fort Myers, FL | 2.0 | 2.0 | 912 | $1,550 | $1.70 | 16d | 1 | 0.82mi |
| 3771 Belmont St Apt A Fort Myers, FL | 2.0 | 1.0 | 800 | $1,195 | $1.49 | 23d | 1 | 0.86mi |
| 4104 Desoto Ave Fort Myers, FL | 2.0 | 1.0 | 700 | $1,195 | $1.71 | 23d | 1 | 0.87mi |
| 3758 Lora St Unit 4 Fort Myers, FL | 2.0 | 1.0 | 800 | $1,025 | $1.28 | 21d | 1 | 0.89mi |
| 3838 Madison Ave Apt 3 Fort Myers, FL | 1.0 | 1.0 | 800 | $900 | $1.12 | 23d | 1 | 0.89mi |
| 3666 Pearl St Fort Myers, FL | 2.0 | 1.0 | 1100 | $1,400 | $1.27 | 23d | 1 | 0.92mi |
| 838 Van Buren St Fort Myers, FL | 2.0 | 2.0 | 800 | $1,275 | $1.59 | 11d | 1 | 0.94mi |
| 3616 Pearl St Unit 1 Fort Myers, FL | 3.0 | 2.0 | 1200 | $1,175 | $0.98 | 3d | 1 | 0.99mi |
| 3616 Pearl St Unit 4 Fort Myers, FL | 2.0 | 1.5 | 980 | $925 | $0.94 | 21d | 1 | 0.99mi |
| 3814 Desoto Ave Fort Myers, FL | 1.0 | 1.0 | 700 | $959 | $1.37 | 3d | 1 | 1.02mi |
| 3323 Michigan Ave Fort Myers, FL | 3.0 | 2.0 | 1029 | $1,600 | $1.55 | 21d | 1 | 1.18mi |
| 3744 Estelle Ave Fort Myers, FL | 2.0 | 1.0 | 725 | $999 | $1.38 | 23d | 1 | 1.20mi |
| 704 Karlov St Unit 704 Fort Myers, FL | 2.0 | 1.0 | 725 | $1,095 | $1.51 | 3d | 1 | 1.27mi |
| 3619 Seminole Ave Unit 3 Fort Myers, FL | 1.0 | 1.0 | 800 | $900 | $1.12 | 23d | 1 | 1.29mi |
| 2103 French St Unit 2 Fort Myers, FL | 3.0 | 2.0 | 1100 | $1,800 | $1.64 | 23d | 1 | 1.31mi |
| 2103 French St Fort Myers, FL | 3.0 | 2.0 | 1100 | $1,800 | $1.64 | 2d | 1 | 1.31mi |
| 2103 French St Fort Myers, FL | 3.0 | 2.0 | 1100 | $1,800 | $1.64 | 1d | 1 | 1.31mi |
| 2103 French St Fort Myers, FL | 3.0 | 2.0 | 1100 | $1,900 | $1.73 | 23d | 1 | 1.31mi |
| 3555 Seminole Ave Fort Myers, FL | 2.0 | 1.0 | 775 | $1,000 | $1.29 | 23d | 1 | 1.31mi |
| 580 Thomas Ave Fort Myers, FL | 2.0 | 1.0 | 900 | $1,200 | $1.33 | 23d | 1 | 1.37mi |
| 3216 Dale St Fort Myers, FL | 2.0 | 1.0 | 886 | $1,650 | $1.86 | 3d | 1 | 1.45mi |
| 3933 E River Dr Fort Myers, FL | 3.0 | 2.0 | 1468 | $3,500 | $2.38 | 23d | 1 | 1.48mi |
| 3339 Edgewood Ave Fort Myers, FL | 2.0 | 1.0 | 860 | $1,300 | $1.51 | 3d | 1 | 1.48mi |
| 3339 Edgewood Ave Fort Myers, FL | 2.0 | 1.0 | 860 | $1,300 | $1.51 | 16d | 1 | 1.48mi |
| 9145 Flying Eagle DR Tice, FL | 1.0–3.0 | 1.0–2.5 | 1072 | $2,174 | $2.03 | 3d | 14 | 1.50mi |
Listing history 3 events
-
2026-04-30status Pending
-
2026-04-25$129,900 Active
-
1987-04-01soldstatus $15,500
ⓘ Source: listings_history table (triggers on properties + properties_extension) + one-shot
backfill from property_details.listing_events for pre-trigger history.
Tax reassessment forecast FL · Resets to sale price
- Current annual tax
- $589 · $49/mo
- Projected year-2 tax
- $1,078 · $90/mo
- Expected delta
- +$489/yr (+$41/mo · 83.0%)
ⓘ Screening estimate from a state-policy table — verify with the county assessor before closing.
Climate risk First Street
- Flood 1/10 Low FEMA zone X (unshaded) · 0% chance over 30 yrs
- Wildfire 3/10 Moderate
- Heat 10/10 Extreme 7 d/yr ≥107°F today · 29 d/yr by 30 yrs out
- Wind 10/10 Extreme 99% chance of damaging wind over 30 yrs
- Air quality 2/10 Low 1 unhealthy d/yr today · 1 by 30 yrs out
Nearby sold comps map
Loading sold comps map…
Walkable amenities ~0.75 mi
Loading nearby amenities…
Taxation est. · year 1
- Rental income
- $17,328
- − Mortgage interest
- −$7,276
- − Property taxes
- −$589
- − Insurance
- −$650
- − Repairs & maintenance
- −$1,386
- − Management
- −$1,386
- − Depreciation
- −$3,779
- Taxable income
- $2,261
- Est. tax owed @ 24.0%
- −$543
- After-tax cash flow
- $3,733/yr
For passive investors: Depreciation is non-cash, so a rental often shows a tax loss while cash-flowing — sheltering income. Rental losses are passive: they offset passive income freely, and up to $25,000/yr can offset ordinary (W-2) income if you actively participate and your MAGI is under $100k (phasing out to $0 by $150k); unused losses carry forward. On sale, claimed depreciation is recaptured at up to 25%, and gains may owe capital-gains tax (a 1031 exchange can defer both). Figures are a year-1 estimate at your 24.0% rate — not tax advice; consult a CPA.
Schools (NCES district)
- District
- Lee
- NCES district ID
- 1201080
- Math proficiency
- 47% ▼ -11.00%
- Reading proficiency
- 50% ▼ -4.00%
- Median HH income
- $49,518
- Composite
- 41.49/100
- National rank
- #3458
- State rank
- #42 of 73 in FL
Livability — Fort Myers
- Score
- 86/100
- State rank
- #14
- US rank
- #383
Category grades
Schools grade is shown separately in the Schools card above.
Census & demographics
- Census place
- Fort Myers, FL
- County
- Lee County · 788,662 people
- City population
- 278,598
- Metro
- Cape Coral-Fort Myers, FL
- Population (ZIP)
- 41,381
- Household income
- $71,987
- Rent vs Own
- Severe rent burden
- 1358.0
Population outlook (Lee County) Hauer SSP2
- Today (2025)
- 871,946 people
- By 2030
- 955,468 · +9.6%
- By 2040
- 1,113,587 · +27.7%
- By 2050
- 1,256,891 · +44.1%
- By 2075
- 1,560,270 · +78.9%
- By 2100
- 1,726,848 · +98.0%
Race, ethnicity, and origin ACS 2023
- Neighborhood character
- Diverse neighborhood (Simpson 0.59)
- Race & ethnicity
- White 53% Hispanic / Latino 34% Two or more races 17% Black 9% Native American 4% Asian 2%
- Hispanic origin (detail)
- Mexican 11% Puerto Rican 5% Cuban 2%
- Common ancestry
- Romanian 2% Slovak 2% Lithuanian 2%
- Foreign-born
- 20% · Canada, Jamaica
- Languages at home
- 68% English-only · Spanish 29% Other Indo-European 1% German/W. Germanic 1%
Political lean MEDSL · Lee
- 2024 margin
- Strong R (+28.4) · D 35.5% · R 63.9%
- 2008→2024 swing
- -18.0pp toward R · 2008: -10.4pp · 2024: -28.4pp
- All cycles
- 2024: R+28.4 2020: R+19.2 2016: R+20.4 2012: R+16.6 2008: R+10.4
Not yet ingested
- Civics
- —
Market trends
- HPI YoY
- ▼ -122.89%
- Current HPI
- 268.4598
- Rent YoY
- ▼ -2.97%
- Metro
- Cape Coral-Fort Myers, FL
- State GDP YoY
- ▲ 3.28%
- F500 in state
- 36
Industry mix (Fortune 500 HQ in FL)
| Industry | F500 HQs | Revenue |
|---|---|---|
| Industrial Technology | 2 | $29B |
|
||
| Insurance | 2 | $17B |
|
||
| Retail | 1 | $60B |
|
||
| Technology Distribution | 1 | $58B |
|
||
| Homebuilding | 1 | $35B |
|
||
| Technology Manufacturing | 1 | $35B |
|
||
Price history
+738.1% since first listed3 events — show timeline
- 2026-04-30 Pending — FORTMLS
- 2026-04-25 Listed $129,900 FORTMLS
- 1987-04-01 Sold (Public Records) $15,500 Public Records
Property tax history
+6.8%/yrLatest (2025): $589 · -1.4% YoY. Source: county tax records.
Cash-flow waterfall
monthlySold comps — $/sqft
last 12 mo · ≤1 miLoading sold comps…