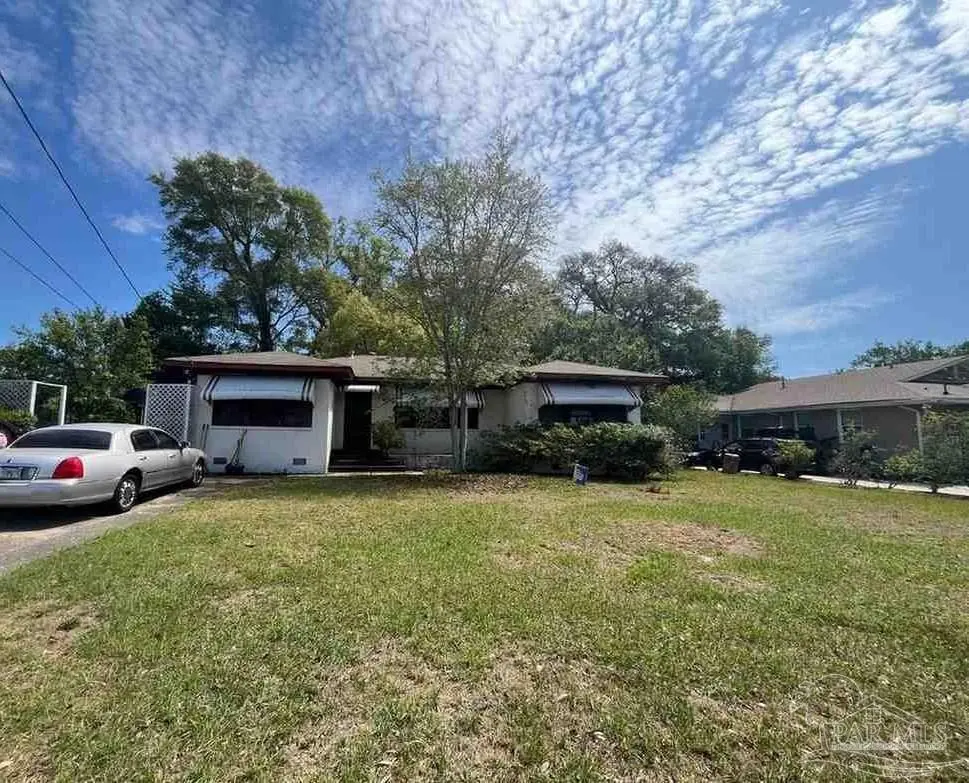
1918 N 17th Ave · Pensacola, FL
Flood risk 1/10 · Minimal
- FEMA flood zone
- X (unshaded)
- Chance of flooding over 30 yrs
- 0.0%
- Est. flood insurance / yr
- $507 – $1,088
Fire risk 1/10 · Minimal
- Est. fire insurance / yr
- $947 – $1,759
Heat risk 10/10 · Severe
- Hot days now (above 105°F)
- 7 days/yr
- Hot days in 30 yrs
- 22 days/yr
Wind risk 9/10 · Severe
- Chance of severe wind over 30 yrs
- 99.0%
Air-quality risk 2/10 · Minimal
- Unhealthy air days now
- 0 days/yr
- Unhealthy air days in 30 yrs
- 1 days/yr
Risk factors via First Street. Map © Google.
Why this score? — see what drove the C- grade
The composite is a weighted blend of 9 inputs, each scored 0–100. Each bar is that input's sub-score; the figure is the points it added to the 100-point composite (weight × sub-score).
- ARV discount +15.0/15.0
- Cash flow +14.4/30.0
- DSCR +4.4/10.0
- Livability +4.2/5.0
- 1% rule +4.0/10.0
- Schools +3.6/10.0
- Rent growth +3.3/5.0
- Condition / age +2.5/5.0
- Appreciation +0.0/10.0
$324,900
🖨 Deal sheet (PDF) 📄 Offer letter ✓ Due diligence
Listing remarks
Opportunity knocks in the heart of East Hill. This 3-bedroom, 2-bath home sits on a rare double lot on North 17th Avenue and offers approximately 1,800 square feet with tremendous potential. The property needs a full renovation, but the location and lot size create a strong value-add opportunity. Whether you are looking to renovate and make it your own or invest in one of Pensacola’s most desirable neighborhoods, this property offers the kind of upside that is hard to find. Showing request needs to be 24 hours in advance.
Key facts
- 0.26 acre lot
- Built 1950
- Listed 8 days
Neighborhood map
What this means for you Summary
Snapshot
- This is a 3-bed/2.0-bath single-family listed at $325k.
Deal economics
- At list price, monthly cash flow is $66 ($797/yr) — positive.
- The deal already cash-flows at list — no discount required.
- To meet the 1% rule (rent ≥ 1% of price), the offer needs to be $293k (9.9% below list).
- Recommended offer: $293k (9.9% below list) — sets the bar for 1% rule.
- Cap rate 6.5% vs local median 3.6% in Pensacola — top-decile yield for the area; either an underpriced asset or a hidden risk that comps aren't pricing in. Stress-test before assuming the spread holds.
Location & tenants
- Location reads 83/100 on livability (#53 in FL, #924 nationally) — a professional / high-income tenant draw. Strengths: commute A+, cost of living A+, housing A+.
- Escambia (suburban): math 40% / reading 45% proficiency, ranked #56 of 73 in FL (top 77%) — families likely to look elsewhere, expect single-tenant / working-renter base with shorter leases.
- Zoned schools: O. J. Semmes Elementary School (math 22% / reading 17%, grade F, #2,105 of 2,144 statewide, top 98%, 302 students, 91% FRL); J. H. Workman Middle School (math 20% / reading 27%, grade F, #536 of 571 statewide, top 95%, 705 students, 72% FRL); Pensacola High School (math 29% / reading 50%, grade F, #304 of 667 statewide, top 47%, 1,229 students, 55% FRL).
- Zoned-school proficiency averages 28% at this address vs 42% district-wide (-15 pts) — the specific schools serving this property underperform the Escambia average; the district grade overstates school quality for this exact location.
- Market conditions: Rents rising (+3.4%/yr); 240 active listings in the ZIP; 11 comparable units currently listed for rent nearby; rentals at typical pace (median 25d on market — plan ~3-4 weeks tenant-placement turnaround); 1,479 units permitted in Escambia County in 2024 (0 in 5+ unit buildings).
- At $2,926/mo this rent would consume 49% of the median local household income ($71k/yr) (locally 948% of renters already pay >50% of income on rent) — very limited rent-growth headroom before tenants either downsize or default.
Forward outlook
- Local home prices are declining (-3.0%/yr); year-one equity from $2k of loan paydown is wiped out by about $10k of value loss. Plan a longer hold.
- Escambia County population projected at +13% by 2050 — modest demand growth; plan on rents tracking national, not racing it.
Negotiation context
- Only 8 days on market — expect competitive offers; lowballing is unlikely to land.
- Current owner paid $28k; list at $325k implies a 1040% gain — meaningful room to come down on a strong offer.
Risks & watch-outs
- Watch-outs: built in 1950 — expect roof / HVAC / electrical / plumbing capex.
- Climate carrying-cost: severe wind risk, 99% chance of damaging wind over 30y; extreme-heat days projected 7→22/yr by 2055 (HVAC capex compounding) — expect insurance premiums to compound above CPI over the hold.
Questions for the listing agent
- Built in 1950 — when were the roof, HVAC, electrical panel, plumbing, and water heater last replaced?
- Is there a deadline driving the sale (1031 exchange, divorce, estate, relocation)? That informs how much negotiation room exists.
- What's the average days-on-market for RENTAL listings here right now (not sales)? A rising rental-DOM trend means longer vacancies and softer asking-rent achievability than the comps imply.
- What's the recent tenant-quality profile in this submarket — average credit score on applications, eviction rate, late-payment / NSF rate, and stable-employment percentage? A property-management company in the area should have these aggregated.
- How much new for-sale + rental construction is in the pipeline within 1–3 miles? Heavy new supply typically softens prices + rents 12–24 months out; constrained supply supports both.
Investment metrics
- 1% rule
- 0.90% ✗
- Cap rate
- 6.54%
- Cash-on-cash
- 0.88%
- DSCR
- 1.04
- GRM
- 9.3
CMA / ARV
- ARV (on-the-fly)
- $603,000
- Comps found
- 12
Show comp detail 12 sales within ~0.75 mi
| Address | Dist | Beds/Ba | Sqft | Sold | Price | $/sf | Match |
|---|---|---|---|---|---|---|---|
| 1918 N 17th Ave | 0.00mi | 3/2.0 | 1,800 (0%) | 1mo | $275,000 | $153 | 99 |
| 1723 Yates Ave | 0.53mi | 3/2.5 | 1,758 (-2%) | 1mo | $750,000 | $427 | 69 |
| 1613 E Yonge St | 0.29mi | 3/2.0 | 1,579 (-12%) | 3mo | $575,000 | $364 | 64 |
| 1121 E Maxwell St | 0.51mi | 3/2.5 | 1,716 (-5%) | 4mo | $492,000 | $287 | 63 |
| 1404 E Fisher St | 0.64mi | 3/2.0 | 1,757 (-2%) | 6mo | $545,000 | $310 | 61 |
| 1350 E Scott St | 0.49mi | 3/2.5 | 1,950 (+8%) | 1mo | $625,000 | $321 | 61 |
| 1412 E Bobe St | 0.34mi | 3/2.5 | 2,015 (+12%) | 4mo | $725,000 | $360 | 59 |
| 1408 E Bobe St | 0.35mi | 3/2.5 | 2,015 (+12%) | 4mo | $720,000 | $357 | 58 |
| 1120 E Bobe St | 0.56mi | 3/2.5 | 1,688 (-6%) | 6mo | $425,000 | $252 | 57 |
| 1220 E Gonzalez St | 0.68mi | 3/2.5 | 1,883 (+5%) | 3mo | $630,000 | $335 | 56 |
| 1714 E Hatton St | 0.45mi | 3/2.0 | 1,555 (-14%) | 2mo | $540,000 | $347 | 55 |
| 1402 E Leonard St | 0.69mi | 3/2.5 | 1,917 (+6%) | 1mo | $255,000 | $133 | 54 |
Match score weights: distance 35% · size 25% · config 20% · recency 20%. Top-matched comps best support the ARV.
Projected returns pro-forma
-3.0% appreciation · 3.39% rent growth · sell at horizon
- IRR
- -14.5%
- Equity multiple
- 0.48×
- Total profit
- $-47,223
- Equity at exit
- $48,444
- IRR
- -5.1%
- Equity multiple
- 0.66×
- Total profit
- $-30,730
- Equity at exit
- $28,091
Cash invested: $90,972 (down + closing). Projections, not guarantees.
Landlord ↔ Tenant lean methodology
- Overall (STATE)
- 87 Strongly Landlord-Friendly
- State Florida
- 87 Strongly Landlord-Friendly · R+3
- County
- — inherits STATE
- City
- — inherits STATE
ZIP-level market 32503
- Rents YoY
- 3.4%
- Active inventory
- 240
- Price-to-rent
- 9.3×
Monthly cashflow live
- Estimated rent
- $2,926 high interval (Pro) →
- Mortgage (P&I)
- −$1,704
- Tax est. 1.5%
- −$406 /mo · $4,874/yr
- Insurance
- −$135
- HOA
- −$0
- Vacancy / Maint / Mgmt
- −$614
- Net cashflow
- $66
Break-even live
Sensitivity live
| Price | -10% $291 | -5% $179 | +0% $66 | +5% $-46 | +10% $-158 |
|---|---|---|---|---|---|
| Rent | -10% $-165 | -5% $-49 | +0% $66 | +5% $182 | +10% $298 |
| Rate | -1.0pp $230 | -0.5pp $149 | base $66 | +0.5pp $-18 | +1.0pp $-103 |
UW: 25.0% down · 7.5% · 30yr · 1.5% tax · 5.0% vac · 8.0% maint · 8.0% mgmt
Financing live
Cash to close
- Down payment
- $81,225
- Closing costs
- $9,747
- Reserves months
- —
- Total cash needed
- —
Loan-product check · same deal, 3 products live
Conventional
25% down · 7.5% · 30yr
- Down + closing
- —
- Monthly P&I
- —
- Monthly cashflow
- —
- DSCR
- —
- Eligible?
- —
Personal DTI + credit; lowest rate.
DSCR
20% down · 8.5% · 30yr
- Down + closing
- —
- Monthly P&I
- —
- Monthly cashflow
- —
- DSCR
- —
- Eligible?
- —
No personal income docs; deal must DSCR.
Hard money
10% down · 12.0% · 12mo
- Down + closing
- —
- Monthly P&I
- —
- Monthly cashflow
- —
- DSCR
- —
- Eligible?
- —
Short-term bridge; refi at stabilization.
Rent comps 11 comps
| Address | Beds | Baths | Sqft | Rent | $/sqft | DOM | Units | Dist |
|---|---|---|---|---|---|---|---|---|
| 1414 E Mallory St Pensacola, FL | 3.0 | 2.0 | 1323 | $3,400 | $2.57 | 25d | 1 | 0.29mi |
| 1704 E Lee St Pensacola, FL | 3.0 | 2.0 | 1226 | $2,295 | $1.87 | 25d | 1 | 0.34mi |
| 1501 E Cross St Pensacola, FL | 4.0 | 2.0 | 1920 | $3,200 | $1.67 | 25d | 1 | 0.53mi |
| 1501 E Cross St Pensacola, FL | 4.0 | 2.0 | 1920 | $3,000 | $1.56 | 15d | 1 | 0.53mi |
| 1121 E Maxwell St Pensacola, FL | 3.0 | 2.5 | 1716 | $3,550 | $2.07 | 25d | 1 | 0.53mi |
| 1301 E Cross St Pensacola, FL | 3.0 | 2.0 | 2200 | $3,900 | $1.77 | 15d | 1 | 0.62mi |
| 3014 Magnolia Ave Pensacola, FL | 3.0 | 2.0 | 1650 | $2,750 | $1.67 | 25d | 1 | 0.78mi |
| 3019 Keats Dr Pensacola, FL | 4.0 | 2.5 | 2484 | $4,400 | $1.77 | 25d | 1 | 1.17mi |
| 3545 Hopestill Rd Pensacola, FL | 4.0 | 2.0 | 1984 | $2,400 | $1.21 | 25d | 1 | 1.32mi |
| 3547 Firestone Blvd Pensacola, FL | 4.0 | 2.0 | 2000 | $2,695 | $1.35 | 25d | 1 | 1.33mi |
| 3791 Maule Rd Pensacola, FL | 4.0 | 3.0 | 2000 | $3,250 | $1.62 | 25d | 1 | 1.47mi |
Listing history 4 events
-
2026-04-21status Pending
-
2026-04-13$324,900 Active
-
1990-10-01soldstatus $28,500
-
1966-01-01soldstatus $18,500
ⓘ Source: listings_history table (triggers on properties + properties_extension) + one-shot
backfill from property_details.listing_events for pre-trigger history.
Climate risk First Street
- Flood 1/10 Low FEMA zone X (unshaded) · 0% chance over 30 yrs
- Wildfire 1/10 Low
- Heat 10/10 Extreme 7 d/yr ≥105°F today · 22 d/yr by 30 yrs out
- Wind 9/10 Extreme 99% chance of damaging wind over 30 yrs
- Air quality 2/10 Low 0 unhealthy d/yr today · 1 by 30 yrs out
Nearby sold comps map
Loading sold comps map…
Walkable amenities ~0.75 mi
Loading nearby amenities…
Taxation est. · year 1
- Rental income
- $35,114
- − Mortgage interest
- −$18,199
- − Property taxes
- −$4,874
- − Insurance
- −$1,624
- − Repairs & maintenance
- −$2,809
- − Management
- −$2,809
- − Depreciation
- −$9,452
- Taxable loss
- −$4,653
- Est. tax savings @ 24.0%
- +$1,117
- After-tax cash flow
- $1,913/yr
For passive investors: Depreciation is non-cash, so a rental often shows a tax loss while cash-flowing — sheltering income. Rental losses are passive: they offset passive income freely, and up to $25,000/yr can offset ordinary (W-2) income if you actively participate and your MAGI is under $100k (phasing out to $0 by $150k); unused losses carry forward. On sale, claimed depreciation is recaptured at up to 25%, and gains may owe capital-gains tax (a 1031 exchange can defer both). Figures are a year-1 estimate at your 24.0% rate — not tax advice; consult a CPA.
Schools (NCES district)
- District
- Escambia
- NCES district ID
- 1200510
- Math proficiency
- 40% ▼ -9.00%
- Reading proficiency
- 45% ▼ -4.00%
- Median HH income
- $44,649
- Composite
- 36.04/100
- National rank
- #4773
- State rank
- #56 of 73 in FL
Livability — Pensacola
- Score
- 83/100
- State rank
- #53
- US rank
- #924
Category grades
Schools grade is shown separately in the Schools card above.
Census & demographics
- Census place
- Pensacola, FL
- County
- Escambia County · 301,722 people
- City population
- 237,636
- Metro
- Pensacola-Ferry Pass-Brent, FL
- Population (ZIP)
- 33,559
- Household income
- $71,411
- Rent vs Own
- Severe rent burden
- 948.0
Population outlook (Escambia County) Hauer SSP2
- Today (2025)
- 334,637 people
- By 2030
- 345,779 · +3.3%
- By 2040
- 364,828 · +9.0%
- By 2050
- 378,514 · +13.1%
- By 2075
- 403,220 · +20.5%
- By 2100
- 386,125 · +15.4%
Race, ethnicity, and origin ACS 2023
- Neighborhood character
- Predominantly White (68%)
- Race & ethnicity
- White 68% Black 20% Two or more races 6% Hispanic / Latino 5% Asian 2%
- Common ancestry
- Lithuanian 3% Italian 2% Romanian 2%
- Foreign-born
- 5% · Canada, China
- Languages at home
- 93% English-only · Spanish 3% Arabic 1% Tagalog/Filipino 1%
Political lean MEDSL · Escambia
- 2024 margin
- R (+19.5) · D 39.7% · R 59.2% · Other 1.1%
- 2008→2024 swing
- -0.2pp no change · 2008: -19.3pp · 2024: -19.5pp
- All cycles
- 2024: R+19.5 2020: R+15.1 2016: R+20.6 2012: R+20.6 2008: R+19.3
Not yet ingested
- Civics
- —
Market trends
- HPI YoY
- ▼ -300.02%
- Current HPI
- 294.4873
- Rent YoY
- ▲ 3.39%
- Metro
- Pensacola-Ferry Pass-Brent, FL
- State GDP YoY
- ▲ 3.28%
- F500 in state
- 36
Industry mix (Fortune 500 HQ in FL)
| Industry | F500 HQs | Revenue |
|---|---|---|
| Industrial Technology | 2 | $29B |
|
||
| Insurance | 2 | $17B |
|
||
| Retail | 1 | $60B |
|
||
| Technology Distribution | 1 | $58B |
|
||
| Homebuilding | 1 | $35B |
|
||
| Technology Manufacturing | 1 | $35B |
|
||
Price history
+1656.2% since first listed4 events — show timeline
- 2026-04-21 Pending — PARMLS
- 2026-04-13 Listed $324,900 PARMLS
- 1990-10-01 Sold (Public Records) $28,500 Public Records
- 1966-01-01 Sold (Public Records) $18,500 Public Records
Property tax history
+3.9%/yrLatest (2025): $582 · +9.6% YoY. Source: county tax records.
Cash-flow waterfall
monthlySold comps — $/sqft
last 12 mo · ≤1 miLoading sold comps…