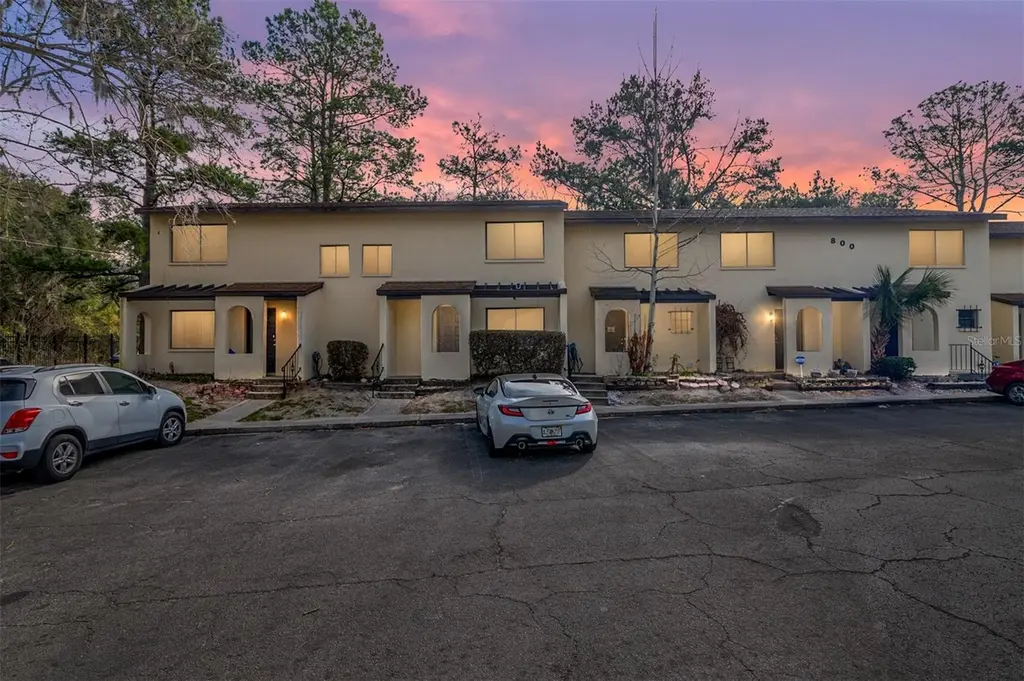
2735 SW 35th Pl #801 · Gainesville, FL
Flood risk No data
- FEMA flood zone
- —
- Chance of flooding over 30 yrs
- —
- Est. flood insurance / yr
- —
Fire risk No data
- Est. fire insurance / yr
- —
Heat risk No data
- Hot days now (above threshold)
- —
- Hot days in 30 yrs
- —
Wind risk No data
- Chance of severe wind over 30 yrs
- —
Air-quality risk No data
- Unhealthy air days now
- —
- Unhealthy air days in 30 yrs
- —
Risk factors via First Street. Map © Google.
Why this score? — see what drove the F grade
The composite is a weighted blend of 9 inputs, each scored 0–100. Each bar is that input's sub-score; the figure is the points it added to the 100-point composite (weight × sub-score).
- ARV discount +7.5/15.0
- Cash flow +6.9/30.0
- 1% rule +4.6/10.0
- Schools +4.3/10.0
- Livability +4.0/5.0
- Rent growth +3.2/5.0
- Condition / age +2.5/5.0
- DSCR +1.1/10.0
- Appreciation +0.0/10.0
$171,500
🖨 Deal sheet (PDF) 📄 Offer letter ✓ Due diligence
Listing remarks MLS
Casablanca West is less than 3 miles from UF, Shands Hospital, and Butler Plaza! This unit is a beautiful end-unit with two stories and a large screened in back porch. . No carpets anywhere other than the stairs! The main floor features a bright living and dining area with a functional layout, a kitchen with ample cabinet space, and an in-unit laundry area. Enjoy a community pool and ample resident and guest parking. On multiple direct bus lines to UF. Move-in ready and well suited for both owner-occupants and investors seeking a prime Gainesville location. Rented through 7-31-2026.
Key facts
- Community pool
- Ample cabinet space
- Functional layout
Tags
Neighborhood map
What this means for you Summary
Snapshot
- This is a 2-bed/3.0-bath condo listed at $172k.
Deal economics
- At list price, monthly cash flow is $-257 ($-3k/yr) — negative.
- To cash-flow at today's rent, offer at most $126k (26.5% below list).
- To meet the 1% rule (rent ≥ 1% of price), the offer needs to be $165k (3.8% below list).
- Recommended offer: $126k (26.5% below list) — sets the bar for cash-flow.
Location & tenants
- Location reads 81/100 on livability (#97 in FL, #1,480 nationally) — a professional / high-income tenant draw. Strengths: amenities A+, commute A+, cost of living A+; Watch: employment D+, crime F.
- Alachua (urban): math 49% / reading 54% proficiency, ranked #30 of 73 in FL (top 41%) — acceptable for families but not a draw, mixed tenant base, ~2y average lease.
- Zoned schools: Idylwild Elementary School (math 30% / reading 29%, grade F, #1,896 of 2,144 statewide, top 90%, 533 students, 78% FRL); Kanapaha Middle School (math 54% / reading 54%, grade B-, #196 of 571 statewide, top 36%, 1,094 students, 53% FRL); Eastside High School (math 29% / reading 56%, grade F, #264 of 667 statewide, top 41%, 1,220 students, 56% FRL).
- Market conditions: Rents rising (+2.9%/yr); 605 active listings in the ZIP; 1 comparable units currently listed for rent nearby; 1,774 units permitted in Alachua County in 2024 (984 in 5+ unit buildings).
- This rent runs 32% of the median local income ($62k/yr) — at the standard rent-burdened threshold; future hikes will face affordability resistance.
Forward outlook
- Local home prices are declining (-3.0%/yr); year-one equity from $1k of loan paydown is wiped out by about $5k of value loss. Plan a longer hold.
- Alachua County population projected at +26% by 2050 — long-run rental-demand tailwind backs the buy-and-hold thesis.
Negotiation context
- It's been on market 108 days — a 9% lower offer ($156k) is reasonable based on typical stale-listing flexibility.
- 4 sale attempts since 15y ago with the ask held roughly flat each time — persistent listings suggest the price (not the market) is what's stuck; bring a comps-based counter.
- Current owner paid $111k; list at $172k implies a 55% gain — meaningful room to come down on a strong offer.
Risks & watch-outs
- Watch-outs: HOA is 20% of rent.
Questions for the listing agent
- What do current leases actually rent for vs. the listed asking? Can we see a recent rent roll and the last 12 months of T-12 income?
- It's been on market 108 days. Have you received any prior offers? Is the seller open to a 26% concession, seller financing, or rate buy-down credit?
- What does the HOA fee cover, when was the last increase, and are there any pending special assessments or reserve-fund shortfalls?
- Any open or pending special assessments — roof, HVAC, plumbing, elevator, façade? What's the per-unit balance and payoff schedule, and is the seller paying it off at close or rolling it to the buyer?
- Why hasn't it sold? Are there any deal-killer items the seller is aware of (foundation, flood, title, zoning, code violations)?
- Is there a deadline driving the sale (1031 exchange, divorce, estate, relocation)? That informs how much negotiation room exists.
- Schools are B-rated — typically a magnet for longer-tenancy family renters. What's the average tenant stay here, and is there a school-zone premium baked into asking?
- Crime grade is F in this area — have there been break-ins, vandalism, or insurance claims at this property in the last 3 years? What carrier currently insures it and at what premium?
- The area grade is low — what's the realistic commute time and amenity access for the typical tenant pool here? Any planned neighborhood developments (good or bad) we should know about?
- What's the average days-on-market for RENTAL listings here right now (not sales)? A rising rental-DOM trend means longer vacancies and softer asking-rent achievability than the comps imply.
- What's the recent tenant-quality profile in this submarket — average credit score on applications, eviction rate, late-payment / NSF rate, and stable-employment percentage? A property-management company in the area should have these aggregated.
- How much new apartment / multifamily construction is in the pipeline within 1–3 miles? Heavy new supply (>2% of stock underway) typically softens rents 12–24 months out; light construction supports rent growth.
Investment metrics
- 1% rule
- 0.96% ✗
- Cap rate
- 4.49%
- Cash-on-cash
- -6.43%
- DSCR
- 0.71
- GRM
- 8.7
CMA / ARV
No comps found within radius.
Projected returns pro-forma
-3.0% appreciation · 2.89% rent growth · sell at horizon
- IRR
- -27.3%
- Equity multiple
- 0.08×
- Total profit
- $-44,102
- Equity at exit
- $25,571
- IRR
- -25.2%
- Equity multiple
- -0.23×
- Total profit
- $-59,209
- Equity at exit
- $14,828
Cash invested: $48,020 (down + closing). Projections, not guarantees.
Landlord ↔ Tenant lean methodology
- Overall (STATE)
- 87 Strongly Landlord-Friendly
- State Florida
- 87 Strongly Landlord-Friendly · R+3
- County
- — inherits STATE
- City
- — inherits STATE
ZIP-level market 32608
- Rents YoY
- 2.9%
- Active inventory
- 605
- Price-to-rent
- 8.7×
Monthly cashflow live
- Estimated rent
- $1,650 medium interval (Pro) →
- Mortgage (P&I)
- −$899
- Tax from tax record
- −$255 /mo · $3,056/yr
- Insurance
- −$71
- HOA
- −$335
- Vacancy / Maint / Mgmt
- −$346
- Net cashflow
- $-257
Break-even live
Sensitivity live
| Price | -10% $-160 | -5% $-209 | +0% $-257 | +5% $-306 | +10% $-354 |
|---|---|---|---|---|---|
| Rent | -10% $-388 | -5% $-322 | +0% $-257 | +5% $-192 | +10% $-127 |
| Rate | -1.0pp $-171 | -0.5pp $-214 | base $-257 | +0.5pp $-302 | +1.0pp $-347 |
UW: 25.0% down · 7.5% · 30yr · 1.5% tax · 5.0% vac · 8.0% maint · 8.0% mgmt
Financing live
Cash to close
- Down payment
- $42,875
- Closing costs
- $5,145
- Reserves months
- —
- Total cash needed
- —
Loan-product check · same deal, 3 products live
Conventional
25% down · 7.5% · 30yr
- Down + closing
- —
- Monthly P&I
- —
- Monthly cashflow
- —
- DSCR
- —
- Eligible?
- —
Personal DTI + credit; lowest rate.
DSCR
20% down · 8.5% · 30yr
- Down + closing
- —
- Monthly P&I
- —
- Monthly cashflow
- —
- DSCR
- —
- Eligible?
- —
No personal income docs; deal must DSCR.
Hard money
10% down · 12.0% · 12mo
- Down + closing
- —
- Monthly P&I
- —
- Monthly cashflow
- —
- DSCR
- —
- Eligible?
- —
Short-term bridge; refi at stabilization.
Rent comps 1 comps
| Address | Beds | Baths | Sqft | Rent | $/sqft | DOM | Units | Dist |
|---|---|---|---|---|---|---|---|---|
| 4455 SW 34th St Gainesville, FL | 1.0–3.0 | 1.0–3.0 | 1033 | $1,830 | $1.77 | 15d | 28 | 0.69mi |
HOA detail condo
- Monthly dues
- $335 · $4,020/yr
- Likely covers
- pool
- Assessments
- None detected in remarks — confirm with the listing agent.
Listing history 30 events
-
2026-06-21days on market $171,500 Active 108 DOM
-
2026-06-18days on market $171,500 Active 105 DOM
-
2026-06-17days on market $171,500 Active 104 DOM
-
2026-06-16days on market $171,500 Active 103 DOM
-
2026-06-15days on market $171,500 Active 102 DOM
-
2026-06-14days on market $171,500 Active 100 DOM
-
2026-06-13days on market $171,500 Active 99 DOM
-
2026-06-10days on market $171,500 Active 97 DOM
-
2026-06-09days on market $171,500 Active 96 DOM
-
2026-06-08days on market $171,500 Active 95 DOM
-
2026-06-07days on market $171,500 Active 94 DOM
-
2026-06-05days on market $171,500 Active 91 DOM
-
2026-06-03days on market $171,500 Active 90 DOM
-
2026-06-02days on market $171,500 Active 89 DOM
-
2026-06-01days on market $171,500 Active 88 DOM
-
2026-05-31days on market $171,500 Active 87 DOM
-
2026-05-30days on market $171,500 Active 86 DOM
-
2026-03-05$171,500 Active 592-char remark
Show marketing remark (592 chars)
Casablanca West is less than 3 miles from UF, Shands Hospital, and Butler Plaza! This unit is a beautiful end-unit with two stories and a large screened in back porch. . No carpets anywhere other than the stairs! The main floor features a bright living and dining area with a functional layout, a kitchen with ample cabinet space, and an in-unit laundry area. Enjoy a community pool and ample resident and guest parking. On multiple direct bus lines to UF. Move-in ready and well suited for both owner-occupants and investors seeking a prime Gainesville location. Rented through 7-31-2026.
-
2023-11-06historical
-
2023-10-31price $193,900
-
2023-09-16$194,500 Active
-
2019-08-05soldstatus $111,000
-
2019-08-02soldstatus $111,000
-
2019-06-17$116,580
-
2012-01-06soldstatus $56,500
-
2011-11-17$61,500
-
2005-06-20soldstatus $129,000
-
2004-12-14soldstatus $105,000
-
1999-06-01soldstatus $61,000
-
1986-08-01soldstatus $51,900
ⓘ Source: listings_history table (triggers on properties + properties_extension) + one-shot
backfill from property_details.listing_events for pre-trigger history.
Tax reassessment forecast FL · Resets to sale price
- Current annual tax
- $3,056 · $255/mo
- Projected year-2 tax
- $3,056 · $255/mo
- Expected delta
- $0/yr ($0/mo · 0.0%)
ⓘ Screening estimate from a state-policy table — verify with the county assessor before closing.
Nearby sold comps map
Loading sold comps map…
Walkable amenities ~0.75 mi
Loading nearby amenities…
Taxation est. · year 1
- Rental income
- $19,797
- − Mortgage interest
- −$9,607
- − Property taxes
- −$3,056
- − Insurance
- −$858
- − Repairs & maintenance
- −$1,584
- − Management
- −$1,584
- − HOA
- −$4,020
- − Depreciation
- −$4,989
- Taxable loss
- −$5,901
- Est. tax savings @ 24.0%
- +$1,416
- After-tax cash flow
- $-1,671/yr
For passive investors: Depreciation is non-cash, so a rental often shows a tax loss while cash-flowing — sheltering income. Rental losses are passive: they offset passive income freely, and up to $25,000/yr can offset ordinary (W-2) income if you actively participate and your MAGI is under $100k (phasing out to $0 by $150k); unused losses carry forward. On sale, claimed depreciation is recaptured at up to 25%, and gains may owe capital-gains tax (a 1031 exchange can defer both). Figures are a year-1 estimate at your 24.0% rate — not tax advice; consult a CPA.
Schools (NCES district)
- District
- Alachua
- NCES district ID
- 1200030
- Math proficiency
- 49% ▼ -9.00%
- Reading proficiency
- 54% ▼ -3.00%
- Median HH income
- $42,683
- Composite
- 43.31/100
- National rank
- #3038
- State rank
- #30 of 73 in FL
Livability — Gainesville
- Score
- 81/100
- State rank
- #97
- US rank
- #1480
Category grades
Schools grade is shown separately in the Schools card above.
Census & demographics
- Census place
- Gainesville, FL
- County
- Alachua County · 218,005 people
- City population
- 188,348
- Metro
- Gainesville, FL
- Population (ZIP)
- 54,566
- Household income
- $61,588
- Rent vs Own
- Severe rent burden
- 4709.0
Population outlook (Alachua County) Hauer SSP2
- Today (2025)
- 289,834 people
- By 2030
- 305,873 · +5.5%
- By 2040
- 335,246 · +15.7%
- By 2050
- 364,719 · +25.8%
- By 2075
- 436,665 · +50.7%
- By 2100
- 482,920 · +66.6%
Race, ethnicity, and origin ACS 2023
- Neighborhood character
- Diverse neighborhood (Simpson 0.64)
- Race & ethnicity
- White 55% Hispanic / Latino 16% Black 13% Asian 12% Two or more races 11%
- Hispanic origin (detail)
- Mexican 2% Puerto Rican 4% Cuban 4%
- Common ancestry
- Slovak 2% Italian 2% Romanian 2%
- Foreign-born
- 19% · Canada, China, South Korea
- Languages at home
- 75% English-only · Spanish 10% Other Indo-European 5% Chinese 3%
Political lean MEDSL · Alachua
- 2024 margin
- Strong D (+21.0) · D 59.7% · R 38.8% · Other 1.5%
- 2008→2024 swing
- -0.6pp no change · 2008: 21.6pp · 2024: 21.0pp
- All cycles
- 2024: D+21.0 2020: D+27.2 2016: D+22.5 2012: D+17.3 2008: D+21.6
Not yet ingested
- Civics
- —
Market trends
- HPI YoY
- ▼ -150.91%
- Current HPI
- 253.0629
- Rent YoY
- ▲ 2.89%
- Metro
- Gainesville, FL
- State GDP YoY
- ▲ 3.28%
- F500 in state
- 36
Industry mix (Fortune 500 HQ in FL)
| Industry | F500 HQs | Revenue |
|---|---|---|
| Industrial Technology | 2 | $29B |
|
||
| Insurance | 2 | $17B |
|
||
| Retail | 1 | $60B |
|
||
| Technology Distribution | 1 | $58B |
|
||
| Homebuilding | 1 | $35B |
|
||
| Technology Manufacturing | 1 | $35B |
|
||
Price history
+230.4% since first listed13 events — show timeline
- 2026-03-05 Listed $171,500 Stellar MLS as Distributed by MLS Grid
- 2023-11-06 Listing Removed — Stellar MLS as Distributed by MLS Grid
- 2023-10-31 Price Changed $193,900 Stellar MLS as Distributed by MLS Grid
- 2023-09-16 Listed $194,500 Stellar MLS as Distributed by MLS Grid
- 2019-08-05 Sold (Public Records) $111,000 Public Records
- 2019-08-02 Sold (MLS) $111,000 Stellar MLS as Distributed by MLS Grid
- 2019-06-17 Listed $116,580 Stellar MLS as Distributed by MLS Grid
- 2012-01-06 Sold (MLS) $56,500 Stellar MLS as Distributed by MLS Grid
- 2011-11-17 Listed $61,500 Stellar MLS as Distributed by MLS Grid
- 2005-06-20 Sold (Public Records) $129,000 Public Records
- 2004-12-14 Sold (Public Records) $105,000 Public Records
- 1999-06-01 Sold (Public Records) $61,000 Public Records
- 1986-08-01 Sold (Public Records) $51,900 Public Records
Property tax history
+8.4%/yrLatest (2025): $3,056 · +4.3% YoY. Source: county tax records.
Cash-flow waterfall
monthlySold comps — $/sqft
last 12 mo · ≤1 miLoading sold comps…