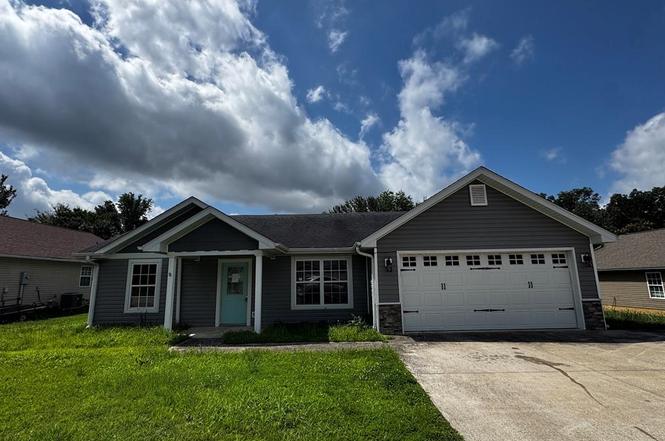
104 Avery Ln · Poplar Bluff, MO
Flood risk 1/10 · Minimal
- FEMA flood zone
- X (unshaded)
- Chance of flooding over 30 yrs
- 0.0%
- Est. flood insurance / yr
- $507 – $1,088
Fire risk 4/10 · Minor
- Est. fire insurance / yr
- $1,054 – $1,958
Heat risk 5/10 · Moderate
- Hot days now (above 107°F)
- 7 days/yr
- Hot days in 30 yrs
- 20 days/yr
Wind risk 3/10 · Minor
- Chance of severe wind over 30 yrs
- 5.0%
Air-quality risk 1/10 · Minimal
- Unhealthy air days now
- 0 days/yr
- Unhealthy air days in 30 yrs
- 0 days/yr
Risk factors via First Street. Map © Google.
Why this score? — see what drove the C+ grade
The composite is a weighted blend of 9 inputs, each scored 0–100. Each bar is that input's sub-score; the figure is the points it added to the 100-point composite (weight × sub-score).
- Cash flow +26.9/30.0
- DSCR +9.3/10.0
- ARV discount +7.5/15.0
- 1% rule +7.3/10.0
- Schools +3.5/10.0
- Livability +3.5/5.0
- Rent growth +2.5/5.0
- Condition / age +2.5/5.0
- Appreciation +0.0/10.0
$74,900
🖨 Deal sheet 📄 Offer letter ✓ Due diligence
Listing remarks MLS
Who's looking for a modern open floor plan with all of the extras!? This beautiful 3 bedroom, 2 bathroom home features vaulted ceilings, custom tile work in the master bathroom along with a walk-in closet. It has an attached 2 car garage and sits just North of Poplar Bluff. This house leaves little to be desired and these sellers are motivated!
Key facts
- 8,276 sq ft lot
- 2 garage spots
- Built 2016
Property features AI
Finance
- Other: Above-grade finished area reported as 1,298 (source: assessor); Lot size about 0.19 acre (source: public records)
- Financial info: Lease not considered
Exterior
- Parking: Attached garage with space for 2 vehicles
- Utilities: Public water; Public sewer; Electric: single phase and 220 volts
- Home design: Single-family residence (attached property); One level; Private ownership
- Construction: Vinyl siding exterior; Asphalt roof
- Exterior features: Porch and rear porch; Level lot; Asphalt road access
Interior
- Kitchen: No kitchen appliances reported
- Bedrooms: Three bedrooms, all on the main level
- Flooring: No flooring details provided
- Bathrooms: Two full bathrooms, both on the main level
- Heating & cooling: Other heating; Other cooling
- Interior features: No major built-in appliances reported; No special interior flooring reported
- Laundry & utility: Main-level laundry
Neighborhood map
What this means for you Summary
Snapshot
- This is a 3-bed/2.0-bath other listed at $75k.
Deal economics
- At list price, monthly cash flow is $208 ($3k/yr) — positive.
- The deal already cash-flows at list — no discount required.
- Meets the 1% rule at list price ($920 rent vs $75k).
- Cap rate 9.6% vs local median 4.4% in Poplar Bluff — top-decile yield for the area; either an underpriced asset or a hidden risk that comps aren't pricing in. Stress-test before assuming the spread holds.
Location & tenants
- Location reads 70/100 on livability (#143 in MO) — a middle-class / working-renter tenant base. Strengths: crime A+, cost of living A+, housing A+; Watch: amenities F, commute F, employment F.
- Poplar Bluff R-I (town): math 38% / reading 47% proficiency, ranked #127 of 324 in MO (top 39%) — families likely to look elsewhere, expect single-tenant / working-renter base with shorter leases.
- Zoned schools: Oak Grove Elem. (math 57% / reading 72%, grade B, #70 of 1,115 statewide, top 8%, 318 students, 99% FRL); Poplar Bluff High (math 22% / reading 42%, grade F, #356 of 521 statewide, top 71%, 1,504 students, 56% FRL) — zoned schools average 78% FRL vs 56% district-wide (21 pts higher); higher-poverty schools than district average — tighter screening recommended.
- Market conditions: 274 active listings in the ZIP; 1 comparable units currently listed for rent nearby; 63 units permitted in Butler County in 2024 (48 in 5+ unit buildings).
Forward outlook
- Local home prices are declining (-3.0%/yr); year-one equity from $518 of loan paydown is wiped out by about $2k of value loss. Plan a longer hold.
- Butler County population projected to shrink 6% by 2050 — rents likely to lag national; underwrite the cash flow, not the appreciation.
- At projected returns (-3.0% appreciation + 3.0% rent growth), your $21k cash investment doubles in ~10 years — after that, you're playing with house money.
Negotiation context
- Only 1 days on market — expect competitive offers; lowballing is unlikely to land.
- 2 sale attempts since 8y ago with the ask held roughly flat each time — persistent listings suggest the price (not the market) is what's stuck; bring a comps-based counter.
Risks & watch-outs
- Climate carrying-cost: extreme-heat days projected 7→20/yr by 2055 (HVAC capex compounding) — expect insurance premiums to compound above CPI over the hold.
Questions for the listing agent
- Is there a deadline driving the sale (1031 exchange, divorce, estate, relocation)? That informs how much negotiation room exists.
- What's the average days-on-market for RENTAL listings here right now (not sales)? A rising rental-DOM trend means longer vacancies and softer asking-rent achievability than the comps imply.
- What's the recent tenant-quality profile in this submarket — average credit score on applications, eviction rate, late-payment / NSF rate, and stable-employment percentage? A property-management company in the area should have these aggregated.
- How much new for-sale + rental construction is in the pipeline within 1–3 miles? Heavy new supply typically softens prices + rents 12–24 months out; constrained supply supports both.
Investment metrics
- 1% rule
- 1.23% ✓
- Cap rate
- 9.63%
- Cash-on-cash
- 11.93%
- DSCR
- 1.53
- GRM
- 6.8
CMA / ARV
No comps found within radius.
Projected returns pro-forma
-3.0% appreciation · 3.0% rent growth · sell at horizon
- IRR
- 1.4%
- Equity multiple
- 1.06×
- Total profit
- $1,156
- Equity at exit
- $11,168
- IRR
- 11.1%
- Equity multiple
- 1.87×
- Total profit
- $18,162
- Equity at exit
- $6,476
Cash invested: $20,972 (down + closing). Projections, not guarantees.
Landlord ↔ Tenant lean methodology
- Overall (STATE)
- 81 Strongly Landlord-Friendly
- State Missouri
- 81 Strongly Landlord-Friendly · R+10
- County
- — inherits STATE
- City
- — inherits STATE
ZIP-level market 63901
- Home prices YoY
- -22.4%
- Active inventory
- 274
- Price-to-rent
- 6.8×
Monthly cashflow live
- Estimated rent
- $920 medium interval (Pro) →
- Mortgage (P&I)
- −$393
- Tax from tax record
- −$94 /mo · $1,132/yr
- Insurance
- −$31
- HOA
- −$0
- Vacancy / Maint / Mgmt
- −$193
- Net cashflow
- $208
Break-even live
UW: 25.0% down · 7.5% · 30yr · 1.5% tax · 5.0% vac · 8.0% maint · 8.0% mgmt
Financing live
Cash to close
- Down payment
- $18,725
- Closing costs
- $2,247
- Reserves months
- —
- Total cash needed
- —
Loan-product check · same deal, 3 products live
Conventional
25% down · 7.5% · 30yr
- Down + closing
- —
- Monthly P&I
- —
- Monthly cashflow
- —
- DSCR
- —
- Eligible?
- —
Personal DTI + credit; lowest rate.
DSCR
20% down · 8.5% · 30yr
- Down + closing
- —
- Monthly P&I
- —
- Monthly cashflow
- —
- DSCR
- —
- Eligible?
- —
No personal income docs; deal must DSCR.
Hard money
10% down · 12.0% · 12mo
- Down + closing
- —
- Monthly P&I
- —
- Monthly cashflow
- —
- DSCR
- —
- Eligible?
- —
Short-term bridge; refi at stabilization.
Rent comps 1 comps
| Address | Beds | Baths | Sqft | Rent | $/sqft | DOM | Units | Dist |
|---|---|---|---|---|---|---|---|---|
| 135 Missouri W Poplar Bluff, MO | 2.0 | 1.5 | 1100 | $920 | $0.84 | 44d | 2 | 1.26mi |
Listing history 2 events
-
2026-06-17remarks 454-char remark
-
2026-06-17$74,900 Active 1 DOM
ⓘ Source: listings_history table (triggers on properties + properties_extension) + one-shot
backfill from property_details.listing_events for pre-trigger history.
Tax reassessment forecast MO · Resets to sale price
- Current annual tax
- $1,132 · $94/mo
- Projected year-2 tax
- $1,132 · $94/mo
- Expected delta
- $0/yr ($0/mo · 0.0%)
ⓘ Screening estimate from a state-policy table — verify with the county assessor before closing.
Climate risk First Street
- Flood 1/10 Low FEMA zone X (unshaded) · 0% chance over 30 yrs
- Wildfire 4/10 Moderate
- Heat 5/10 Major 7 d/yr ≥107°F today · 20 d/yr by 30 yrs out
- Wind 3/10 Moderate 5% chance of damaging wind over 30 yrs
- Air quality 1/10 Low 0 unhealthy d/yr today · 0 by 30 yrs out
Nearby sold comps map
Loading sold comps map…
Walkable amenities ~0.75 mi
Loading nearby amenities…
Taxation est. · year 1
- Rental income
- $11,040
- − Mortgage interest
- −$4,196
- − Property taxes
- −$1,132
- − Insurance
- −$374
- − Repairs & maintenance
- −$883
- − Management
- −$883
- − Depreciation
- −$2,179
- Taxable income
- $1,393
- Est. tax owed @ 24.0%
- −$334
- After-tax cash flow
- $2,168/yr
For passive investors: Depreciation is non-cash, so a rental often shows a tax loss while cash-flowing — sheltering income. Rental losses are passive: they offset passive income freely, and up to $25,000/yr can offset ordinary (W-2) income if you actively participate and your MAGI is under $100k (phasing out to $0 by $150k); unused losses carry forward. On sale, claimed depreciation is recaptured at up to 25%, and gains may owe capital-gains tax (a 1031 exchange can defer both). Figures are a year-1 estimate at your 24.0% rate — not tax advice; consult a CPA.
Schools (NCES district)
- District
- Poplar Bluff R-I
- NCES district ID
- 2925450
- Math proficiency
- 38% ▼ -4.00%
- Reading proficiency
- 47% ▼ -3.00%
- Median HH income
- $35,761
- Composite
- 35.17/100
- National rank
- #5001
- State rank
- #127 of 324 in MO
Livability — Poplar Bluff
- Score
- 70/100
- State rank
- #143
- US rank
- #8135
Category grades
Schools grade is shown separately in the Schools card above.
Census & demographics
- City population
- 34,920
- Population (ZIP)
- 34,920
Population outlook (Butler County) Hauer SSP2
- Today (2025)
- 42,648 people
- By 2030
- 42,329 · -0.7%
- By 2040
- 41,498 · -2.7%
- By 2050
- 40,308 · -5.5%
- By 2075
- 36,168 · -15.2%
- By 2100
- 28,893 · -32.3%
Race, ethnicity, and origin ACS 2023
- Neighborhood character
- Predominantly White (85%)
- Race & ethnicity
- White 85% Two or more races 6% Black 5% Hispanic / Latino 2%
- Common ancestry
- Slovak 2% Lithuanian 1% Romanian 1%
- Foreign-born
- 1% · Canada
- Languages at home
- 98% English-only · Spanish 1%
Political lean MEDSL · Butler
- 2024 margin
- Solid R (+63.8) · D 17.7% · R 81.5%
- 2008→2024 swing
- -26.4pp toward R · 2008: -37.4pp · 2024: -63.8pp
- All cycles
- 2024: R+63.8 2020: R+62.3 2016: R+61.6 2012: R+46.7 2008: R+37.4
Not yet ingested
- Civics
- —
Market trends
- HPI YoY
- ▼ -50.64%
- Current HPI
- 175.3008
- Rent YoY
- —
- Metro
- —
- State GDP YoY
- ▲ 1.84%
- F500 in state
- 20
Industry mix (Fortune 500 HQ in MO)
| Industry | F500 HQs | Revenue |
|---|---|---|
| Healthcare | 1 | $163B |
|
||
| Insurance | 1 | $21B |
|
||
| Industrial Technology | 1 | $17B |
|
||
| Retail | 1 | $16B |
|
||
| Industrial Distribution | 1 | $10B |
|
||
| Utilities | 1 | $9B |
|
||
Price history
-42.2% since first listed4 events — show timeline
- 2026-06-17 Listed $74,900 MARIS as Distributed by MLS Grid
- 2019-02-05 Sold (Public Records) — Public Records
- 2019-02-04 Sold (MLS) — MARIS as Distributed by MLS Grid
- 2018-07-31 Listed $129,500 MARIS as Distributed by MLS Grid
Property tax history
+11.2%/yrLatest (2025): $1,132 · +4.9% YoY. Source: county tax records.
Cash-flow waterfall
monthlySold comps — $/sqft
last 12 mo · ≤1 miLoading sold comps…