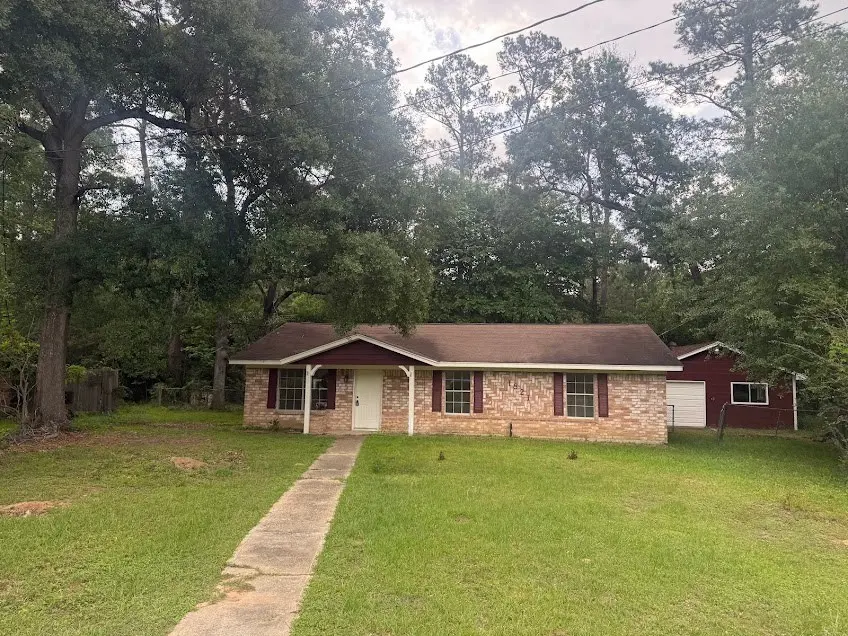
1821 Live Oak Dr · Conroe, TX
Flood risk 9/10 · Severe
- FEMA flood zone
- X (shaded)
- Chance of flooding over 30 yrs
- 0.99%
- Est. flood insurance / yr
- $507 – $1,088
Fire risk 3/10 · Minor
- Est. fire insurance / yr
- $1,222 – $2,270
Heat risk 8/10 · Major
- Hot days now (above 111°F)
- 7 days/yr
- Hot days in 30 yrs
- 24 days/yr
Wind risk 8/10 · Major
- Chance of severe wind over 30 yrs
- 99.0%
Air-quality risk 2/10 · Minimal
- Unhealthy air days now
- 2 days/yr
- Unhealthy air days in 30 yrs
- 2 days/yr
Risk factors via First Street. Map © Google.
Why this score? — see what drove the D grade
The composite is a weighted blend of 9 inputs, each scored 0–100. Each bar is that input's sub-score; the figure is the points it added to the 100-point composite (weight × sub-score).
- ARV discount +15.0/15.0
- Cash flow +8.9/30.0
- Schools +5.1/10.0
- Livability +3.7/5.0
- Rent growth +2.9/5.0
- 1% rule +2.7/10.0
- DSCR +2.5/10.0
- Condition / age +2.5/5.0
- Appreciation +0.0/10.0
$219,999
🖨 Deal sheet 📄 Offer letter ✓ Due diligence
Listing remarks MLS
JUST LISTED! This Brick home in Conroe, TX! Nestled north of Houston near the scenic Sam Houston National Forest, this inviting home features fresh paint and a welcoming interior. Enjoy the peace and tranquility of country living while staying close to the city’s conveniences. Don’t miss this opportunity to embrace a quiet, relaxed lifestyle in a beautiful Conroe location! WE MAKE IT EASY TO OWN. This is a great opportunity! Don't wait, call us today to get more information on the owner's easy terms and smooth process that may be able to put the deed in your name and make this your dream home. When you call be sure and ask about the OTHER HOMES we have in the Conroe Atrea. We even have an INVESTOR PACKAGE if you want to buy several homes. Just give a call for more details.
Key facts
- Country living
- Brick home
- Welcoming interior
Tags
Neighborhood map
What this means for you Summary
Snapshot
- This is a 3-bed/1.5-bath single-family listed at $220k.
Deal economics
- At list price, monthly cash flow is $-244 ($-3k/yr) — negative.
- To cash-flow at today's rent, offer at most $177k (19.6% below list).
- To meet the 1% rule (rent ≥ 1% of price), the offer needs to be $170k (22.8% below list).
- Recommended offer: $170k (22.8% below list) — sets the bar for 1% rule.
- Cap rate 5.3% vs local median 3.1% in Conroe — top-decile yield for the area; either an underpriced asset or a hidden risk that comps aren't pricing in. Stress-test before assuming the spread holds.
Location & tenants
- Location reads 74/100 on livability (#169 in TX, #4,447 nationally) — a middle-class / working-renter tenant base. Strengths: cost of living A+, housing A+, amenities B; Watch: schools D+, commute F, health & safety F.
- Conroe ISD (other): math 57% / reading 57% proficiency, ranked #69 of 826 in TX (top 8%) — acceptable for families but not a draw, mixed tenant base, ~2y average lease.
- Market conditions: Rents rising (+1.4%/yr); 486 active listings in the ZIP; 29 comparable units currently listed for rent nearby; rentals at typical pace (median 15d on market — plan ~3-4 weeks tenant-placement turnaround); 13,259 units permitted in Montgomery County in 2024 (1,402 in 5+ unit buildings).
- This rent runs 31% of the median local income ($66k/yr) — at the standard rent-burdened threshold; future hikes will face affordability resistance.
Forward outlook
- Local home prices are declining (-3.0%/yr); year-one equity from $2k of loan paydown is wiped out by about $7k of value loss. Plan a longer hold.
- Montgomery County population projected at +65% by 2050 — long-run rental-demand tailwind backs the buy-and-hold thesis.
Negotiation context
- It's been on market 139 days — a 12% lower offer ($194k) is reasonable based on typical stale-listing flexibility.
- 9 sale attempts since 12y ago with the ask held roughly flat each time — persistent listings suggest the price (not the market) is what's stuck; bring a comps-based counter.
- Current owner paid $120k; list at $220k implies a 83% gain — meaningful room to come down on a strong offer.
Risks & watch-outs
- Watch-outs: flood insurance adds $66/mo.
- Climate carrying-cost: severe flood risk; severe wind risk, 99% chance of damaging wind over 30y; extreme-heat days projected 7→24/yr by 2055 (HVAC capex compounding) — expect insurance premiums to compound above CPI over the hold.
Questions for the listing agent
- What do current leases actually rent for vs. the listed asking? Can we see a recent rent roll and the last 12 months of T-12 income?
- It's been on market 139 days. Have you received any prior offers? Is the seller open to a 23% concession, seller financing, or rate buy-down credit?
- Built in 1974 — when were the roof, HVAC, electrical panel, plumbing, and water heater last replaced?
- What's the actual annual flood-insurance premium (NFIP or private), and is the property in a SFHA with mandatory coverage?
- Why hasn't it sold? Are there any deal-killer items the seller is aware of (foundation, flood, title, zoning, code violations)?
- Is there a deadline driving the sale (1031 exchange, divorce, estate, relocation)? That informs how much negotiation room exists.
- Schools are D-rated, which usually means shorter tenancies and higher turnover. Who's the typical renter profile here, and what's been the actual vacancy rate?
- The area grade is low — what's the realistic commute time and amenity access for the typical tenant pool here? Any planned neighborhood developments (good or bad) we should know about?
- What's the average days-on-market for RENTAL listings here right now (not sales)? A rising rental-DOM trend means longer vacancies and softer asking-rent achievability than the comps imply.
- What's the recent tenant-quality profile in this submarket — average credit score on applications, eviction rate, late-payment / NSF rate, and stable-employment percentage? A property-management company in the area should have these aggregated.
- How much new for-sale + rental construction is in the pipeline within 1–3 miles? Heavy new supply typically softens prices + rents 12–24 months out; constrained supply supports both.
Investment metrics
- 1% rule
- 0.77% ✗
- Cap rate
- 5.33%
- Cash-on-cash
- -3.46%
- DSCR
- 0.85
- GRM
- 10.8
CMA / ARV
- ARV (median comp)
- $272,874
- List price
- $219,999
- Delta
- -19.38%
- Verdict
- UNDERPRICED
- Comps
- 20 within 1.0 mi
Show comp detail 12 sales within ~0.75 mi
| Address | Dist | Beds/Ba | Sqft | Sold | Price | $/sf | Match |
|---|---|---|---|---|---|---|---|
| 1809 Live Oak Dr | 0.10mi | 3/2.0 | 1,387 (+8%) | 2mo | $199,000 | $143 | 79 |
| 1810 Live Oak Dr | 0.10mi | 3/2.0 | 1,328 (+3%) | 22mo | $199,047 | $150 | 70 |
| 1819 Pin Oak Dr | 0.19mi | 3/2.0 | 1,426 (+11%) | 6mo | $275,000 | $193 | 66 |
| — | 0.12mi | 3/2.0 | 1,428 (+11%) | 12mo | $320,000 | $224 | 64 |
| 1828 Porter Rd | 0.41mi | 2/2.5 (-1) | 1,280 (-1%) | 13mo | $325,000 | $254 | 60 |
| 1708 Porter Rd | 0.44mi | 3/2.0 | 1,440 (+12%) | 4mo | $230,000 | $160 | 54 |
| 2815 Beech River Ct | 0.54mi | 3/2.0 | 1,426 (+11%) | 1mo | $249,990 | $175 | 54 |
| 14813 North Ascot Bend Cir | 0.51mi | 3/2.0 | 1,418 (+10%) | 9mo | $238,990 | $169 | 50 |
| 2418 Ridge Oak Dr | 0.74mi | 3/2.0 | 1,248 (-3%) | 11mo | $199,900 | $160 | 49 |
| 1707 Hickory Burl Ln | 0.61mi | 3/2.0 | 1,468 (+14%) | 1mo | $195,000 | $133 | 45 |
| 236 Cunningham Fir Trl | 0.58mi | 3/2.0 | 1,461 (+13%) | 13mo | $270,000 | $185 | 38 |
| 1621 Hickory Burl Ln | 0.62mi | 3/2.0 | 1,446 (+12%) | 14mo | $243,000 | $168 | 37 |
Match score weights: distance 35% · size 25% · config 20% · recency 20%. Top-matched comps best support the ARV.
Projected returns pro-forma
-3.0% appreciation · 1.43% rent growth · sell at horizon
- IRR
- -26.2%
- Equity multiple
- 0.13×
- Total profit
- $-53,755
- Equity at exit
- $32,803
- IRR
- -29.3%
- Equity multiple
- -0.25×
- Total profit
- $-77,040
- Equity at exit
- $19,021
Cash invested: $61,600 (down + closing). Projections, not guarantees.
Landlord ↔ Tenant lean methodology
- Overall (STATE)
- 87 Strongly Landlord-Friendly
- State Texas
- 87 Strongly Landlord-Friendly · R+5
- County
- — inherits STATE
- City
- — inherits STATE
ZIP-level market 77301
- Home prices YoY
- -8.4%
- Rents YoY
- 1.4%
- Active inventory
- 486
- Price-to-rent
- 10.8×
Monthly cashflow live
- Estimated rent
- $1,697 high interval (Pro) →
- Mortgage (P&I)
- −$1,154
- Tax from tax record
- −$273 /mo · $3,276/yr
- Insurance
- −$92
- Flood insurance flood zone
- −$66 /mo · $798/yr
- HOA
- −$0
- Vacancy / Maint / Mgmt
- −$356
- Net cashflow
- $-244
Break-even live
UW: 25.0% down · 7.5% · 30yr · 1.5% tax · 5.0% vac · 8.0% maint · 8.0% mgmt
Financing live
Cash to close
- Down payment
- $55,000
- Closing costs
- $6,600
- Reserves months
- —
- Total cash needed
- —
Loan-product check · same deal, 3 products live
Conventional
25% down · 7.5% · 30yr
- Down + closing
- —
- Monthly P&I
- —
- Monthly cashflow
- —
- DSCR
- —
- Eligible?
- —
Personal DTI + credit; lowest rate.
DSCR
20% down · 8.5% · 30yr
- Down + closing
- —
- Monthly P&I
- —
- Monthly cashflow
- —
- DSCR
- —
- Eligible?
- —
No personal income docs; deal must DSCR.
Hard money
10% down · 12.0% · 12mo
- Down + closing
- —
- Monthly P&I
- —
- Monthly cashflow
- —
- DSCR
- —
- Eligible?
- —
Short-term bridge; refi at stabilization.
Rent comps 29 comps
| Address | Beds | Baths | Sqft | Rent | $/sqft | DOM | Units | Dist |
|---|---|---|---|---|---|---|---|---|
| 11656 Conroe Porter Rd Conroe, TX | 2.0 | 2.0 | 966 | $1,200 | $1.24 | 43d | 1 | 0.42mi |
| 2086 Porter Rd Unit 2119 Conroe, TX | 3.0 | 2.0 | 1150 | $1,905 | $1.66 | 43d | 1 | 0.47mi |
| 2086 Porter Rd Unit 2143 Conroe, TX | 2.0 | 2.0 | 966 | $1,188 | $1.23 | 43d | 1 | 0.47mi |
| 2086 Porter Rd Unit 2174 Conroe, TX | 2.0 | 2.0 | 966 | $1,388 | $1.44 | 12d | 1 | 0.47mi |
| 2086 Porter Rd Conroe, TX | 3.0 | 2.0 | 1150 | $1,698 | $1.48 | 2d | 1 | 0.47mi |
| 2086 Porter Rd Unit 2228 Conroe, TX | 2.0 | 2.0 | 966 | $1,345 | $1.39 | 2d | 1 | 0.47mi |
| 2086 Porter Rd Unit 2162 Conroe, TX | 2.0 | 2.0 | 966 | $1,353 | $1.40 | 7d | 1 | 0.47mi |
| 2086 Porter Rd Unit 3174 Conroe, TX | 3.0 | 2.0 | 1150 | $1,623 | $1.41 | 12d | 1 | 0.47mi |
| 2086 Porter Rd Unit 3228 Conroe, TX | 3.0 | 2.0 | 1150 | $1,580 | $1.37 | 2d | 1 | 0.47mi |
| 2086 Porter Rd Conroe, TX | 1.0–3.0 | 1.0–2.0 | 877 | $2,032 | $2.32 | 1d | 1 | 0.47mi |
| 2086 Porter Rd Conroe, TX | 2.0 | 2.0 | 973 | $1,854 | $1.91 | 7d | 1 | 0.47mi |
| 1933 Argo Rd Conroe, TX | 2.0 | 2.0 | 964 | $1,324 | $1.37 | 24d | 7 | 0.48mi |
| 1558 San Sebastien Dr Conroe, TX | 4.0 | 2.0 | 1683 | $1,750 | $1.04 | 2d | 1 | 0.76mi |
| 1530 San Sebastien Dr Conroe, TX | 4.0 | 3.0 | 1845 | $1,900 | $1.03 | 22d | 1 | 0.78mi |
| 2617 Castille Valley Pl Conroe, TX | 4.0 | 2.0 | 1683 | $1,800 | $1.07 | 2d | 1 | 0.80mi |
| 1442 Natural Pine Trl Conroe, TX | 4.0 | 2.5 | 1848 | $1,656 | $0.90 | 14d | 1 | 0.81mi |
| 3006 Twisted Myrtle Dr Conroe, TX | 3.0 | 2.0 | 1311 | $1,759 | $1.34 | 15d | 1 | 0.92mi |
| 1307 Vincente Ct Conroe, TX | 4.0 | 3.0 | 1860 | $2,300 | $1.24 | 43d | 1 | 1.02mi |
| 3524 Cub Ct Conroe, TX | 3.0 | 2.0 | 1398 | $1,665 | $1.19 | 43d | 1 | 1.14mi |
| 1723 Hazelwood St Conroe, TX | 2.0 | 2.0 | 1200 | $1,500 | $1.25 | 43d | 1 | 1.14mi |
| 1611 Hazelwood St Unit A Conroe, TX | 2.0 | 2.0 | 1008 | $1,145 | $1.14 | 24d | 1 | 1.16mi |
| 727 Long Cedar Dr Conroe, TX | 3.0 | 2.0 | 1340 | $1,650 | $1.23 | 12d | 1 | 1.25mi |
| 1299 S 7th St Conroe, TX | 2.0 | 2.0 | 964 | $1,350 | $1.40 | 18d | 1 | 1.26mi |
| 719 Long Cedar Dr Conroe, TX | 4.0 | 2.0 | 1459 | $1,595 | $1.09 | 43d | 1 | 1.27mi |
| 816 Lightningbug Ln Conroe, TX | 4.0 | 2.0 | 1532 | $1,724 | $1.13 | 20d | 1 | 1.29mi |
| 817 Lovebug Ln Conroe, TX | 3.0 | 2.0 | 1276 | $1,595 | $1.25 | 12d | 1 | 1.32mi |
| 805 Belvedere Dr Conroe, TX | 4.0 | 2.0 | 1577 | $1,624 | $1.03 | 20d | 1 | 1.37mi |
| 1710 Leafhopper Ln Conroe, TX | 3.0 | 2.0 | 1732 | $1,830 | $1.06 | 24d | 1 | 1.41mi |
| 200 Montrose Cir Conroe, TX | 3.0 | 2.0 | 1679 | $1,485 | $0.88 | 12d | 1 | 1.48mi |
Listing history 44 events
-
2026-06-18days on market $219,999 Active 139 DOM
-
2026-06-17days on market $219,999 Active 138 DOM
-
2026-06-16days on market $219,999 Active 137 DOM
-
2026-06-15days on market $219,999 Active 136 DOM
-
2026-06-13days on market $219,999 Active 134 DOM
-
2026-06-09days on market $219,999 Active 130 DOM
-
2026-06-08days on market $219,999 Active 129 DOM
-
2026-06-07days on market $219,999 Active 128 DOM
-
2026-06-04days on market $219,999 Active 125 DOM
-
2026-06-03days on market $219,999 Active 124 DOM
-
2026-06-02days on market $219,999 Active 123 DOM
-
2026-06-01days on market $219,999 Active 122 DOM
-
2026-05-31days on market $219,999 Active 121 DOM
-
2026-01-30$219,999 Active 795-char remark
Show marketing remark (795 chars)
JUST LISTED! This Brick home in Conroe, TX! Nestled north of Houston near the scenic Sam Houston National Forest, this inviting home features fresh paint and a welcoming interior. Enjoy the peace and tranquility of country living while staying close to the city’s conveniences. Don’t miss this opportunity to embrace a quiet, relaxed lifestyle in a beautiful Conroe location! WE MAKE IT EASY TO OWN. This is a great opportunity! Don't wait, call us today to get more information on the owner's easy terms and smooth process that may be able to put the deed in your name and make this your dream home. When you call be sure and ask about the OTHER HOMES we have in the Conroe Atrea. We even have an INVESTOR PACKAGE if you want to buy several homes. Just give a call for more details.
-
2025-04-22soldstatus $120,000
-
2024-02-06historical
-
2023-10-06status Active
-
2023-09-07status Pending, Continue to Show
-
2023-07-23status Pending
-
2023-06-27status Option Pending
-
2023-04-22$199,900 Active
-
2023-03-31historical
-
2023-01-26$203,983 Active
-
2019-11-21historical
-
2019-08-24price $125,900
-
2019-04-04status Active
-
2019-04-02status Option Pending
-
2019-04-02status Pending
-
2018-11-17price $126,050
-
2018-10-27price $128,970
-
2018-10-27price $131,605
-
2018-08-25$132,350 Active
-
2018-08-09historical
-
2018-03-23status Active
-
2018-02-12status Pending
-
2018-02-11price $145,000
-
2018-02-09$135,000 Active
-
2015-01-29soldstatus
-
2015-01-28soldstatus Sold
-
2015-01-02status Pending, Continue to Show
-
2014-12-22status Option Pending
-
2014-11-26$130,000 Active
-
2001-05-01soldstatus
-
1987-09-01soldstatus
ⓘ Source: listings_history table (triggers on properties + properties_extension) + one-shot
backfill from property_details.listing_events for pre-trigger history.
Tax reassessment forecast TX · Resets to sale price
- Current annual tax
- $3,276 · $273/mo
- Projected year-2 tax
- $4,026 · $335/mo
- Expected delta
- +$750/yr (+$62/mo · 22.9%)
ⓘ Screening estimate from a state-policy table — verify with the county assessor before closing.
Climate risk First Street
- Flood 9/10 Extreme FEMA zone X (shaded) · 99% chance over 30 yrs
- Wildfire 3/10 Moderate
- Heat 8/10 Severe 7 d/yr ≥111°F today · 24 d/yr by 30 yrs out
- Wind 8/10 Severe 99% chance of damaging wind over 30 yrs
- Air quality 2/10 Low 2 unhealthy d/yr today · 2 by 30 yrs out
Nearby sold comps map
Loading sold comps map…
Walkable amenities ~0.75 mi
Loading nearby amenities…
Taxation est. · year 1
- Rental income
- $20,369
- − Mortgage interest
- −$12,323
- − Property taxes
- −$3,276
- − Insurance
- −$1,897
- − Repairs & maintenance
- −$1,630
- − Management
- −$1,630
- − Depreciation
- −$6,400
- Taxable loss
- −$6,787
- Est. tax savings @ 24.0%
- +$1,629
- After-tax cash flow
- $-1,297/yr
For passive investors: Depreciation is non-cash, so a rental often shows a tax loss while cash-flowing — sheltering income. Rental losses are passive: they offset passive income freely, and up to $25,000/yr can offset ordinary (W-2) income if you actively participate and your MAGI is under $100k (phasing out to $0 by $150k); unused losses carry forward. On sale, claimed depreciation is recaptured at up to 25%, and gains may owe capital-gains tax (a 1031 exchange can defer both). Figures are a year-1 estimate at your 24.0% rate — not tax advice; consult a CPA.
Schools (NCES district)
- District
- Conroe ISD
- NCES district ID
- 4815000
- Math proficiency
- 57% ▼ -6.00%
- Reading proficiency
- 57% ▼ -1.00%
- Median HH income
- $71,541
- Composite
- 50.65/100
- National rank
- #1833
- State rank
- #69 of 826 in TX
Livability — Conroe
- Score
- 74/100
- State rank
- #169
- US rank
- #4447
Category grades
Schools grade is shown separately in the Schools card above.
Census & demographics
- Census place
- Conroe, TX
- County
- Montgomery County · 663,713 people
- City population
- 205,417
- Metro
- Houston-The Woodlands-Sugar Land, TX
- Population (ZIP)
- 37,769
- Household income
- $66,475
- Rent vs Own
- Severe rent burden
- 1256.0
Population outlook (Montgomery County) Hauer SSP2
- Today (2025)
- 713,896 people
- By 2030
- 805,263 · +12.8%
- By 2040
- 992,708 · +39.1%
- By 2050
- 1,179,590 · +65.2%
- By 2075
- 1,628,084 · +128.1%
- By 2100
- 1,937,880 · +171.5%
Race, ethnicity, and origin ACS 2023
- Neighborhood character
- Diverse neighborhood (Simpson 0.62)
- Race & ethnicity
- Hispanic / Latino 52% White 31% Two or more races 19% Black 13% Asian 2% Native American 2%
- Hispanic origin (detail)
- Mexican 37%
- Common ancestry
- Lithuanian 2% Slovak 1% Romanian 1%
- Foreign-born
- 27% · Canada, Jamaica
- Languages at home
- 51% English-only · Spanish 45% Other Asian/Pacific 2%
Political lean MEDSL · Montgomery
- 2024 margin
- Solid R (+45.5) · D 26.8% · R 72.3%
- 2008→2024 swing
- +7.2pp toward D · 2008: -52.7pp · 2024: -45.5pp
- All cycles
- 2024: R+45.5 2020: R+43.8 2016: R+51.4 2012: R+60.7 2008: R+52.7
Not yet ingested
- Civics
- —
Market trends
- HPI YoY
- ▼ -25.51%
- Current HPI
- 278.6662
- Rent YoY
- ▲ 1.43%
- Metro
- Houston-The Woodlands-Sugar Land, TX
- State GDP YoY
- ▲ 3.95%
- F500 in state
- 110
Industry mix (Fortune 500 HQ in TX)
| Industry | F500 HQs | Revenue |
|---|---|---|
| Energy | 16 | $1,198B |
|
||
| Technology | 5 | $198B |
|
||
| Engineering / Construction | 4 | $72B |
|
||
| Energy Services | 3 | $60B |
|
||
| Utilities | 3 | $41B |
|
||
| Healthcare | 2 | $330B |
|
||
Price history
+69.2% since first listed31 events — show timeline
- 2026-01-30 Listed $219,999 HARMLS
- 2025-04-22 Sold (Public Records) $120,000 Public Records
- 2024-02-06 Listing Removed — HARMLS
- 2023-10-06 Relisted — HARMLS
- 2023-09-07 Pending — HARMLS
- 2023-07-23 Pending — HARMLS
- 2023-06-27 Pending — HARMLS
- 2023-04-22 Listed $199,900 HARMLS
- 2023-03-31 Listing Removed — HARMLS
- 2023-01-26 Listed $203,983 HARMLS
- 2019-11-21 Listing Removed — HARMLS
- 2019-08-24 Price Changed $125,900 HARMLS
- 2019-04-04 Relisted — HARMLS
- 2019-04-02 Pending — HARMLS
- 2019-04-02 Pending — HARMLS
- 2018-11-17 Price Changed $126,050 HARMLS
- 2018-10-27 Price Changed $128,970 HARMLS
- 2018-10-27 Price Changed $131,605 HARMLS
- 2018-08-25 Listed $132,350 HARMLS
- 2018-08-09 Listing Removed — HARMLS
- 2018-03-23 Relisted — HARMLS
- 2018-02-12 Pending — HARMLS
- 2018-02-11 Price Changed $145,000 HARMLS
- 2018-02-09 Listed $135,000 HARMLS
- 2015-01-29 Sold (Public Records) — Public Records
- 2015-01-28 Sold (MLS) — HARMLS
- 2015-01-02 Pending — HARMLS
- 2014-12-22 Pending — HARMLS
- 2014-11-26 Listed $130,000 HARMLS
- 2001-05-01 Sold (Public Records) — Public Records
- 1987-09-01 Sold (Public Records) — Public Records
Property tax history
+6.6%/yrLatest (2025): $3,276 · +2.9% YoY. Source: county tax records.
Cash-flow waterfall
monthlySold comps — $/sqft
last 12 mo · ≤1 miLoading sold comps…