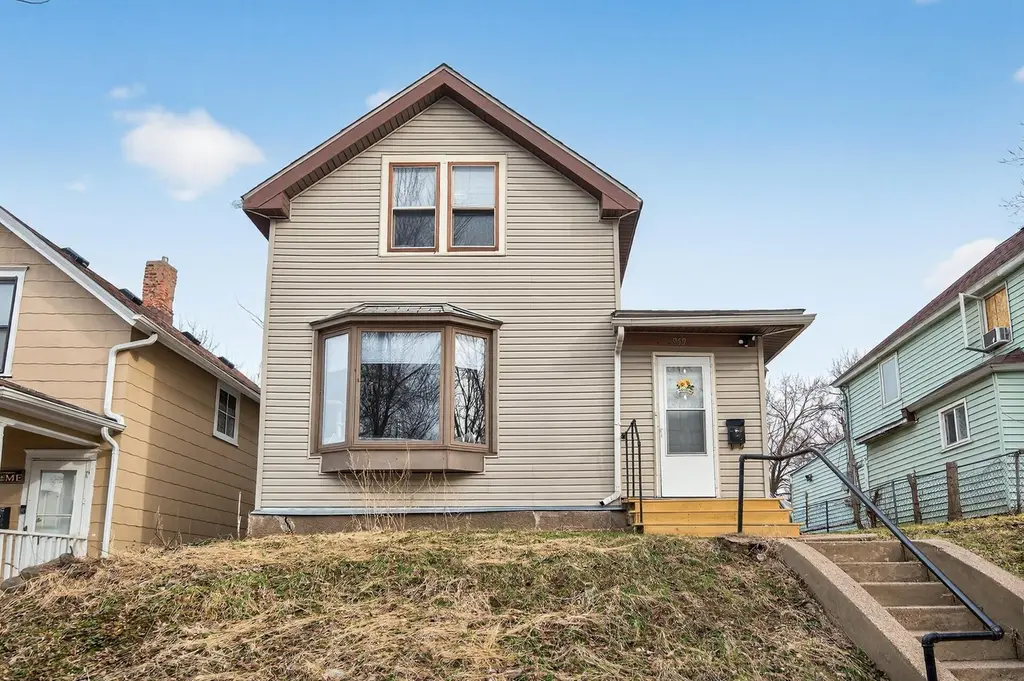
959 Euclid St · St. Paul, MN
Flood risk 1/10 · Minimal
- FEMA flood zone
- X (unshaded)
- Chance of flooding over 30 yrs
- 0.0%
- Est. flood insurance / yr
- $507 – $1,088
Fire risk 1/10 · Minimal
- Est. fire insurance / yr
- $888 – $1,650
Heat risk 2/10 · Minimal
- Hot days now (above 99°F)
- 7 days/yr
- Hot days in 30 yrs
- 13 days/yr
Wind risk 2/10 · Minimal
- Chance of severe wind over 30 yrs
- —
Air-quality risk 2/10 · Minimal
- Unhealthy air days now
- 1 days/yr
- Unhealthy air days in 30 yrs
- 1 days/yr
Risk factors via First Street. Map © Google.
Why this score? — see what drove the B- grade
The composite is a weighted blend of 9 inputs, each scored 0–100. Each bar is that input's sub-score; the figure is the points it added to the 100-point composite (weight × sub-score).
- Cash flow +30.0/30.0
- DSCR +10.0/10.0
- 1% rule +8.6/10.0
- ARV discount +7.5/15.0
- Rent growth +4.1/5.0
- Livability +2.5/5.0
- Condition / age +2.5/5.0
- Schools +2.4/10.0
- Appreciation +0.0/10.0
$205,000
🖨 Deal sheet 📄 Offer letter ✓ Due diligence
Listing remarks MLS
This property is part of a 5-property portfolio, offering 4 single-family homes and 1 duplex in the Payne/Phalen and Dayton’s Bluff neighborhoods. MLS #s available upon request. List price reflects the standalone value; portfolio purchase offers approximately an 8% discount, with a total portfolio price of $1,285,000 and an estimated 10% CAP based on current information. Showings are limited to non-owner occupant buyers only because of a current lease, expiring 11/30/2026. Spacious throughout the main level with a large bathroom and large kitchen. Laundry room located right off kitchen with extra storage room. Large backyard with parking pad. Vinyl plank kitchen flooring, tiled bathroom, and carpet throughout the remainder. New water heater 2025. Newer furnace.
Key facts
- 4,922 sq ft lot
- Garage
- Built 1900
Neighborhood map
What this means for you Summary
Snapshot
- This is a 3-bed/1.0-bath single-family listed at $205k.
Deal economics
- At list price, monthly cash flow is $810 ($10k/yr) — positive.
- The deal already cash-flows at list — no discount required.
- Meets the 1% rule at list price ($3k rent vs $205k).
- Recommended offer: $193k (6.0% below list) — sets the bar for market timing.
Location & tenants
- Location reads: area grade B — affects rentability + tenant quality, not the cash-flow math above.
- St. Paul Public School District (urban): math 21% / reading 33% proficiency, ranked #270 of 301 in MN (top 90%) — low school quality limits family demand, transient renter base, plan for 1-2y turnover; 64% free/reduced lunch — lower-income household profile, screen leases tightly.
- Market conditions: Rents rising fast (+6.3%/yr); 255 active listings in the ZIP; 5 comparable units currently listed for rent nearby; rentals leasing fast (median 2d on market — plan ~1-2 weeks tenant-placement turnaround); 1,202 units permitted in Ramsey County in 2024 (880 in 5+ unit buildings).
- At $2,780/mo this rent would consume 48% of the median local household income ($70k/yr) (locally 2046% of renters already pay >50% of income on rent) — very limited rent-growth headroom before tenants either downsize or default.
Forward outlook
- Local home prices are declining (-3.0%/yr); year-one equity from $1k of loan paydown is wiped out by about $6k of value loss. Plan a longer hold.
- Ramsey County population projected at +27% by 2050 — long-run rental-demand tailwind backs the buy-and-hold thesis.
- At projected returns (-3.0% appreciation + 6.3% rent growth), your $57k cash investment doubles in ~6 years — after that, you're playing with house money.
Negotiation context
- It's been on market 65 days — a 6% lower offer ($193k) is reasonable based on typical stale-listing flexibility.
- 10 sale attempts since 29y ago with the ask held roughly flat each time — persistent listings suggest the price (not the market) is what's stuck; bring a comps-based counter.
- Current owner paid $36k; list at $205k implies a 471% gain — meaningful room to come down on a strong offer.
Risks & watch-outs
- Watch-outs: built in 1900 — expect roof / HVAC / electrical / plumbing capex.
Questions for the listing agent
- It's been on market 65 days. Have you received any prior offers? Is the seller open to a 6% concession, seller financing, or rate buy-down credit?
- Built in 1900 — when were the roof, HVAC, electrical panel, plumbing, and water heater last replaced?
- Why hasn't it sold? Are there any deal-killer items the seller is aware of (foundation, flood, title, zoning, code violations)?
- Is there a deadline driving the sale (1031 exchange, divorce, estate, relocation)? That informs how much negotiation room exists.
- What's the average days-on-market for RENTAL listings here right now (not sales)? A rising rental-DOM trend means longer vacancies and softer asking-rent achievability than the comps imply.
- What's the recent tenant-quality profile in this submarket — average credit score on applications, eviction rate, late-payment / NSF rate, and stable-employment percentage? A property-management company in the area should have these aggregated.
- How much new for-sale + rental construction is in the pipeline within 1–3 miles? Heavy new supply typically softens prices + rents 12–24 months out; constrained supply supports both.
Investment metrics
- 1% rule
- 1.36% ✓
- Cap rate
- 11.04%
- Cash-on-cash
- 16.94%
- DSCR
- 1.75
- GRM
- 6.1
CMA / ARV
No comps found within radius.
Projected returns pro-forma
-3.0% appreciation · 6.26% rent growth · sell at horizon
- IRR
- 11.8%
- Equity multiple
- 1.48×
- Total profit
- $27,828
- Equity at exit
- $30,566
- IRR
- 23.2%
- Equity multiple
- 3.30×
- Total profit
- $132,095
- Equity at exit
- $17,725
Cash invested: $57,400 (down + closing). Projections, not guarantees.
Landlord ↔ Tenant lean methodology
- Overall (STATE)
- 46 Balanced
- State Minnesota
- 46 Balanced · D+2
- County
- — inherits STATE
- City
- — inherits STATE
ZIP-level market 55106
- Rents YoY
- 6.3%
- Active inventory
- 255
- Price-to-rent
- 6.1×
Monthly cashflow live
- Estimated rent
- $2,780 high interval (Pro) →
- Mortgage (P&I)
- −$1,075
- Tax from tax record
- −$225 /mo · $2,702/yr
- Insurance
- −$85
- HOA
- −$0
- Vacancy / Maint / Mgmt
- −$584
- Net cashflow
- $810
Break-even live
UW: 25.0% down · 7.5% · 30yr · 1.5% tax · 5.0% vac · 8.0% maint · 8.0% mgmt
Financing live
Cash to close
- Down payment
- $51,250
- Closing costs
- $6,150
- Reserves months
- —
- Total cash needed
- —
Loan-product check · same deal, 3 products live
Conventional
25% down · 7.5% · 30yr
- Down + closing
- —
- Monthly P&I
- —
- Monthly cashflow
- —
- DSCR
- —
- Eligible?
- —
Personal DTI + credit; lowest rate.
DSCR
20% down · 8.5% · 30yr
- Down + closing
- —
- Monthly P&I
- —
- Monthly cashflow
- —
- DSCR
- —
- Eligible?
- —
No personal income docs; deal must DSCR.
Hard money
10% down · 12.0% · 12mo
- Down + closing
- —
- Monthly P&I
- —
- Monthly cashflow
- —
- DSCR
- —
- Eligible?
- —
Short-term bridge; refi at stabilization.
Rent comps 5 comps
| Address | Beds | Baths | Sqft | Rent | $/sqft | DOM | Units | Dist |
|---|---|---|---|---|---|---|---|---|
| 330 9th St E St Paul, MN | 1.0–2.0 | 1.0 | 978 | $2,495 | $2.55 | 3d | 3 | 1.35mi |
| 250 6th St E St Paul, MN | 2.0 | 1.0–2.0 | 980 | $2,868 | $2.93 | 2d | 16 | 1.38mi |
| 240 5th St E St Paul, MN | 2.0 | 1.0–2.0 | 949 | $2,770 | $2.92 | 2d | 10 | 1.40mi |
| 180 E Kellogg Blvd St Paul, MN | 3.0 | 1.0–2.5 | 1436 | $4,595 | $3.20 | 1d | 22 | 1.45mi |
| 333 Sibley St Saint Paul, MN | 3.0 | 1.0–2.0 | 1358 | $3,269 | $2.41 | 10d | 10 | 1.46mi |
Listing history 34 events
-
2026-06-18days on market $205,000 Active 65 DOM
-
2026-06-17days on market $205,000 Active 64 DOM
-
2026-06-16days on market $205,000 Active 63 DOM
-
2026-06-15days on market $205,000 Active 62 DOM
-
2026-06-13days on market $205,000 Active 60 DOM
-
2026-06-09days on market $205,000 Active 56 DOM
-
2026-06-08days on market $205,000 Active 55 DOM
-
2026-06-07days on market $205,000 Active 54 DOM
-
2026-06-04days on market $205,000 Active 51 DOM
-
2026-06-03days on market $205,000 Active 50 DOM
-
2026-06-02days on market $205,000 Active 49 DOM
-
2026-06-01days on market $205,000 Active 48 DOM
-
2026-05-31days on market $205,000 Active 47 DOM
-
2026-04-14$205,000 Active 778-char remark
Show marketing remark (778 chars)
This property is part of a 5-property portfolio, offering 4 single-family homes and 1 duplex in the Payne/Phalen and Dayton’s Bluff neighborhoods. MLS #s available upon request. List price reflects the standalone value; portfolio purchase offers approximately an 8% discount, with a total portfolio price of $1,285,000 and an estimated 10% CAP based on current information. Showings are limited to non-owner occupant buyers only because of a current lease, expiring 11/30/2026. Spacious throughout the main level with a large bathroom and large kitchen. Laundry room located right off kitchen with extra storage room. Large backyard with parking pad. Vinyl plank kitchen flooring, tiled bathroom, and carpet throughout the remainder. New water heater 2025. Newer furnace.
-
2025-11-08historical $1,586
-
2025-10-14$1,586
-
2025-09-11historical $1,586
-
2025-08-22$1,586
-
2024-07-24historical $1,539
-
2024-07-14$1,539
-
2023-07-20historical
-
2023-07-16
-
2016-09-12historical
-
2016-08-01$99,900 Active
-
2008-07-17historical
-
2008-07-16soldstatus $35,900
-
2007-09-14$35,900
-
2007-09-12historical
-
2007-04-27$85,500
-
2006-06-16historical
-
2005-12-16$165,000
-
1998-06-23soldstatus $52,000
-
1997-09-17historical
-
1997-02-11$59,900
ⓘ Source: listings_history table (triggers on properties + properties_extension) + one-shot
backfill from property_details.listing_events for pre-trigger history.
Tax reassessment forecast MN · Partial reset (capped growth)
- Current annual tax
- $2,702 · $225/mo
- Projected year-2 tax
- $2,702 · $225/mo
- Expected delta
- $0/yr ($0/mo · 0.0%)
ⓘ Screening estimate from a state-policy table — verify with the county assessor before closing.
Climate risk First Street
- Flood 1/10 Low FEMA zone X (unshaded) · 0% chance over 30 yrs
- Wildfire 1/10 Low
- Heat 2/10 Low 7 d/yr ≥99°F today · 13 d/yr by 30 yrs out
- Wind 2/10 Low
- Air quality 2/10 Low 1 unhealthy d/yr today · 1 by 30 yrs out
Nearby sold comps map
Loading sold comps map…
Walkable amenities ~0.75 mi
Loading nearby amenities…
Taxation est. · year 1
- Rental income
- $33,356
- − Mortgage interest
- −$11,483
- − Property taxes
- −$2,702
- − Insurance
- −$1,025
- − Repairs & maintenance
- −$2,668
- − Management
- −$2,668
- − Depreciation
- −$5,964
- Taxable income
- $6,845
- Est. tax owed @ 24.0%
- −$1,643
- After-tax cash flow
- $8,081/yr
For passive investors: Depreciation is non-cash, so a rental often shows a tax loss while cash-flowing — sheltering income. Rental losses are passive: they offset passive income freely, and up to $25,000/yr can offset ordinary (W-2) income if you actively participate and your MAGI is under $100k (phasing out to $0 by $150k); unused losses carry forward. On sale, claimed depreciation is recaptured at up to 25%, and gains may owe capital-gains tax (a 1031 exchange can defer both). Figures are a year-1 estimate at your 24.0% rate — not tax advice; consult a CPA.
Schools (NCES district)
- District
- St. Paul Public School District
- NCES district ID
- 2733840
- Math proficiency
- 21% ▼ -11.00%
- Reading proficiency
- 33% ▼ -7.00%
- Median HH income
- $48,316
- Composite
- 23.51/100
- National rank
- #7868
- State rank
- #270 of 301 in MN
Livability — St. Paul
No livability data for this city. (Only ~50 U.S. cities are tracked.)
Census & demographics
- Census place
- St. Paul, MN
- County
- Ramsey County · 542,837 people
- City population
- 280,599
- Metro
- Minneapolis-St. Paul-Bloomington, MN-WI
- Population (ZIP)
- 56,708
- Household income
- $70,187
- Rent vs Own
- Severe rent burden
- 2046.0
Population outlook (Ramsey County) Hauer SSP2
- Today (2025)
- 603,431 people
- By 2030
- 636,459 · +5.5%
- By 2040
- 700,596 · +16.1%
- By 2050
- 765,819 · +26.9%
- By 2075
- 929,297 · +54.0%
- By 2100
- 1,053,924 · +74.7%
Race, ethnicity, and origin ACS 2023
- Neighborhood character
- Highly diverse neighborhood (Simpson 0.75)
- Race & ethnicity
- Asian 34% White 32% Black 15% Hispanic / Latino 11% Two or more races 10%
- Hispanic origin (detail)
- Mexican 8%
- Common ancestry
- Portuguese 4% Lithuanian 2% Romanian 2%
- Foreign-born
- 25% · Canada, Philippines, Vietnam
- Languages at home
- 59% English-only · Other Asian/Pacific 27% Spanish 9% French/Haitian/Cajun 1%
Political lean MEDSL · Ramsey
- 2024 margin
- Solid D (+43.3) · D 70.5% · R 27.2% · Other 2.3%
- 2008→2024 swing
- +9.4pp toward D · 2008: 33.9pp · 2024: 43.3pp
- All cycles
- 2024: D+43.3 2020: D+45.4 2016: D+39.4 2012: D+35.3 2008: D+33.9
Not yet ingested
- Civics
- —
Market trends
- HPI YoY
- ▼ -239.48%
- Current HPI
- 288.7205
- Rent YoY
- ▲ 6.26%
- Metro
- Minneapolis-St. Paul-Bloomington, MN-WI
- State GDP YoY
- ▲ 2.41%
- F500 in state
- 34
Industry mix (Fortune 500 HQ in MN)
| Industry | F500 HQs | Revenue |
|---|---|---|
| Healthcare | 2 | $407B |
|
||
| Retail | 2 | $150B |
|
||
| Consumer Goods | 2 | $32B |
|
||
| Industrial Machinery | 2 | $6B |
|
||
| Agriculture | 1 | $40B |
|
||
| Healthcare / Medical Devices | 1 | $32B |
|
||
Price history
+242.2% since first listed21 events — show timeline
- 2026-04-14 Listed $205,000 NORTHSTARMLS as Distributed by MLS Grid
- 2025-11-08 Rental Removed $1,586 APPFOLIO
- 2025-10-14 Listed for Rent $1,586 APPFOLIO
- 2025-09-11 Rental Removed $1,586 APPFOLIO
- 2025-08-22 Listed for Rent $1,586 APPFOLIO
- 2024-07-24 Rental Removed $1,539 APPFOLIO
- 2024-07-14 Listed for Rent $1,539 APPFOLIO
- 2023-07-20 Rental Removed — APPFOLIO
- 2023-07-16 Listed for Rent — APPFOLIO
- 2016-09-12 Listing Removed — NORTHSTARMLS as Distributed by MLS Grid
- 2016-08-01 Listed $99,900 NORTHSTARMLS as Distributed by MLS Grid
- 2008-07-17 Listing Removed — NORTHSTARMLS as Distributed by MLS Grid
- 2008-07-16 Sold (MLS) $35,900 NORTHSTARMLS as Distributed by MLS Grid
- 2007-09-14 Listed $35,900 NORTHSTARMLS as Distributed by MLS Grid
- 2007-09-12 Listing Removed — NORTHSTARMLS as Distributed by MLS Grid
- 2007-04-27 Listed $85,500 NORTHSTARMLS as Distributed by MLS Grid
- 2006-06-16 Listing Removed — NORTHSTARMLS as Distributed by MLS Grid
- 2005-12-16 Listed $165,000 NORTHSTARMLS as Distributed by MLS Grid
- 1998-06-23 Sold (MLS) $52,000 NORTHSTARMLS as Distributed by MLS Grid
- 1997-09-17 Listing Removed — NORTHSTARMLS as Distributed by MLS Grid
- 1997-02-11 Listed $59,900 NORTHSTARMLS as Distributed by MLS Grid
Property tax history
+4.8%/yrLatest (2025): $2,702 · +79.7% YoY. Source: county tax records.
Cash-flow waterfall
monthlySold comps — $/sqft
last 12 mo · ≤1 miLoading sold comps…