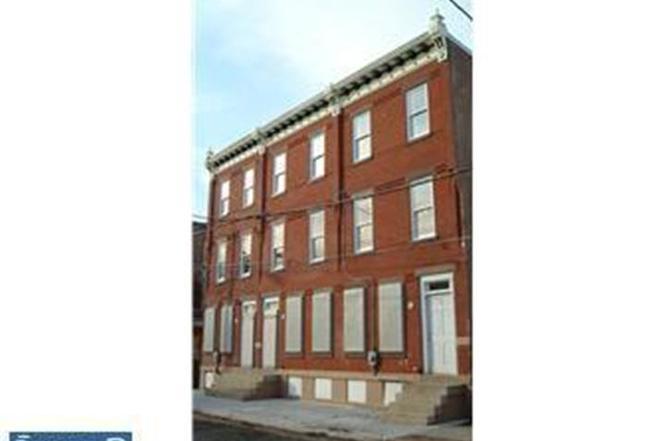
314 Academy St · Trenton, NJ
Flood risk 1/10 · Minimal
- FEMA flood zone
- X (unshaded)
- Chance of flooding over 30 yrs
- 0.0%
- Est. flood insurance / yr
- $507 – $1,088
Fire risk 1/10 · Minimal
- Est. fire insurance / yr
- $526 – $976
Heat risk 6/10 · Moderate
- Hot days now (above 102°F)
- 7 days/yr
- Hot days in 30 yrs
- 15 days/yr
Wind risk 6/10 · Moderate
- Chance of severe wind over 30 yrs
- 27.0%
Air-quality risk 5/10 · Moderate
- Unhealthy air days now
- 6 days/yr
- Unhealthy air days in 30 yrs
- 8 days/yr
Risk factors via First Street. Map © Google.
Why this score? — see what drove the C+ grade
The composite is a weighted blend of 9 inputs, each scored 0–100. Each bar is that input's sub-score; the figure is the points it added to the 100-point composite (weight × sub-score).
- Cash flow +24.7/30.0
- ARV discount +14.9/15.0
- DSCR +8.0/10.0
- 1% rule +5.8/10.0
- Livability +3.8/5.0
- Rent growth +3.2/5.0
- Condition / age +2.5/5.0
- Schools +0.7/10.0
- Appreciation +0.0/10.0
$234,900
🖨 Deal sheet 📄 Offer letter ✓ Due diligence
Listing remarks MLS
Luxurios 4 bedroom and 2 bathrooms, with brick exterior property and extremely energy efficient. It has been completely renovated, New windows, new bamboo hardwood flooring, new ceramic tile flooring, new freshly painted sheet rock, new central air and gas heating system, new duct work, new electrical, and new energy star appliances. Also a sprinkler system and insulating systems are installed.
Key facts
- Built 1900
- Listed 180 days
Property features AI
Exterior
- Parking: On-street parking
- Utilities: Public water; Public sewer; Natural gas heating fuel
- Home design: Semi-detached property; Built in year per assessor
- Construction: Brick construction; Brick/mortar foundation; Building winterized
- Exterior features: Lot dimensions approximately 15.7 x 83 ft; No tidal water
Interior
- Bedrooms: Three bedrooms on the first upper level; One bedroom on the second upper level
- Bathrooms: Two full bathrooms (one on the first upper level, one on the second upper level)
- Heating & cooling: Forced air heating; Natural gas hot water
- Interior features: Full basement
Neighborhood map
What this means for you Summary
Snapshot
- This is a 4-bed/2.0-bath townhouse listed at $235k.
Deal economics
- At list price, monthly cash flow is $492 ($6k/yr) — positive.
- The deal already cash-flows at list — no discount required.
- Meets the 1% rule at list price ($3k rent vs $235k).
- Recommended offer: $207k (12.0% below list) — sets the bar for market timing.
- Cap rate 8.8% vs local median 6.3% in Trenton — top-decile yield for the area; either an underpriced asset or a hidden risk that comps aren't pricing in. Stress-test before assuming the spread holds.
Location & tenants
- Location reads 76/100 on livability (#133 in NJ, #3,533 nationally) — a middle-class / working-renter tenant base. Strengths: amenities A+, commute A+, health & safety A+; Watch: schools F, crime F, employment F.
- Trenton Public School District (urban): math 2% / reading 16% proficiency, ranked #471 of 472 in NJ (top 100%) — low school quality limits family demand, transient renter base, plan for 1-2y turnover; 80% free/reduced lunch — lower-income household profile, screen leases tightly.
- Market conditions: Rents rising (+2.6%/yr); 144 active listings in the ZIP; 30 comparable units currently listed for rent nearby; rentals leasing fast (median 14d on market — plan ~1-2 weeks tenant-placement turnaround); 2,256 units permitted in Mercer County in 2024 (1,303 in 5+ unit buildings).
- At $2,527/mo this rent would consume 60% of the median local household income ($50k/yr) (locally 2116% of renters already pay >50% of income on rent) — very limited rent-growth headroom before tenants either downsize or default.
Forward outlook
- Local home prices are declining (-3.0%/yr); year-one equity from $2k of loan paydown is wiped out by about $7k of value loss. Plan a longer hold.
- Mercer County population projected at +4% by 2050 — modest demand growth; plan on rents tracking national, not racing it.
Negotiation context
- It's been on market 180 days — a 12% lower offer ($207k) is reasonable based on typical stale-listing flexibility.
- 8 sale attempts since 17y ago with the ask held roughly flat each time — persistent listings suggest the price (not the market) is what's stuck; bring a comps-based counter.
- Current owner paid $85k; list at $235k implies a 176% gain — meaningful room to come down on a strong offer.
Risks & watch-outs
- Watch-outs: built in 1900 — expect roof / HVAC / electrical / plumbing capex.
- Climate carrying-cost: major wind risk, 27% chance of damaging wind over 30y; extreme-heat days projected 7→15/yr by 2055 (HVAC capex compounding) — expect insurance premiums to compound above CPI over the hold.
Questions for the listing agent
- It's been on market 180 days. Have you received any prior offers? Is the seller open to a 12% concession, seller financing, or rate buy-down credit?
- Built in 1900 — when were the roof, HVAC, electrical panel, plumbing, and water heater last replaced?
- Why hasn't it sold? Are there any deal-killer items the seller is aware of (foundation, flood, title, zoning, code violations)?
- Is there a deadline driving the sale (1031 exchange, divorce, estate, relocation)? That informs how much negotiation room exists.
- Schools are F-rated, which usually means shorter tenancies and higher turnover. Who's the typical renter profile here, and what's been the actual vacancy rate?
- Crime grade is F in this area — have there been break-ins, vandalism, or insurance claims at this property in the last 3 years? What carrier currently insures it and at what premium?
- What's the average days-on-market for RENTAL listings here right now (not sales)? A rising rental-DOM trend means longer vacancies and softer asking-rent achievability than the comps imply.
- What's the recent tenant-quality profile in this submarket — average credit score on applications, eviction rate, late-payment / NSF rate, and stable-employment percentage? A property-management company in the area should have these aggregated.
- How much new for-sale + rental construction is in the pipeline within 1–3 miles? Heavy new supply typically softens prices + rents 12–24 months out; constrained supply supports both.
Investment metrics
- 1% rule
- 1.08% ✓
- Cap rate
- 8.81%
- Cash-on-cash
- 8.98%
- DSCR
- 1.40
- GRM
- 7.7
CMA / ARV
- ARV (on-the-fly)
- $280,784
- Comps found
- 12
Show comp detail 12 sales within ~0.75 mi
| Address | Dist | Beds/Ba | Sqft | Sold | Price | $/sf | Match |
|---|---|---|---|---|---|---|---|
| 317 Academy St | 0.02mi | 4/3.0 | 1,938 (+11%) | 5mo | $215,000 | $111 | 72 |
| 412 Market St | 0.44mi | 5/2.0 (+1) | 1,790 (+3%) | 3mo | $249,000 | $139 | 68 |
| 316 N Broad St | 0.26mi | 3/1.5 (-1) | 1,624 (-7%) | 8mo | $262,000 | $161 | 63 |
| 257 Jackson St | 0.56mi | 4/1.0 | 1,749 (+0%) | 9mo | $285,000 | $163 | 62 |
| 117 Jackson St | 0.42mi | 5/1.0 (+1) | 1,810 (+4%) | 7mo | $245,000 | $135 | 59 |
| 350 S Broad St #307 | 0.55mi | 3/2.0 (-1) | 1,867 (+7%) | 5mo | $275,000 | $147 | 53 |
| 46 Louise Ln | 0.70mi | 3/2.5 (-1) | 1,672 (-4%) | 2mo | $307,000 | $184 | 52 |
| 27 Tyler St | 0.59mi | 4/1.0 | 1,528 (-12%) | 3mo | $290,000 | $190 | 45 |
| 137 Jackson St | 0.44mi | 3/3.5 (-1) | 1,998 (+15%) | 2mo | $330,000 | $165 | 43 |
| 108 Chambers St | 0.73mi | 4/2.0 | 1,488 (-15%) | 2mo | $200,000 | $134 | 39 |
| 106 Chambers St | 0.73mi | 4/2.0 | 1,488 (-15%) | 3mo | $200,000 | $134 | 39 |
| 145 Jackson St | 0.45mi | 3/3.5 (-1) | 1,998 (+15%) | 10mo | $325,000 | $163 | 35 |
Match score weights: distance 35% · size 25% · config 20% · recency 20%. Top-matched comps best support the ARV.
Projected returns pro-forma
-3.0% appreciation · 2.6% rent growth · sell at horizon
- IRR
- -3.2%
- Equity multiple
- 0.88×
- Total profit
- $-7,760
- Equity at exit
- $35,024
- IRR
- 6.1%
- Equity multiple
- 1.45×
- Total profit
- $29,346
- Equity at exit
- $20,310
Cash invested: $65,772 (down + closing). Projections, not guarantees.
Landlord ↔ Tenant lean methodology
- Overall (STATE)
- 21 Tenant-Leaning
- State New Jersey
- 21 Tenant-Leaning · D+6
- County
- — inherits STATE
- City
- — inherits STATE
ZIP-level market 08618
- Rents YoY
- 2.6%
- Active inventory
- 144
- Price-to-rent
- 7.7×
Monthly cashflow live
- Estimated rent
- $2,527 high interval (Pro) →
- Mortgage (P&I)
- −$1,232
- Tax from tax record
- −$174 /mo · $2,088/yr
- Insurance
- −$98
- HOA
- −$0
- Vacancy / Maint / Mgmt
- −$531
- Net cashflow
- $492
Break-even live
UW: 25.0% down · 7.5% · 30yr · 1.5% tax · 5.0% vac · 8.0% maint · 8.0% mgmt
Financing live
Cash to close
- Down payment
- $58,725
- Closing costs
- $7,047
- Reserves months
- —
- Total cash needed
- —
Loan-product check · same deal, 3 products live
Conventional
25% down · 7.5% · 30yr
- Down + closing
- —
- Monthly P&I
- —
- Monthly cashflow
- —
- DSCR
- —
- Eligible?
- —
Personal DTI + credit; lowest rate.
DSCR
20% down · 8.5% · 30yr
- Down + closing
- —
- Monthly P&I
- —
- Monthly cashflow
- —
- DSCR
- —
- Eligible?
- —
No personal income docs; deal must DSCR.
Hard money
10% down · 12.0% · 12mo
- Down + closing
- —
- Monthly P&I
- —
- Monthly cashflow
- —
- DSCR
- —
- Eligible?
- —
Short-term bridge; refi at stabilization.
Rent comps 30 comps
| Address | Beds | Baths | Sqft | Rent | $/sqft | DOM | Units | Dist |
|---|---|---|---|---|---|---|---|---|
| 134 Old Rose St Trenton, NJ | 4.0 | 2.0 | 1212 | $2,300 | $1.90 | 21d | 1 | 0.30mi |
| 21 Bellevue Ave Trenton, NJ | 3.0 | 2.0 | 1740 | $2,400 | $1.38 | 43d | 1 | 0.47mi |
| 73 Bellevue Ave Trenton, NJ | 4.0 | 2.0 | 1950 | $2,400 | $1.23 | 13d | 1 | 0.56mi |
| 130 W Ingham Ave Trenton, NJ | 4.0 | 1.0 | 1126 | $2,000 | $1.78 | 13d | 1 | 0.67mi |
| 311 Calhoun St Trenton, NJ | 4.0 | 1.0 | 1516 | $2,400 | $1.58 | 43d | 1 | 0.67mi |
| 234 Walnut Ave Trenton, NJ | 4.0 | 1.0 | 1480 | $2,200 | $1.49 | 21d | 1 | 0.75mi |
| 24 New Trent St Trenton, NJ | 3.0 | 2.0 | 1336 | $2,350 | $1.76 | 13d | 1 | 0.78mi |
| 186 Passaic St Trenton, NJ | 3.0 | 2.0 | 1064 | $2,400 | $2.26 | 4d | 1 | 0.86mi |
| 319 Rutherford Ave Trenton, NJ | 4.0 | 2.0 | 1100 | $2,200 | $2.00 | 21d | 1 | 0.86mi |
| 311 Spring St Trenton, NJ | 3.0 | 1.0 | 1200 | $2,200 | $1.83 | 13d | 1 | 0.89mi |
| 510 W Hanover St Trenton, NJ | 5.0 | 1.0 | 1200 | $2,200 | $1.83 | 13d | 1 | 0.90mi |
| 117 Park Ave Morrisville, PA | 3.0 | 2.0 | 1396 | $3,200 | $2.29 | 12d | 1 | 0.97mi |
| 635 Chambers St Trenton, NJ | 4.0 | 2.0 | 1312 | $2,500 | $1.91 | 13d | 1 | 1.03mi |
| 1314 Princeton Ave Trenton, NJ | 4.0 | 1.0 | 1092 | $2,400 | $2.20 | 13d | 1 | 1.08mi |
| 239 Ardmore Ave Trenton, NJ | 4.0 | 2.0 | 1665 | $2,750 | $1.65 | 21d | 1 | 1.11mi |
| 121 Columbus Ave Trenton, NJ | 3.0 | 1.0 | 1050 | $1,900 | $1.81 | 21d | 1 | 1.16mi |
| 600 Artisan St Trenton, NJ | 3.0 | 2.0 | 1392 | $2,650 | $1.90 | 12d | 3 | 1.20mi |
| 600 Artisan St Unit 126 Trenton, NJ | 3.0 | 2.0 | 1392 | $2,650 | $1.90 | 20d | 1 | 1.20mi |
| 34 E Hendrickson Ave Morrisville, PA | 3.0 | 1.0 | 1360 | $2,650 | $1.95 | 43d | 1 | 1.21mi |
| 1100 Prospect St Unit 1 Ewing Township, NJ | 3.0 | 1.0 | 1100 | $2,000 | $1.82 | 21d | 1 | 1.22mi |
| 510 N Hermitage Ave Trenton, NJ | 5.0 | 1.5 | 1316 | $2,500 | $1.90 | 12d | 1 | 1.27mi |
| 331 Ellis Ave Trenton, NJ | 3.0 | 1.0 | 1190 | $2,275 | $1.91 | 21d | 1 | 1.29mi |
| 547 Centre St Trenton, NJ | 3.0 | 1.0 | 1060 | $1,850 | $1.75 | 21d | 1 | 1.31mi |
| 649 W State St Trenton, NJ | 5.0 | 2.0 | 1870 | $2,900 | $1.55 | 12d | 1 | 1.36mi |
| 219 Woodlawn Ave Trenton, NJ | 3.0 | 1.0 | 1456 | $2,355 | $1.62 | 13d | 1 | 1.37mi |
| 130 Harper Ave Morrisville, PA | 3.0 | 2.5 | 1276 | $3,500 | $2.74 | 12d | 1 | 1.38mi |
| 705 Anderson St Trenton, NJ | 3.0 | 1.0 | 1132 | $1,800 | $1.59 | 13d | 1 | 1.41mi |
| 1103 Division St Trenton, NJ | 4.0 | 1.0 | 1296 | $2,000 | $1.54 | 21d | 1 | 1.45mi |
| 20 N Overbrook Ave Unit B Trenton, NJ | 3.0 | 1.0 | 1518 | $2,300 | $1.52 | 12d | 1 | 1.45mi |
| 428 Cleveland Ave Trenton, NJ | 4.0 | 2.0 | 1400 | $2,500 | $1.79 | 21d | 1 | 1.50mi |
Listing history 27 events
-
2026-06-14days on market $234,900 Active 180 DOM
-
2026-06-10days on market $234,900 Active 177 DOM
-
2026-06-09days on market $234,900 Active 176 DOM
-
2026-06-08days on market $234,900 Active 175 DOM
-
2026-06-07days on market $234,900 Active 174 DOM
-
2026-06-03days on market $234,900 Active 170 DOM
-
2026-06-02days on market $234,900 Active 169 DOM
-
2026-06-01days on market $234,900 Active 168 DOM
-
2026-05-31days on market $234,900 Active 167 DOM
-
2026-05-30days on market $234,900 Active 166 DOM
-
2025-12-15$234,900 Active
-
2023-08-09historical
-
2023-08-09$125,000 Active
-
2012-08-08soldstatus $85,000 397-char remark
Show marketing remark (397 chars)
Luxurios 4 bedroom and 2 bathrooms, with brick exterior property and extremely energy efficient. It has been completely renovated, New windows, new bamboo hardwood flooring, new ceramic tile flooring, new freshly painted sheet rock, new central air and gas heating system, new duct work, new electrical, and new energy star appliances. Also a sprinkler system and insulating systems are installed.
-
2012-08-08soldstatus $85,000 Sold
Show marketing remark (397 chars)
Luxurios 4 bedroom and 2 bathrooms, with brick exterior property and extremely energy efficient. It has been completely renovated, New windows, new bamboo hardwood flooring, new ceramic tile flooring, new freshly painted sheet rock, new central air and gas heating system, new duct work, new electrical, and new energy star appliances. Also a sprinkler system and insulating systems are installed.
-
2012-04-27historical 397-char remark
Show marketing remark (397 chars)
Luxurios 4 bedroom and 2 bathrooms, with brick exterior property and extremely energy efficient. It has been completely renovated, New windows, new bamboo hardwood flooring, new ceramic tile flooring, new freshly painted sheet rock, new central air and gas heating system, new duct work, new electrical, and new energy star appliances. Also a sprinkler system and insulating systems are installed.
-
2012-03-31historical
-
2012-01-02$102,500 397-char remark
Show marketing remark (397 chars)
Luxurios 4 bedroom and 2 bathrooms, with brick exterior property and extremely energy efficient. It has been completely renovated, New windows, new bamboo hardwood flooring, new ceramic tile flooring, new freshly painted sheet rock, new central air and gas heating system, new duct work, new electrical, and new energy star appliances. Also a sprinkler system and insulating systems are installed.
-
2012-01-02$102,500 Active
Show marketing remark (397 chars)
Luxurios 4 bedroom and 2 bathrooms, with brick exterior property and extremely energy efficient. It has been completely renovated, New windows, new bamboo hardwood flooring, new ceramic tile flooring, new freshly painted sheet rock, new central air and gas heating system, new duct work, new electrical, and new energy star appliances. Also a sprinkler system and insulating systems are installed.
-
2011-12-17historical
-
2011-06-17$102,500
-
2011-04-19historical
-
2010-10-19$102,500
-
2010-09-28historical
-
2010-06-28$102,500
-
2010-05-22historical
-
2009-12-22$102,500
ⓘ Source: listings_history table (triggers on properties + properties_extension) + one-shot
backfill from property_details.listing_events for pre-trigger history.
Tax reassessment forecast NJ · Partial reset (capped growth)
- Current annual tax
- $2,088 · $174/mo
- Projected year-2 tax
- $3,969 · $331/mo
- Expected delta
- +$1,880/yr (+$157/mo · 90.0%)
ⓘ Screening estimate from a state-policy table — verify with the county assessor before closing.
Climate risk First Street
- Flood 1/10 Low FEMA zone X (unshaded) · 0% chance over 30 yrs
- Wildfire 1/10 Low
- Heat 6/10 Major 7 d/yr ≥102°F today · 15 d/yr by 30 yrs out
- Wind 6/10 Major 27% chance of damaging wind over 30 yrs
- Air quality 5/10 Major 6 unhealthy d/yr today · 8 by 30 yrs out
Nearby sold comps map
Loading sold comps map…
Walkable amenities ~0.75 mi
Loading nearby amenities…
Taxation est. · year 1
- Rental income
- $30,319
- − Mortgage interest
- −$13,158
- − Property taxes
- −$2,088
- − Insurance
- −$1,174
- − Repairs & maintenance
- −$2,426
- − Management
- −$2,426
- − Depreciation
- −$6,833
- Taxable income
- $2,214
- Est. tax owed @ 24.0%
- −$531
- After-tax cash flow
- $5,376/yr
For passive investors: Depreciation is non-cash, so a rental often shows a tax loss while cash-flowing — sheltering income. Rental losses are passive: they offset passive income freely, and up to $25,000/yr can offset ordinary (W-2) income if you actively participate and your MAGI is under $100k (phasing out to $0 by $150k); unused losses carry forward. On sale, claimed depreciation is recaptured at up to 25%, and gains may owe capital-gains tax (a 1031 exchange can defer both). Figures are a year-1 estimate at your 24.0% rate — not tax advice; consult a CPA.
Schools (NCES district)
- District
- Trenton Public School District
- NCES district ID
- 3416290
- Math proficiency
- 2% ▼ -8.00%
- Reading proficiency
- 16% ▼ -4.00%
- Median HH income
- $35,078
- Composite
- 7.31/100
- National rank
- #9956
- State rank
- #471 of 472 in NJ
Livability — Trenton
- Score
- 76/100
- State rank
- #133
- US rank
- #3533
Category grades
Schools grade is shown separately in the Schools card above.
Census & demographics
- Census place
- Trenton, NJ
- County
- Mercer County · 327,655 people
- City population
- 177,819
- Metro
- Trenton-Princeton, NJ
- Population (ZIP)
- 35,634
- Household income
- $50,390
- Rent vs Own
- Severe rent burden
- 2116.0
Population outlook (Mercer County) Hauer SSP2
- Today (2025)
- 381,395 people
- By 2030
- 384,640 · +0.9%
- By 2040
- 391,431 · +2.6%
- By 2050
- 397,845 · +4.3%
- By 2075
- 417,281 · +9.4%
- By 2100
- 420,327 · +10.2%
Race, ethnicity, and origin ACS 2023
- Neighborhood character
- Diverse neighborhood (Simpson 0.59)
- Race & ethnicity
- Black 59% White 19% Hispanic / Latino 16% Two or more races 7% Asian 3%
- Hispanic origin (detail)
- Mexican 1% Puerto Rican 6% Dominican 3%
- Common ancestry
- Romanian 2% Hispanic 1% Scotch-Irish 1%
- Foreign-born
- 14% · Canada, China, South Korea
- Languages at home
- 80% English-only · Spanish 10% Other Indo-European 3% Arabic 1%
Political lean MEDSL · Mercer
- 2024 margin
- Solid D (+33.9) · D 65.9% · R 32.0% · Other 2.1%
- 2008→2024 swing
- -2.2pp toward R · 2008: 36.1pp · 2024: 33.9pp
- All cycles
- 2024: D+33.9 2020: D+40.0 2016: D+36.2 2012: D+36.8 2008: D+36.1
Not yet ingested
- Civics
- —
Market trends
- HPI YoY
- ▼ -309.54%
- Current HPI
- 288.6841
- Rent YoY
- ▲ 2.60%
- Metro
- Trenton-Princeton, NJ
- State GDP YoY
- ▲ 2.05%
- F500 in state
- 34
Industry mix (Fortune 500 HQ in NJ)
| Industry | F500 HQs | Revenue |
|---|---|---|
| Consumer Goods | 3 | $31B |
|
||
| Pharmaceuticals | 2 | $153B |
|
||
| Technology | 2 | $21B |
|
||
| Insurance | 2 | $20B |
|
||
| Healthcare | 2 | $19B |
|
||
| Financial Services | 1 | $70B |
|
||
Price history
+129.2% since first listed17 events — show timeline
- 2025-12-15 Listed $234,900 BRIGHT MLS
- 2023-08-09 Listed $125,000 BRIGHT MLS
- 2023-08-09 Listing Removed — BRIGHT MLS
- 2012-08-08 Sold (MLS) $85,000 TREND
- 2012-08-08 Sold (MLS) $85,000 BRIGHT MLS
- 2012-04-27 Listing Removed — BRIGHT MLS
- 2012-03-31 Delisted — TREND
- 2012-01-02 Listed $102,500 TREND
- 2012-01-02 Listed $102,500 BRIGHT MLS
- 2011-12-17 Listing Removed — BRIGHT MLS
- 2011-06-17 Listed $102,500 BRIGHT MLS
- 2011-04-19 Listing Removed — BRIGHT MLS
- 2010-10-19 Listed $102,500 BRIGHT MLS
- 2010-09-28 Listing Removed — BRIGHT MLS
- 2010-06-28 Listed $102,500 BRIGHT MLS
- 2010-05-22 Listing Removed — BRIGHT MLS
- 2009-12-22 Listed $102,500 BRIGHT MLS
Property tax history
+6.3%/yrLatest (2024): $2,088 · +4.2% YoY. Source: county tax records.
Cash-flow waterfall
monthlySold comps — $/sqft
last 12 mo · ≤1 miLoading sold comps…