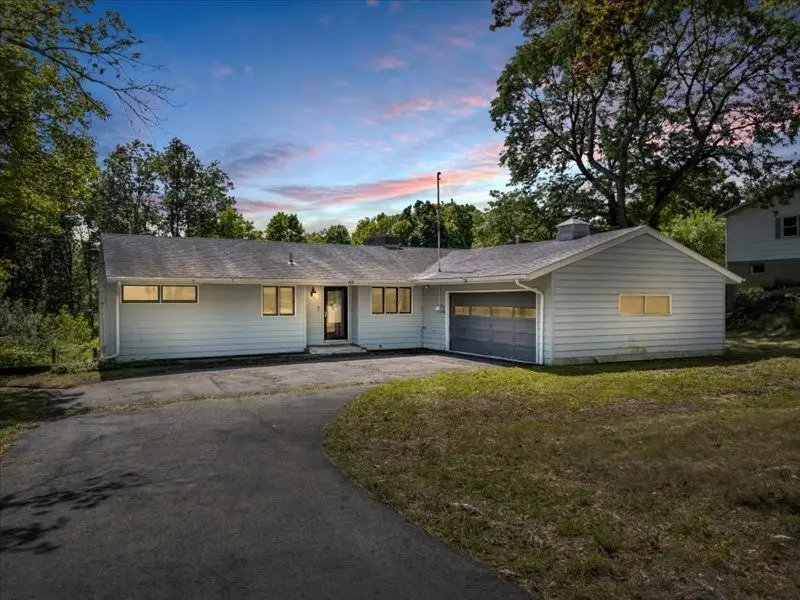
555 Elm Street Ext · Northwest Ithaca, NY
Flood risk 1/10 · Minimal
- FEMA flood zone
- —
- Chance of flooding over 30 yrs
- 0.0%
- Est. flood insurance / yr
- —
Fire risk 2/10 · Minimal
- Est. fire insurance / yr
- $691 – $1,283
Heat risk 3/10 · Minor
- Hot days now (above 94°F)
- 7 days/yr
- Hot days in 30 yrs
- 15 days/yr
Wind risk 1/10 · Minimal
- Chance of severe wind over 30 yrs
- 1.0%
Air-quality risk 2/10 · Minimal
- Unhealthy air days now
- 0 days/yr
- Unhealthy air days in 30 yrs
- 1 days/yr
Risk factors via First Street. Map © Google.
Why this score? — see what drove the D- grade
The composite is a weighted blend of 9 inputs, each scored 0–100. Each bar is that input's sub-score; the figure is the points it added to the 100-point composite (weight × sub-score).
- ARV discount +14.8/15.0
- Cash flow +5.9/30.0
- Schools +5.4/10.0
- Rent growth +3.8/5.0
- Livability +3.5/5.0
- Condition / age +2.5/5.0
- 1% rule +2.2/10.0
- DSCR +0.3/10.0
- Appreciation +0.0/10.0
$349,900
🖨 Deal sheet 📄 Offer letter ✓ Due diligence
Key facts
- 0.81 acre lot
- 2 garage spots
- Pool
Neighborhood map
What this means for you Summary
Snapshot
- This is a 4-bed/2.0-bath single-family listed at $350k.
Deal economics
- At list price, monthly cash flow is $-686 ($-8k/yr) — negative.
- To cash-flow at today's rent, offer at most $229k (34.6% below list).
- To meet the 1% rule (rent ≥ 1% of price), the offer needs to be $253k (27.8% below list).
- Recommended offer: $229k (34.6% below list) — sets the bar for cash-flow.
Location & tenants
- Location reads 69/100 on livability (#488 in NY) — a middle-class / working-renter tenant base. Strengths: health & safety A+, crime A, employment A; Watch: schools D-, amenities F, commute F.
- Ithaca City School District (urban): math 57% / reading 71% proficiency, ranked #195 of 590 in NY (top 33%) — acceptable for families but not a draw, mixed tenant base, ~2y average lease.
- Market conditions: Rents rising fast (+5.2%/yr); 327 active listings in the ZIP; 382 units permitted in Tompkins County in 2024 (208 in 5+ unit buildings).
- This rent runs 42% of the median local income ($71k/yr) — at the standard rent-burdened threshold; future hikes will face affordability resistance.
Forward outlook
- Local home prices are declining (-3.0%/yr); year-one equity from $2k of loan paydown is wiped out by about $10k of value loss. Plan a longer hold.
- Tompkins County population projected at +17% by 2050 — long-run rental-demand tailwind backs the buy-and-hold thesis.
Negotiation context
- It's been on market 95 days — a 9% lower offer ($318k) is reasonable based on typical stale-listing flexibility.
- 5 sale attempts since 5y ago; this cycle's ask has dropped $30k (8%) from the opening price — seller is motivated, your offer sets the floor, not the list.
Risks & watch-outs
- Watch-outs: built in 1959 — expect roof / HVAC / electrical / plumbing capex.
Questions for the listing agent
- What do current leases actually rent for vs. the listed asking? Can we see a recent rent roll and the last 12 months of T-12 income?
- It's been on market 95 days. Have you received any prior offers? Is the seller open to a 35% concession, seller financing, or rate buy-down credit?
- Built in 1959 — when were the roof, HVAC, electrical panel, plumbing, and water heater last replaced?
- Why hasn't it sold? Are there any deal-killer items the seller is aware of (foundation, flood, title, zoning, code violations)?
- Is there a deadline driving the sale (1031 exchange, divorce, estate, relocation)? That informs how much negotiation room exists.
- Schools are D-rated, which usually means shorter tenancies and higher turnover. Who's the typical renter profile here, and what's been the actual vacancy rate?
- The area grade is low — what's the realistic commute time and amenity access for the typical tenant pool here? Any planned neighborhood developments (good or bad) we should know about?
- What's the average days-on-market for RENTAL listings here right now (not sales)? A rising rental-DOM trend means longer vacancies and softer asking-rent achievability than the comps imply.
- What's the recent tenant-quality profile in this submarket — average credit score on applications, eviction rate, late-payment / NSF rate, and stable-employment percentage? A property-management company in the area should have these aggregated.
- How much new for-sale + rental construction is in the pipeline within 1–3 miles? Heavy new supply typically softens prices + rents 12–24 months out; constrained supply supports both.
Investment metrics
- 1% rule
- 0.72% ✗
- Cap rate
- 3.94%
- Cash-on-cash
- -8.40%
- DSCR
- 0.63
- GRM
- 11.5
CMA / ARV
- ARV (median comp)
- $417,149
- List price
- $349,900
- Delta
- -16.12%
- Verdict
- UNDERPRICED
- Comps
- 20 within 1.0 mi
Show comp detail 6 sales within ~0.75 mi
| Address | Dist | Beds/Ba | Sqft | Sold | Price | $/sf | Match |
|---|---|---|---|---|---|---|---|
| 435 Elm St | 0.35mi | 4/2.0 | 1,326 (-1%) | 9mo | $345,000 | $260 | 75 |
| 400 Elm St | 0.48mi | 3/2.0 (-1) | 1,288 (-4%) | 16mo | $235,000 | $182 | 52 |
| 124 Glenside Rd | 0.46mi | 3/1.0 (-1) | 1,378 (+3%) | 21mo | $400,000 | $290 | 47 |
| 407 Richard Pl | 0.70mi | 3/2.0 (-1) | 1,400 (+4%) | 14mo | $410,000 | $293 | 44 |
| 325-27 Warren Pl | 0.70mi | 4/2.5 | 1,500 (+12%) | 3mo | $380,000 | $253 | 43 |
| 295 Hook Pl | 0.65mi | 3/1.0 (-1) | 1,515 (+13%) | 22mo | $415,000 | $274 | 20 |
Match score weights: distance 35% · size 25% · config 20% · recency 20%. Top-matched comps best support the ARV.
Projected returns pro-forma
-3.0% appreciation · 5.22% rent growth · sell at horizon
- IRR
- -28.3%
- Equity multiple
- 0.04×
- Total profit
- $-94,415
- Equity at exit
- $52,171
- IRR
- -19.6%
- Equity multiple
- -0.15×
- Total profit
- $-112,890
- Equity at exit
- $30,253
Cash invested: $97,972 (down + closing). Projections, not guarantees.
Landlord ↔ Tenant lean methodology
- Overall (STATE)
- 15 Strongly Tenant-Friendly
- State New York
- 15 Strongly Tenant-Friendly · D+10
- County
- — inherits STATE
- City
- — inherits STATE
ZIP-level market 14850
- Rents YoY
- 5.2%
- Active inventory
- 327
- Price-to-rent
- 11.5×
Monthly cashflow live
- Estimated rent
- $2,526 medium interval (Pro) →
- Mortgage (P&I)
- −$1,835
- Tax from tax record
- −$700 /mo · $8,405/yr
- Insurance
- −$146
- HOA
- −$0
- Vacancy / Maint / Mgmt
- −$530
- Net cashflow
- $-686
Break-even live
UW: 25.0% down · 7.5% · 30yr · 1.5% tax · 5.0% vac · 8.0% maint · 8.0% mgmt
Financing live
Cash to close
- Down payment
- $87,475
- Closing costs
- $10,497
- Reserves months
- —
- Total cash needed
- —
Loan-product check · same deal, 3 products live
Conventional
25% down · 7.5% · 30yr
- Down + closing
- —
- Monthly P&I
- —
- Monthly cashflow
- —
- DSCR
- —
- Eligible?
- —
Personal DTI + credit; lowest rate.
DSCR
20% down · 8.5% · 30yr
- Down + closing
- —
- Monthly P&I
- —
- Monthly cashflow
- —
- DSCR
- —
- Eligible?
- —
No personal income docs; deal must DSCR.
Hard money
10% down · 12.0% · 12mo
- Down + closing
- —
- Monthly P&I
- —
- Monthly cashflow
- —
- DSCR
- —
- Eligible?
- —
Short-term bridge; refi at stabilization.
Listing history 32 events
-
2026-06-19days on market $349,900 Active 95 DOM
-
2026-06-18days on market $349,900 Active 94 DOM
-
2026-06-17days on market $349,900 Active 93 DOM
-
2026-06-16days on market $349,900 Active 92 DOM
-
2026-06-15days on market $349,900 Active 91 DOM
-
2026-06-14days on market $349,900 Active 89 DOM
-
2026-06-13days on market $349,900 Active 88 DOM
-
2026-06-10days on market $349,900 Active 86 DOM
-
2026-06-09days on market $349,900 Active 85 DOM
-
2026-06-08days on market $349,900 Active 84 DOM
-
2026-06-07days on market $349,900 Active 83 DOM
-
2026-06-05days on market $349,900 Active 80 DOM
-
2026-06-02days on market $349,900 Active 78 DOM
-
2026-06-01days on market $349,900 Active 77 DOM
-
2026-05-31days on market $349,900 Active 76 DOM
-
2026-05-30days on market $349,900 Active 75 DOM
-
2026-05-14price $349,900
-
2026-03-16$379,900 Active
-
2026-03-15historical
-
2025-12-12price $379,900
-
2025-12-11$279,900 Active
-
2025-12-07historical
-
2025-11-07price $389,000
-
2025-10-10price $394,000
-
2025-09-07$399,000 Active
-
2022-01-18soldstatus $304,880
-
2022-01-14soldstatus $296,000
-
2022-01-14soldstatus $296,000
-
2021-07-19$299,900
-
2021-07-19$299,900
-
2012-11-02soldstatus $239,000
-
2007-08-29soldstatus $169,000
ⓘ Source: listings_history table (triggers on properties + properties_extension) + one-shot
backfill from property_details.listing_events for pre-trigger history.
Tax reassessment forecast NY · Partial reset (capped growth)
- Current annual tax
- $8,405 · $700/mo
- Projected year-2 tax
- $8,405 · $700/mo
- Expected delta
- $0/yr ($0/mo · 0.0%)
ⓘ Screening estimate from a state-policy table — verify with the county assessor before closing.
Climate risk First Street
- Flood 1/10 Low 0% chance over 30 yrs
- Wildfire 2/10 Low
- Heat 3/10 Moderate 7 d/yr ≥94°F today · 15 d/yr by 30 yrs out
- Wind 1/10 Low 100% chance of damaging wind over 30 yrs
- Air quality 2/10 Low 0 unhealthy d/yr today · 1 by 30 yrs out
Nearby sold comps map
Loading sold comps map…
Walkable amenities ~0.75 mi
Loading nearby amenities…
Taxation est. · year 1
- Rental income
- $30,308
- − Mortgage interest
- −$19,600
- − Property taxes
- −$8,405
- − Insurance
- −$1,750
- − Repairs & maintenance
- −$2,425
- − Management
- −$2,425
- − Depreciation
- −$10,179
- Taxable loss
- −$14,475
- Est. tax savings @ 24.0%
- +$3,474
- After-tax cash flow
- $-4,756/yr
For passive investors: Depreciation is non-cash, so a rental often shows a tax loss while cash-flowing — sheltering income. Rental losses are passive: they offset passive income freely, and up to $25,000/yr can offset ordinary (W-2) income if you actively participate and your MAGI is under $100k (phasing out to $0 by $150k); unused losses carry forward. On sale, claimed depreciation is recaptured at up to 25%, and gains may owe capital-gains tax (a 1031 exchange can defer both). Figures are a year-1 estimate at your 24.0% rate — not tax advice; consult a CPA.
Schools (NCES district)
- District
- Ithaca City School District
- NCES district ID
- 3615570
- Math proficiency
- 57% ▼ -5.00%
- Reading proficiency
- 71% ▲ 11.00%
- Median HH income
- $46,528
- Composite
- 54.01/100
- National rank
- #1397
- State rank
- #195 of 590 in NY
Livability — Northwest Ithaca
- Score
- 69/100
- State rank
- #488
- US rank
- #8598
Category grades
Schools grade is shown separately in the Schools card above.
Census & demographics
- Census place
- Northwest Ithaca, NY
- County
- Tompkins County · 68,610 people
- Metro
- Ithaca, NY
- Population (ZIP)
- 68,610
- Household income
- $71,445
- Rent vs Own
- Severe rent burden
- 5169.0
Population outlook (Tompkins County) Hauer SSP2
- Today (2025)
- 113,958 people
- By 2030
- 118,774 · +4.2%
- By 2040
- 125,927 · +10.5%
- By 2050
- 133,599 · +17.2%
- By 2075
- 156,759 · +37.6%
- By 2100
- 169,896 · +49.1%
Race, ethnicity, and origin ACS 2023
- Neighborhood character
- Predominantly White (68%)
- Race & ethnicity
- White 68% Asian 13% Hispanic / Latino 8% Two or more races 8% Black 4%
- Hispanic origin (detail)
- Mexican 2% Puerto Rican 2%
- Common ancestry
- Romanian 3% Italian 3% Scotch-Irish 2%
- Foreign-born
- 18% · China, Canada, South Korea
- Languages at home
- 79% English-only · Chinese 5% Spanish 4% Other Indo-European 4%
Political lean MEDSL · Tompkins
- 2024 margin
- Solid D (+50.6) · D 75.3% · R 24.7%
- 2008→2024 swing
- +8.6pp toward D · 2008: 42.1pp · 2024: 50.6pp
- All cycles
- 2024: D+50.6 2020: D+49.2 2016: D+42.1 2012: D+39.8 2008: D+42.1
Not yet ingested
- Civics
- —
Market trends
- HPI YoY
- ▼ -276.59%
- Current HPI
- 389.7215
- Rent YoY
- ▲ 5.22%
- Metro
- Ithaca, NY
- State GDP YoY
- ▲ 2.60%
- F500 in state
- 92
Industry mix (Fortune 500 HQ in NY)
| Industry | F500 HQs | Revenue |
|---|---|---|
| Financial Services | 10 | $950B |
|
||
| Consumer Goods | 9 | $162B |
|
||
| Insurance | 4 | $225B |
|
||
| Telecommunications | 2 | $144B |
|
||
| Pharmaceuticals | 2 | $112B |
|
||
| Media / Entertainment | 2 | $69B |
|
||
Price history
+107.0% since first listed16 events — show timeline
- 2026-05-14 Price Changed $349,900 UNYREIS
- 2026-03-16 Listed $379,900 UNYREIS
- 2026-03-15 Listing Removed — UNYREIS
- 2025-12-12 Price Changed $379,900 UNYREIS
- 2025-12-11 Listed $279,900 UNYREIS
- 2025-12-07 Listing Removed — UNYREIS
- 2025-11-07 Price Changed $389,000 UNYREIS
- 2025-10-10 Price Changed $394,000 UNYREIS
- 2025-09-07 Listed $399,000 UNYREIS
- 2022-01-18 Sold (Public Records) $304,880 Public Records
- 2022-01-14 Sold (MLS) $296,000 IBRMLS
- 2022-01-14 Sold (MLS) $296,000 IBRMLS
- 2021-07-19 Listed $299,900 IBRMLS
- 2021-07-19 Listed $299,900 IBRMLS
- 2012-11-02 Sold (Public Records) $239,000 Public Records
- 2007-08-29 Sold (Public Records) $169,000 Public Records
Property tax history
-2.2%/yrLatest (2025): $8,405 · +2.7% YoY. Source: county tax records.
Cash-flow waterfall
monthlySold comps — $/sqft
last 12 mo · ≤1 miLoading sold comps…