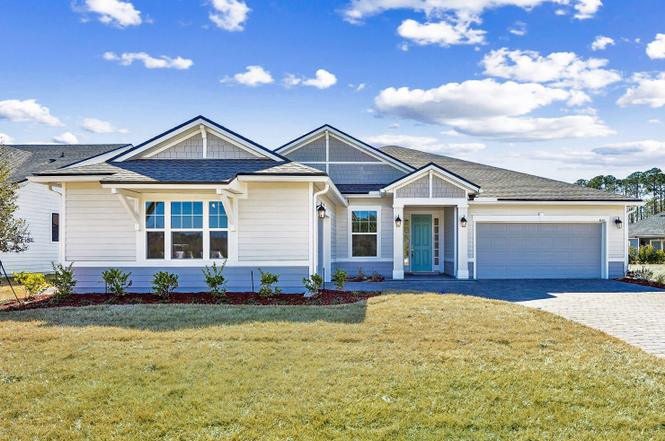
85417 Sandy Ridge Loop · Yulee, FL
Flood risk No data
- FEMA flood zone
- —
- Chance of flooding over 30 yrs
- —
- Est. flood insurance / yr
- —
Fire risk No data
- Est. fire insurance / yr
- —
Heat risk No data
- Hot days now (above threshold)
- —
- Hot days in 30 yrs
- —
Wind risk No data
- Chance of severe wind over 30 yrs
- —
Air-quality risk No data
- Unhealthy air days now
- —
- Unhealthy air days in 30 yrs
- —
Risk factors via First Street. Map © Google.
Why this score? — see what drove the D- grade
The composite is a weighted blend of 9 inputs, each scored 0–100. Each bar is that input's sub-score; the figure is the points it added to the 100-point composite (weight × sub-score).
- Appreciation +10.0/10.0
- ARV discount +7.5/15.0
- Schools +6.0/10.0
- Cash flow +4.2/30.0
- Livability +3.3/5.0
- Rent growth +3.2/5.0
- Condition / age +2.5/5.0
- 1% rule +0.6/10.0
- DSCR +0.0/10.0
$477,900
🖨 Deal sheet 📄 Offer letter ✓ Due diligence
Listing remarks
SEDA NEW HOMES: New construction! Sandy Ridge is a new community ideally located off of Miner Road with a private gated entrance and only 89 homesites. The Preston is an elegant 4-bedroom, 2-bath home that features a desirable courtyard entry and spacious 3-car garage. The open-concept design offers an abundance of natural light, with the kitchen, dining, and gathering areas flowing seamlessly together. There is a large walk-in pantry plus additional storage area for all of your essentials. The owner's suite is thoughtfully positioned for privacy and comfort, while three secondary bedrooms are ideal for family or guests. This rendering is a conceptual drawing only and is not meant to repres
Key facts
- Open-concept design
- Large walk-in pantry
- 3 garage spots
Tags
Property features AI
Finance
- Other: Lot approximately 75' x 120' with paved private road frontage
- HOA & community: Homeowners association (HOA); HOA fee $1,200 annually; Community is gated
Exterior
- Parking: Three-car garage with garage door opener; Three or more parking spaces
- Security: Security system; Gated
- Utilities: Public water; Public sewer
- Home design: Single-story home; Under construction; Planned Unit Development (PUD) zoning; Home warranty included; Builder: SEDA New Homes
- Construction: Vinyl siding; Shingle roof
- Exterior features: Sprinkler/irrigation system; Rear covered porch; Patio; Gated community
Interior
- Kitchen: Dishwasher; Disposal; Microwave; Oven; Stove
- Flooring: Plank flooring; Vinyl flooring
- Bathrooms: 2 full bathrooms
- Heating & cooling: Central heating (electric); Central cooling (electric)
- Interior features: Vinyl window frames
Neighborhood map
What this means for you Summary
Snapshot
- This is a 4-bed/2.0-bath land listed at $478k.
Deal economics
- At list price, monthly cash flow is $-1k ($-16k/yr) — negative.
- To cash-flow at today's rent, offer at most $290k (39.4% below list).
- To meet the 1% rule (rent ≥ 1% of price), the offer needs to be $266k (44.3% below list).
- Recommended offer: $266k (44.3% below list) — sets the bar for 1% rule.
Location & tenants
- Location reads 66/100 on livability (#605 in FL) — a middle-class / working-renter tenant base. Strengths: housing A+, cost of living A-, crime B+; Watch: amenities F, commute F, health & safety F.
- Nassau (town): math 74% / reading 65% proficiency, ranked #4 of 73 in FL (top 6%) — acceptable for families but not a draw, mixed tenant base, ~2y average lease.
- Market conditions: Rents rising (+2.9%/yr); 596 active listings in the ZIP; 6 comparable units currently listed for rent nearby; rentals at typical pace (median 24d on market — plan ~3-4 weeks tenant-placement turnaround); solid renter incomes; 953 units permitted in Nassau County in 2024 (24 in 5+ unit buildings).
- This rent runs 34% of the median local income ($93k/yr) — at the standard rent-burdened threshold; future hikes will face affordability resistance.
Forward outlook
- In year one you build about $51k of equity ($3k loan paydown + $48k appreciation (10.0% local appreciation)).
- Nassau County population projected at +17% by 2050 — long-run rental-demand tailwind backs the buy-and-hold thesis.
- By year 2, paydown + projected appreciation supports a ~$82k cash-out refi (75% LTV) — recoverable capital for the next deal without selling this one.
Negotiation context
- It's been on market 217 days — a 12% lower offer ($421k) is reasonable based on typical stale-listing flexibility.
- Current owner paid $120k; list at $478k implies a 298% gain — meaningful room to come down on a strong offer.
Questions for the listing agent
- What do current leases actually rent for vs. the listed asking? Can we see a recent rent roll and the last 12 months of T-12 income?
- It's been on market 217 days. Have you received any prior offers? Is the seller open to a 44% concession, seller financing, or rate buy-down credit?
- What does the HOA fee cover, when was the last increase, and are there any pending special assessments or reserve-fund shortfalls?
- Why hasn't it sold? Are there any deal-killer items the seller is aware of (foundation, flood, title, zoning, code violations)?
- Is there a deadline driving the sale (1031 exchange, divorce, estate, relocation)? That informs how much negotiation room exists.
- Schools are B-rated — typically a magnet for longer-tenancy family renters. What's the average tenant stay here, and is there a school-zone premium baked into asking?
- The area grade is low — what's the realistic commute time and amenity access for the typical tenant pool here? Any planned neighborhood developments (good or bad) we should know about?
- What's the average days-on-market for RENTAL listings here right now (not sales)? A rising rental-DOM trend means longer vacancies and softer asking-rent achievability than the comps imply.
- What's the recent tenant-quality profile in this submarket — average credit score on applications, eviction rate, late-payment / NSF rate, and stable-employment percentage? A property-management company in the area should have these aggregated.
- How much new for-sale + rental construction is in the pipeline within 1–3 miles? Heavy new supply typically softens prices + rents 12–24 months out; constrained supply supports both.
Investment metrics
- 1% rule
- 0.56% ✗
- Cap rate
- 3.03%
- Cash-on-cash
- -11.66%
- DSCR
- 0.48
- GRM
- 15.0
CMA / ARV
No comps found within radius.
Projected returns pro-forma
10.0% appreciation · 2.88% rent growth · sell at horizon
- IRR
- 16.1%
- Equity multiple
- 2.32×
- Total profit
- $177,276
- Equity at exit
- $430,530
- IRR
- 15.5%
- Equity multiple
- 5.38×
- Total profit
- $586,702
- Equity at exit
- $928,455
Cash invested: $133,812 (down + closing). Projections, not guarantees.
Landlord ↔ Tenant lean methodology
- Overall (STATE)
- 87 Strongly Landlord-Friendly
- State Florida
- 87 Strongly Landlord-Friendly · R+3
- County
- — inherits STATE
- City
- — inherits STATE
ZIP-level market 32097
- Home prices YoY
- 19.5%
- Rents YoY
- 2.9%
- Active inventory
- 596
- Price-to-rent
- 15.0×
Monthly cashflow live
- Estimated rent
- $2,662 high interval (Pro) →
- Mortgage (P&I)
- −$2,506
- Tax est. 1.5%
- −$597 /mo · $7,168/yr
- Insurance
- −$199
- HOA
- −$100
- Vacancy / Maint / Mgmt
- −$559
- Net cashflow
- $-1,300
Break-even live
UW: 25.0% down · 7.5% · 30yr · 1.5% tax · 5.0% vac · 8.0% maint · 8.0% mgmt
Financing live
Cash to close
- Down payment
- $119,475
- Closing costs
- $14,337
- Reserves months
- —
- Total cash needed
- —
Loan-product check · same deal, 3 products live
Conventional
25% down · 7.5% · 30yr
- Down + closing
- —
- Monthly P&I
- —
- Monthly cashflow
- —
- DSCR
- —
- Eligible?
- —
Personal DTI + credit; lowest rate.
DSCR
20% down · 8.5% · 30yr
- Down + closing
- —
- Monthly P&I
- —
- Monthly cashflow
- —
- DSCR
- —
- Eligible?
- —
No personal income docs; deal must DSCR.
Hard money
10% down · 12.0% · 12mo
- Down + closing
- —
- Monthly P&I
- —
- Monthly cashflow
- —
- DSCR
- —
- Eligible?
- —
Short-term bridge; refi at stabilization.
Rent comps 6 comps
| Address | Beds | Baths | Sqft | Rent | $/sqft | DOM | Units | Dist |
|---|---|---|---|---|---|---|---|---|
| 86092 Knotted Oak Way Unit Bedroom 1 Yulee, FL | 4.0 | 3.0 | 2414 | $825 | $0.34 | 17d | 1 | 0.28mi |
| 86467 Moonlit Walk Cir Yulee, FL | 4.0 | 3.0 | 2010 | $3,100 | $1.54 | 23d | 1 | 0.58mi |
| 86040 Hopper Ln Yulee, FL | 3.0 | 2.0 | 1664 | $1,650 | $0.99 | 17d | 1 | 0.94mi |
| 86131 Hopper Ln Yulee, FL | 3.0 | 2.0 | 1664 | $1,650 | $0.99 | 23d | 1 | 0.97mi |
| 86088 Meadowridge Ct Yulee, FL | 4.0 | 3.0 | 2175 | $2,600 | $1.20 | 23d | 1 | 1.06mi |
| 86215 Buggy Ct Yulee, FL | 3.0 | 2.0 | 1675 | $2,295 | $1.37 | 20d | 1 | 1.40mi |
HOA detail
- Monthly dues
- $100 · $1,200/yr
- Likely covers
- security
Listing history 22 events
-
2026-06-18days on market $477,900 Active 217 DOM
-
2026-06-17days on market $477,900 Active 216 DOM
-
2026-06-16pricedays on market $477,900 Active 215 DOM
-
2026-06-15days on market $494,900 Active 214 DOM
-
2026-06-13days on market $494,900 Active 212 DOM
-
2026-06-13days on market $494,900 Active 211 DOM
-
2026-06-09days on market $494,900 Active 208 DOM
-
2026-06-08days on market $494,900 Active 207 DOM
-
2026-06-07days on market $494,900 Active 206 DOM
-
2026-06-05days on market $494,900 Active 203 DOM
-
2026-06-03days on market $494,900 Active 202 DOM
-
2026-06-02days on market $494,900 Active 201 DOM
-
2026-06-01days on market $494,900 Active 200 DOM
-
2026-05-31days on market $494,900 Active 199 DOM
-
2026-04-30price $494,900
-
2026-04-24price $499,900
-
2026-02-09price $515,500
-
2026-02-06price $51,500
-
2026-01-23price $519,500
-
2025-12-05price $521,500
-
2025-11-13$546,500 Active
-
2025-09-23soldstatus $120,000
ⓘ Source: listings_history table (triggers on properties + properties_extension) + one-shot
backfill from property_details.listing_events for pre-trigger history.
Nearby sold comps map
Loading sold comps map…
Walkable amenities ~0.75 mi
Loading nearby amenities…
Taxation est. · year 1
- Rental income
- $31,943
- − Mortgage interest
- −$26,770
- − Property taxes
- −$7,168
- − Insurance
- −$2,390
- − Repairs & maintenance
- −$2,555
- − Management
- −$2,555
- − HOA
- −$1,200
- − Depreciation
- −$13,903
- Taxable loss
- −$24,598
- Est. tax savings @ 24.0%
- +$5,904
- After-tax cash flow
- $-9,693/yr
For passive investors: Depreciation is non-cash, so a rental often shows a tax loss while cash-flowing — sheltering income. Rental losses are passive: they offset passive income freely, and up to $25,000/yr can offset ordinary (W-2) income if you actively participate and your MAGI is under $100k (phasing out to $0 by $150k); unused losses carry forward. On sale, claimed depreciation is recaptured at up to 25%, and gains may owe capital-gains tax (a 1031 exchange can defer both). Figures are a year-1 estimate at your 24.0% rate — not tax advice; consult a CPA.
Schools (NCES district)
- District
- Nassau
- NCES district ID
- 1201350
- Math proficiency
- 74% ▼ -2.00%
- Reading proficiency
- 65% ▼ -2.00%
- Median HH income
- $58,267
- Composite
- 59.79/100
- National rank
- #899
- State rank
- #4 of 73 in FL
Livability — Yulee
- Score
- 66/100
- State rank
- #605
- US rank
- #11615
Category grades
Schools grade is shown separately in the Schools card above.
Census & demographics
- Census place
- Yulee, FL
- County
- Nassau County · 67,729 people
- City population
- 26,700
- Metro
- Jacksonville, FL
- Population (ZIP)
- 26,700
- Household income
- $93,161
- Rent vs Own
- Severe rent burden
- 404.0
Population outlook (Nassau County) Hauer SSP2
- Today (2025)
- 88,419 people
- By 2030
- 92,679 · +4.8%
- By 2040
- 99,257 · +12.3%
- By 2050
- 103,378 · +16.9%
- By 2075
- 109,726 · +24.1%
- By 2100
- 107,006 · +21.0%
Race, ethnicity, and origin ACS 2023
- Neighborhood character
- Predominantly White (75%)
- Race & ethnicity
- White 75% Two or more races 9% Black 9% Hispanic / Latino 8% Asian 1% Native American 1%
- Hispanic origin (detail)
- Mexican 2% Puerto Rican 2%
- Common ancestry
- Lithuanian 4% Italian 3% Romanian 2%
- Foreign-born
- 4% · Canada, Vietnam
- Languages at home
- 93% English-only · Spanish 5% Vietnamese 1%
Political lean MEDSL · Nassau
- 2024 margin
- Solid R (+46.9) · D 26.1% · R 73.1%
- 2008→2024 swing
- -3.1pp toward R · 2008: -43.8pp · 2024: -46.9pp
- All cycles
- 2024: R+46.9 2020: R+45.9 2016: R+50.2 2012: R+48.6 2008: R+43.8
Not yet ingested
- Civics
- —
Market trends
- HPI YoY
- ▲ 49.35%
- Current HPI
- 301.9299
- Rent YoY
- ▲ 2.88%
- Metro
- Jacksonville, FL
- State GDP YoY
- ▲ 3.28%
- F500 in state
- 36
Industry mix (Fortune 500 HQ in FL)
| Industry | F500 HQs | Revenue |
|---|---|---|
| Industrial Technology | 2 | $29B |
|
||
| Insurance | 2 | $17B |
|
||
| Retail | 1 | $60B |
|
||
| Technology Distribution | 1 | $58B |
|
||
| Homebuilding | 1 | $35B |
|
||
| Technology Manufacturing | 1 | $35B |
|
||
Price history
+312.4% since first listed8 events — show timeline
- 2026-04-30 Price Changed $494,900 AINCAR
- 2026-04-24 Price Changed $499,900 AINCAR
- 2026-02-09 Price Changed $515,500 AINCAR
- 2026-02-06 Price Changed $51,500 AINCAR
- 2026-01-23 Price Changed $519,500 AINCAR
- 2025-12-05 Price Changed $521,500 AINCAR
- 2025-11-13 Listed $546,500 AINCAR
- 2025-09-23 Sold (Public Records) $120,000 Public Records
Property tax history
+64.7%/yrLatest (2025): $844 · -1.8% YoY. Source: county tax records.
Cash-flow waterfall
monthlySold comps — $/sqft
last 12 mo · ≤1 miLoading sold comps…