None · Plantation, FL
Flood risk No data
- FEMA flood zone
- —
- Chance of flooding over 30 yrs
- —
- Est. flood insurance / yr
- —
Fire risk No data
- Est. fire insurance / yr
- —
Heat risk No data
- Hot days now (above threshold)
- —
- Hot days in 30 yrs
- —
Wind risk No data
- Chance of severe wind over 30 yrs
- —
Air-quality risk No data
- Unhealthy air days now
- —
- Unhealthy air days in 30 yrs
- —
Risk factors via First Street. Map © Google.
Why this score? — see what drove the F grade
The composite is a weighted blend of 9 inputs, each scored 0–100. Each bar is that input's sub-score; the figure is the points it added to the 100-point composite (weight × sub-score).
- ARV discount +7.5/15.0
- Cash flow +6.4/30.0
- 1% rule +4.9/10.0
- Schools +4.1/10.0
- Livability +4.1/5.0
- Rent growth +2.8/5.0
- Condition / age +2.5/5.0
- DSCR +0.7/10.0
- Appreciation +0.0/10.0
$235,000
🖨 Deal sheet 📄 Offer letter ✓ Due diligence
Key facts
- Pool
- Built 1983
Property features AI
Exterior
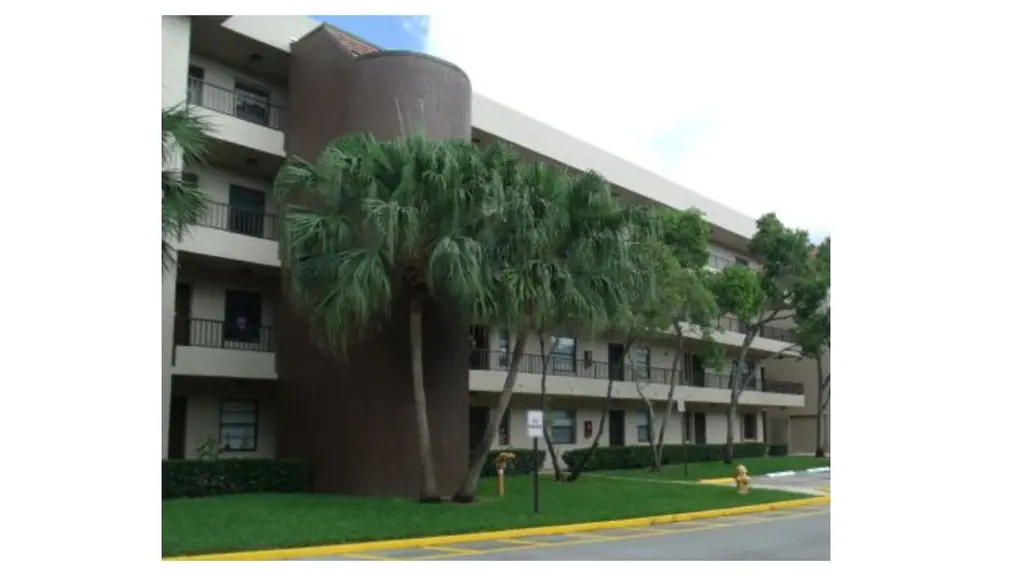
- Home design: Condo in a 4-story building
- Construction: Building has an elevator
- Exterior features: Community pool
Interior
- Bedrooms: 2 bedrooms
- Bathrooms: 2 bathrooms
- Interior features: Condo unit
Neighborhood map
What this means for you Summary
Snapshot
- This is a 2-bed/2.0-bath condo listed at $235k.
Deal economics
- At list price, monthly cash flow is $-402 ($-5k/yr) — negative.
- The deal already cash-flows at list — no discount required.
- To meet the 1% rule (rent ≥ 1% of price), the offer needs to be $233k (0.8% below list).
- Recommended offer: $233k (0.8% below list) — sets the bar for 1% rule.
- Cap rate 4.2% vs local median 3.4% in Plantation — meaningfully above typical; check what's discounted (condition, days-on-market, listing class) to confirm the premium yield is real.
Location & tenants
- Location reads 82/100 on livability (#70 in FL, #1,174 nationally) — a professional / high-income tenant draw. Strengths: commute A+, housing A+, health & safety A+; Watch: amenities C-, cost of living D-.
- Broward (suburban): math 42% / reading 53% proficiency, ranked #46 of 73 in FL (top 63%) — families likely to look elsewhere, expect single-tenant / working-renter base with shorter leases.
- Market conditions: Rents rising (+1.2%/yr); 398 active listings in the ZIP; 40 comparable units currently listed for rent nearby; rentals leasing fast (median 8d on market — plan ~1-2 weeks tenant-placement turnaround); solid renter incomes; 2,111 units permitted in Broward County in 2024 (1,265 in 5+ unit buildings).
- This rent runs 33% of the median local income ($85k/yr) — at the standard rent-burdened threshold; future hikes will face affordability resistance.
Forward outlook
- Local home prices are declining (-3.0%/yr); year-one equity from $2k of loan paydown is wiped out by about $7k of value loss. Plan a longer hold.
- Broward County population projected at +34% by 2050 — long-run rental-demand tailwind backs the buy-and-hold thesis.
Negotiation context
- Only 1 days on market — expect competitive offers; lowballing is unlikely to land.
Risks & watch-outs
- Watch-outs: HOA is 27% of rent.
Questions for the listing agent
- What do current leases actually rent for vs. the listed asking? Can we see a recent rent roll and the last 12 months of T-12 income?
- What does the HOA fee cover, when was the last increase, and are there any pending special assessments or reserve-fund shortfalls?
- Any open or pending special assessments — roof, HVAC, plumbing, elevator, façade? What's the per-unit balance and payoff schedule, and is the seller paying it off at close or rolling it to the buyer?
- Is there a deadline driving the sale (1031 exchange, divorce, estate, relocation)? That informs how much negotiation room exists.
- Schools are B-rated — typically a magnet for longer-tenancy family renters. What's the average tenant stay here, and is there a school-zone premium baked into asking?
- The area grade is low — what's the realistic commute time and amenity access for the typical tenant pool here? Any planned neighborhood developments (good or bad) we should know about?
- What's the average days-on-market for RENTAL listings here right now (not sales)? A rising rental-DOM trend means longer vacancies and softer asking-rent achievability than the comps imply.
- What's the recent tenant-quality profile in this submarket — average credit score on applications, eviction rate, late-payment / NSF rate, and stable-employment percentage? A property-management company in the area should have these aggregated.
- How much new apartment / multifamily construction is in the pipeline within 1–3 miles? Heavy new supply (>2% of stock underway) typically softens rents 12–24 months out; light construction supports rent growth.
Investment metrics
- 1% rule
- 0.99% ✗
- Cap rate
- 4.24%
- Cash-on-cash
- -7.33%
- DSCR
- 0.67
- GRM
- 8.4
CMA / ARV
No comps found within radius.
Projected returns pro-forma
-3.0% appreciation · 1.23% rent growth · sell at horizon
- IRR
- -31.8%
- Equity multiple
- -0.02×
- Total profit
- $-67,355
- Equity at exit
- $35,039
- IRR
- -52.7%
- Equity multiple
- -0.61×
- Total profit
- $-106,094
- Equity at exit
- $20,319
Cash invested: $65,800 (down + closing). Projections, not guarantees.
Landlord ↔ Tenant lean methodology
- Overall (STATE)
- 87 Strongly Landlord-Friendly
- State Florida
- 87 Strongly Landlord-Friendly · R+3
- County
- — inherits STATE
- City
- — inherits STATE
ZIP-level market 33324
- Home prices YoY
- -33.5%
- Rents YoY
- 1.2%
- Active inventory
- 398
- Price-to-rent
- 8.4×
Monthly cashflow live
- Estimated rent
- $2,330 high interval (Pro) →
- Mortgage (P&I)
- −$1,232
- Tax est. 1.5%
- −$294 /mo · $3,525/yr
- Insurance
- −$98
- HOA est. from 1 same-building comp
- −$619
- Vacancy / Maint / Mgmt
- −$489
- Net cashflow
- $-402
Break-even live
UW: 25.0% down · 7.5% · 30yr · 1.5% tax · 5.0% vac · 8.0% maint · 8.0% mgmt
Financing live
Cash to close
- Down payment
- $58,750
- Closing costs
- $7,050
- Reserves months
- —
- Total cash needed
- —
Loan-product check · same deal, 3 products live
Conventional
25% down · 7.5% · 30yr
- Down + closing
- —
- Monthly P&I
- —
- Monthly cashflow
- —
- DSCR
- —
- Eligible?
- —
Personal DTI + credit; lowest rate.
DSCR
20% down · 8.5% · 30yr
- Down + closing
- —
- Monthly P&I
- —
- Monthly cashflow
- —
- DSCR
- —
- Eligible?
- —
No personal income docs; deal must DSCR.
Hard money
10% down · 12.0% · 12mo
- Down + closing
- —
- Monthly P&I
- —
- Monthly cashflow
- —
- DSCR
- —
- Eligible?
- —
Short-term bridge; refi at stabilization.
Rent comps 40 comps
| Address | Beds | Baths | Sqft | Rent | $/sqft | DOM | Units | Dist |
|---|---|---|---|---|---|---|---|---|
| 10451 W Broward Blvd #306 Plantation, FL | 2.0 | 2.0 | 1000 | $2,200 | $2.20 | 1d | 1 | 0.03mi |
| 10401 W Broward Blvd #301 Plantation, FL | 3.0 | 2.0 | 1100 | $2,650 | $2.41 | 24d | 1 | 0.07mi |
| 145 SW 96th Ter Unit 145 Plantation, FL | 2.0 | 1.5 | 1110 | $2,500 | $2.25 | 2d | 1 | 0.67mi |
| 192 SW 96th Ave Unit 192 Plantation, FL | 2.0 | 2.5 | 1110 | $2,600 | $2.34 | 10d | 1 | 0.76mi |
| 10709 Cleary Blvd Plantation, FL | 2.0–3.0 | 2.0 | 1008 | $2,195 | $2.18 | 10d | 2 | 0.80mi |
| 10709 Cleary Blvd Plantation, FL | 2.0–3.0 | 2.0 | 1008 | $2,100 | $2.08 | 7d | 2 | 0.80mi |
| 10709 Cleary Blvd #211 Plantation, FL | 3.0 | 2.0 | 1090 | $2,400 | $2.20 | 24d | 1 | 0.80mi |
| 10717 Cleary Blvd Plantation, FL | 1.0 | 1.0 | 734 | $1,740 | $2.37 | 14d | 2 | 0.83mi |
| 10717 Cleary Blvd #202 Plantation, FL | 1.0 | 1.0 | 734 | $1,780 | $2.43 | 1d | 1 | 0.84mi |
| 10773 Cleary Blvd Plantation, FL | 2.0–3.0 | 2.0 | 1008 | $2,100 | $2.08 | 2d | 2 | 0.85mi |
| 10773 Cleary Blvd #204 Plantation, FL | 2.0 | 2.0 | 926 | $2,100 | $2.27 | 24d | 1 | 0.86mi |
| 9733 NW 7th Cir Plantation, FL | 3.0 | 1.0–2.0 | 1043 | $2,707 | $2.59 | 1d | 29 | 0.88mi |
| 801 NW 108th Ave Plantation, FL | 1.0–3.0 | 1.0–2.5 | 1135 | $2,474 | $2.18 | 3d | 29 | 0.90mi |
| 10733 Cleary Blvd Plantation, FL | 2.0 | 2.0 | 926 | $1,945 | $2.10 | 4d | 2 | 0.91mi |
| 10733 Cleary Blvd Plantation, FL | 2.0–3.0 | 2.0 | 1008 | $1,990 | $1.97 | 20d | 2 | 0.91mi |
| 10749 Cleary Blvd Plantation, FL | 2.0 | 2.0 | 965 | $2,075 | $2.15 | 2d | 2 | 0.91mi |
| 11000 Cameron Ct Davie, FL | 1.0–3.0 | 1.0–2.0 | 1024 | $2,520 | $2.46 | 1d | 26 | 1.00mi |
| 1 Jacaranda Dr #202 Fort Lauderdale, FL | 2.0 | 2.0 | 900 | $1,800 | $2.00 | 16d | 1 | 1.05mi |
| 21 Jacaranda Dr #224 Fort Lauderdale, FL | 2.0 | 2.0 | 900 | $2,499 | $2.78 | 24d | 1 | 1.06mi |
| 11749 Terra Bella Blvd Plantation, FL | 2.0 | 2.0 | 930 | $2,650 | $2.85 | 7d | 1 | 1.08mi |
| 200 Jacaranda Dr Unit B1 Plantation, FL | 1.0 | 1.0 | 810 | $1,900 | $2.35 | 13d | 1 | 1.09mi |
| 250 Jacaranda Dr Plantation, FL | 2.0 | 2.0 | 1015 | $2,300 | $2.27 | 16d | 1 | 1.15mi |
| 250 Jacaranda Dr #608 Plantation, FL | 2.0 | 2.0 | 1015 | $2,250 | $2.22 | 11d | 1 | 1.15mi |
| 250 Jacaranda Dr Plantation, FL | 2.0 | 2.0 | 1015 | $2,275 | $2.24 | 3d | 2 | 1.16mi |
| 704 NW 92nd Ave Plantation, FL | 2.0 | 2.0 | 1097 | $2,400 | $2.19 | 24d | 1 | 1.19mi |
| 704 NW 92nd Ave #704 Plantation, FL | 2.0 | 2.0 | 1097 | $2,350 | $2.14 | 1d | 1 | 1.19mi |
| 759 NW 92nd Ave #759 Plantation, FL | 1.0 | 1.0 | 805 | $1,900 | $2.36 | 10d | 1 | 1.19mi |
| 759 NW 92nd Ave #759 Plantation, FL | 1.0 | 1.0 | 805 | $1,900 | $2.36 | 7d | 1 | 1.19mi |
| 705 NW 91st Ter Plantation, FL | 2.0 | 2.0 | 1097 | $2,400 | $2.19 | 10d | 1 | 1.19mi |
| 729 NW 92nd Ave Plantation, FL | 2.0 | 2.0 | 1097 | $2,300 | $2.10 | 24d | 1 | 1.19mi |
| 708 NW 92nd Ave Plantation, FL | 1.0 | 1.0 | 805 | $1,850 | $2.30 | 7d | 1 | 1.20mi |
| 2641 N Flamingo Rd Plantation, FL | 2.0 | 2.0 | 1102 | $3,175 | $2.88 | 16d | 4 | 1.32mi |
| 2641 N Flamingo Rd Plantation, FL | 2.0 | 2.0 | 1102 | $2,997 | $2.72 | 1d | 3 | 1.32mi |
| 9001 Jacaranda Ln #107 Plantation, FL | 2.0 | 2.0 | 960 | $2,250 | $2.34 | 24d | 1 | 1.33mi |
| 150 SW 91st Ave Plantation, FL | 1.0–3.0 | 1.0–2.0 | 962 | $2,438 | $2.53 | 1d | 19 | 1.34mi |
| 9050 Jacaranda Ln #8 Plantation, FL | 1.0 | 1.0 | 721 | $1,725 | $2.39 | 7d | 1 | 1.36mi |
| 9050 Jacaranda Ln #8 Plantation, FL | 1.0 | 1.0 | 721 | $1,725 | $2.39 | 24d | 1 | 1.36mi |
| 461 NW 87th Rd Plantation, FL | 1.0–2.0 | 1.0–2.0 | 951 | $2,420 | $2.54 | 2d | 8 | 1.39mi |
| 8760 NW 4th St Plantation, FL | 1.0 | 1.0 | 774 | $2,250 | $2.91 | 2d | 11 | 1.40mi |
| 731 N Pine Island Rd Plantation, FL | 1.0–2.0 | 1.5–2.0 | 910 | $2,300 | $2.53 | 7d | 3 | 1.41mi |
HOA detail condo
- Monthly dues
- $0 · $0/yr
- Assessments
- None detected in remarks — confirm with the listing agent.
Listing history 1 events
-
2026-06-18$235,000 Coming Soon 1 DOM
ⓘ Source: listings_history table (triggers on properties + properties_extension) + one-shot
backfill from property_details.listing_events for pre-trigger history.
Nearby sold comps map
Loading sold comps map…
Walkable amenities ~0.75 mi
Loading nearby amenities…
Taxation est. · year 1
- Rental income
- $27,963
- − Mortgage interest
- −$13,164
- − Property taxes
- −$3,525
- − Insurance
- −$1,175
- − Repairs & maintenance
- −$2,237
- − Management
- −$2,237
- − HOA
- −$7,428
- − Depreciation
- −$6,836
- Taxable loss
- −$8,639
- Est. tax savings @ 24.0%
- +$2,073
- After-tax cash flow
- $-2,752/yr
For passive investors: Depreciation is non-cash, so a rental often shows a tax loss while cash-flowing — sheltering income. Rental losses are passive: they offset passive income freely, and up to $25,000/yr can offset ordinary (W-2) income if you actively participate and your MAGI is under $100k (phasing out to $0 by $150k); unused losses carry forward. On sale, claimed depreciation is recaptured at up to 25%, and gains may owe capital-gains tax (a 1031 exchange can defer both). Figures are a year-1 estimate at your 24.0% rate — not tax advice; consult a CPA.
Schools (NCES district)
- District
- Broward
- NCES district ID
- 1200180
- Math proficiency
- 42% ▼ -18.00%
- Reading proficiency
- 53% ▼ -5.00%
- Median HH income
- $52,139
- Composite
- 40.88/100
- National rank
- #3621
- State rank
- #46 of 73 in FL
Livability — Plantation
- Score
- 82/100
- State rank
- #70
- US rank
- #1174
Category grades
Schools grade is shown separately in the Schools card above.
Census & demographics
- Census place
- Plantation, FL
- County
- Broward County · 1,963,430 people
- City population
- 111,690
- Metro
- Miami-Fort Lauderdale-Pompano Beach, FL
- Population (ZIP)
- 50,151
- Household income
- $85,000
- Rent vs Own
- Severe rent burden
- 2923.0
Population outlook (Broward County) Hauer SSP2
- Today (2025)
- 2,207,033 people
- By 2030
- 2,360,704 · +7.0%
- By 2040
- 2,661,208 · +20.6%
- By 2050
- 2,946,698 · +33.5%
- By 2075
- 3,602,273 · +63.2%
- By 2100
- 3,970,984 · +79.9%
Race, ethnicity, and origin ACS 2023
- Neighborhood character
- Diverse neighborhood (Simpson 0.69)
- Race & ethnicity
- White 42% Hispanic / Latino 31% Two or more races 20% Black 16% Asian 6%
- Hispanic origin (detail)
- Mexican 2% Puerto Rican 5% Cuban 4% Dominican 2%
- Common ancestry
- Romanian 3% Italian 3% Hispanic 3%
- Foreign-born
- 31% · Canada, Jamaica, China
- Languages at home
- 60% English-only · Spanish 26% Other Indo-European 4% French/Haitian/Cajun 3%
Political lean MEDSL · Broward
- 2024 margin
- D (+17.0) · D 58.0% · R 41.0%
- 2008→2024 swing
- -17.8pp toward R · 2008: 34.7pp · 2024: 17.0pp
- All cycles
- 2024: D+17.0 2020: D+29.8 2016: D+35.0 2012: D+34.9 2008: D+34.7
Not yet ingested
- Civics
- —
Market trends
- HPI YoY
- ▼ -160.16%
- Current HPI
- 317.8685
- Rent YoY
- ▲ 1.23%
- Metro
- Miami-Fort Lauderdale-Pompano Beach, FL
- State GDP YoY
- ▲ 3.28%
- F500 in state
- 36
Industry mix (Fortune 500 HQ in FL)
| Industry | F500 HQs | Revenue |
|---|---|---|
| Industrial Technology | 2 | $29B |
|
||
| Insurance | 2 | $17B |
|
||
| Retail | 1 | $60B |
|
||
| Technology Distribution | 1 | $58B |
|
||
| Homebuilding | 1 | $35B |
|
||
| Technology Manufacturing | 1 | $35B |
|
||
Cash-flow waterfall
monthlySold comps — $/sqft
last 12 mo · ≤1 miLoading sold comps…