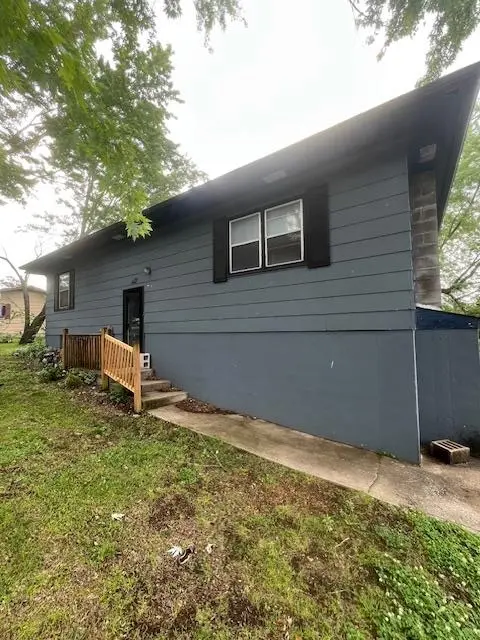
716 N Terrace Ln · Stockton, MO
Flood risk 1/10 · Minimal
- FEMA flood zone
- X (unshaded)
- Chance of flooding over 30 yrs
- 0.0%
- Est. flood insurance / yr
- $473 – $860
Fire risk 4/10 · Minor
- Est. fire insurance / yr
- $1,054 – $1,958
Heat risk 5/10 · Moderate
- Hot days now (above 108°F)
- 7 days/yr
- Hot days in 30 yrs
- 19 days/yr
Wind risk 2/10 · Minimal
- Chance of severe wind over 30 yrs
- 2.0%
Air-quality risk 2/10 · Minimal
- Unhealthy air days now
- 1 days/yr
- Unhealthy air days in 30 yrs
- 1 days/yr
Risk factors via First Street. Map © Google.
Why this score? — see what drove the B- grade
The composite is a weighted blend of 9 inputs, each scored 0–100. Each bar is that input's sub-score; the figure is the points it added to the 100-point composite (weight × sub-score).
- Cash flow +19.5/30.0
- ARV discount +14.7/15.0
- Appreciation +10.0/10.0
- DSCR +6.1/10.0
- 1% rule +4.1/10.0
- Schools +3.9/10.0
- Livability +3.1/5.0
- Rent growth +2.5/5.0
- Condition / age +2.5/5.0
$110,000
🖨 Deal sheet 📄 Offer letter ✓ Due diligence
Listing remarks
This split-level home is nestled in a great location within the Stockton city limits. It's only a 5-minute drive to the highly desirable clean waters of Stockton Lake. This home is ready for its next chapter. A little work will go a long way in transforming this property into something special. Investors this could be a great flip for you. Think renovation, resale, or long-term investment. Cash or Conventional loans only.
Key facts
- 0.25 acre lot
- Built 1976
- Listed 26 days
Property features AI
Exterior
- Utilities: Public water; Public sewer
- Home design: Residential single-family home
- Construction: Asphalt roof
- Exterior features: Chain link fencing; Property has a view; Public-maintained city street access
Interior
- Kitchen: Cooktop (electric); Built-in electric oven; Microwave; Refrigerator
- Flooring: Vinyl
- Bathrooms: 1 full bathroom
- Heating & cooling: Electric heating; Wood heating; Radiant ceiling heating; Window air conditioning units
- Interior features: Fireplace (other type); Walk-out, unfinished full basement
- Laundry & utility: Laundry in basement
Neighborhood map
What this means for you Summary
Snapshot
- This is a 3-bed/1.0-bath single-family listed at $110k.
Deal economics
- At list price, monthly cash flow is $124 ($1k/yr) — positive.
- The deal already cash-flows at list — no discount required.
- To meet the 1% rule (rent ≥ 1% of price), the offer needs to be $100k (9.1% below list).
- Recommended offer: $100k (9.1% below list) — sets the bar for 1% rule.
- Cap rate 7.6% vs local median 3.5% in Stockton — top-decile yield for the area; either an underpriced asset or a hidden risk that comps aren't pricing in. Stress-test before assuming the spread holds.
Location & tenants
- Location reads 61/100 on livability (#456 in MO) — a middle-class / working-renter tenant base. Strengths: cost of living A+, crime A-, housing A-; Watch: amenities F, commute F, employment F.
- Stockton R-I (rural): math 45% / reading 50% proficiency, ranked #77 of 324 in MO (top 24%) — families likely to look elsewhere, expect single-tenant / working-renter base with shorter leases.
- Zoned schools: Stockton Elem. (math 57% / reading 57%, grade C+, #159 of 1,115 statewide, top 16%, 359 students, 49% FRL); Stockton Middle (math 40% / reading 47%, grade D, #127 of 391 statewide, top 34%, 277 students, 42% FRL); Stockton High (math 47% / reading 52%, grade D, #124 of 521 statewide, top 28%, 285 students, 39% FRL).
- Market conditions: 106 active listings in the ZIP; 1 comparable units currently listed for rent nearby; 4 units permitted in Cedar County in 2024 (0 in 5+ unit buildings).
Forward outlook
- In year one you build about $12k of equity ($761 loan paydown + $11k appreciation (10.0% local appreciation)).
- Cedar County population projected at -12% by 2050 — secular population decline; favor cash flow + early exit over multi-decade hold.
- At projected returns (10.0% appreciation + 3.0% rent growth), your $31k cash investment doubles in ~3 years — after that, you're playing with house money.
- By year 4, paydown + projected appreciation supports a ~$42k cash-out refi (75% LTV) — recoverable capital for the next deal without selling this one.
Negotiation context
- It's been on market 27 days — a 2% lower offer ($108k) is reasonable based on typical stale-listing flexibility.
Risks & watch-outs
- Climate carrying-cost: extreme-heat days projected 7→19/yr by 2055 (HVAC capex compounding) — expect insurance premiums to compound above CPI over the hold.
Questions for the listing agent
- Built in 1976 — when were the roof, HVAC, electrical panel, plumbing, and water heater last replaced?
- Is there a deadline driving the sale (1031 exchange, divorce, estate, relocation)? That informs how much negotiation room exists.
- What's the average days-on-market for RENTAL listings here right now (not sales)? A rising rental-DOM trend means longer vacancies and softer asking-rent achievability than the comps imply.
- What's the recent tenant-quality profile in this submarket — average credit score on applications, eviction rate, late-payment / NSF rate, and stable-employment percentage? A property-management company in the area should have these aggregated.
- How much new for-sale + rental construction is in the pipeline within 1–3 miles? Heavy new supply typically softens prices + rents 12–24 months out; constrained supply supports both.
Investment metrics
- 1% rule
- 0.91% ✗
- Cap rate
- 7.64%
- Cash-on-cash
- 4.83%
- DSCR
- 1.21
- GRM
- 9.2
CMA / ARV
- ARV (on-the-fly)
- $131,040
- Comps found
- 11
Show comp detail 11 sales within ~0.75 mi
| Address | Dist | Beds/Ba | Sqft | Sold | Price | $/sf | Match |
|---|---|---|---|---|---|---|---|
| 721 N Terrace Ln | 0.03mi | 3/1.5 | 1,120 (+3%) | 11mo | $177,000 | $158 | 83 |
| 610 N North Terrace Ln | 0.09mi | 3/1.5 | 1,092 (0%) | 20mo | $184,900 | $169 | 77 |
| 802 N Ward | 0.11mi | 2/1.0 (-1) | 1,125 (+3%) | 14mo | $135,000 | $120 | 73 |
| 607 N Ward St | 0.12mi | 3/1.0 | 1,056 (-3%) | 21mo | $140,000 | $133 | 72 |
| 201 W Craig St | 0.19mi | 3/2.0 | 1,092 (0%) | 22mo | $149,500 | $137 | 69 |
| 407 N Ward St | 0.34mi | 3/1.0 | 1,080 (-1%) | 21mo | $125,000 | $116 | 65 |
| 202 W Davis St | 0.53mi | 3/2.0 | 1,152 (+6%) | 14mo | $82,500 | $72 | 50 |
| 112 S High St | 0.61mi | 2/1.0 (-1) | 1,170 (+7%) | 16mo | $74,900 | $64 | 42 |
| 210 Spring St | 0.48mi | 3/2.0 | 1,200 (+10%) | 24mo | $119,900 | $100 | 38 |
| 202 E Locust St | 0.74mi | 2/1.0 (-1) | 1,168 (+7%) | 19mo | $139,900 | $120 | 33 |
| 117 Jackson St | 0.62mi | 2/2.0 (-1) | 1,230 (+13%) | 21mo | $149,900 | $122 | 23 |
Match score weights: distance 35% · size 25% · config 20% · recency 20%. Top-matched comps best support the ARV.
Projected returns pro-forma
10.0% appreciation · 3.0% rent growth · sell at horizon
- IRR
- 27.8%
- Equity multiple
- 3.20×
- Total profit
- $67,756
- Equity at exit
- $99,097
- IRR
- 24.2%
- Equity multiple
- 7.27×
- Total profit
- $193,241
- Equity at exit
- $213,706
Cash invested: $30,800 (down + closing). Projections, not guarantees.
Landlord ↔ Tenant lean methodology
- Overall (STATE)
- 81 Strongly Landlord-Friendly
- State Missouri
- 81 Strongly Landlord-Friendly · R+10
- County
- — inherits STATE
- City
- — inherits STATE
ZIP-level market 65785
- Home prices YoY
- 6.0%
- Active inventory
- 106
- Price-to-rent
- 9.2×
Monthly cashflow live
- Estimated rent
- $1,000 medium interval (Pro) →
- Mortgage (P&I)
- −$577
- Tax from tax record
- −$43 /mo · $521/yr
- Insurance
- −$46
- HOA
- −$0
- Vacancy / Maint / Mgmt
- −$210
- Net cashflow
- $124
Break-even live
UW: 25.0% down · 7.5% · 30yr · 1.5% tax · 5.0% vac · 8.0% maint · 8.0% mgmt
Financing live
Cash to close
- Down payment
- $27,500
- Closing costs
- $3,300
- Reserves months
- —
- Total cash needed
- —
Loan-product check · same deal, 3 products live
Conventional
25% down · 7.5% · 30yr
- Down + closing
- —
- Monthly P&I
- —
- Monthly cashflow
- —
- DSCR
- —
- Eligible?
- —
Personal DTI + credit; lowest rate.
DSCR
20% down · 8.5% · 30yr
- Down + closing
- —
- Monthly P&I
- —
- Monthly cashflow
- —
- DSCR
- —
- Eligible?
- —
No personal income docs; deal must DSCR.
Hard money
10% down · 12.0% · 12mo
- Down + closing
- —
- Monthly P&I
- —
- Monthly cashflow
- —
- DSCR
- —
- Eligible?
- —
Short-term bridge; refi at stabilization.
Rent comps 1 comps
| Address | Beds | Baths | Sqft | Rent | $/sqft | DOM | Units | Dist |
|---|---|---|---|---|---|---|---|---|
| 602 North St Stockton, MO | 3.0 | 2.0 | 950 | $1,000 | $1.05 | 23d | 1 | 0.29mi |
Listing history 15 events
-
2026-06-18days on market $110,000 Active 27 DOM
-
2026-06-17days on market $110,000 Active 26 DOM
-
2026-06-16days on market $110,000 Active 25 DOM
-
2026-06-15days on market $110,000 Active 24 DOM
-
2026-06-13days on market $110,000 Active 22 DOM
-
2026-06-12days on market $110,000 Active 21 DOM
-
2026-06-09days on market $110,000 Active 18 DOM
-
2026-06-08days on market $110,000 Active 17 DOM
-
2026-06-07days on market $110,000 Active 16 DOM
-
2026-06-07days on market $110,000 Active 15 DOM
-
2026-06-04days on market $110,000 Active 12 DOM
-
2026-06-02days on market $110,000 Active 11 DOM
-
2026-06-01days on market $110,000 Active 10 DOM
-
2026-05-31days on market $110,000 Active 9 DOM
-
2026-05-21$110,000 Active
ⓘ Source: listings_history table (triggers on properties + properties_extension) + one-shot
backfill from property_details.listing_events for pre-trigger history.
Tax reassessment forecast MO · Resets to sale price
- Current annual tax
- $521 · $43/mo
- Projected year-2 tax
- $1,067 · $89/mo
- Expected delta
- +$546/yr (+$45/mo · 104.7%)
ⓘ Screening estimate from a state-policy table — verify with the county assessor before closing.
Climate risk First Street
- Flood 1/10 Low FEMA zone X (unshaded) · 0% chance over 30 yrs
- Wildfire 4/10 Moderate
- Heat 5/10 Major 7 d/yr ≥108°F today · 19 d/yr by 30 yrs out
- Wind 2/10 Low 2% chance of damaging wind over 30 yrs
- Air quality 2/10 Low 1 unhealthy d/yr today · 1 by 30 yrs out
Nearby sold comps map
Loading sold comps map…
Walkable amenities ~0.75 mi
Loading nearby amenities…
Taxation est. · year 1
- Rental income
- $12,000
- − Mortgage interest
- −$6,162
- − Property taxes
- −$521
- − Insurance
- −$550
- − Repairs & maintenance
- −$960
- − Management
- −$960
- − Depreciation
- −$3,200
- Taxable loss
- −$353
- Est. tax savings @ 24.0%
- +$85
- After-tax cash flow
- $1,571/yr
For passive investors: Depreciation is non-cash, so a rental often shows a tax loss while cash-flowing — sheltering income. Rental losses are passive: they offset passive income freely, and up to $25,000/yr can offset ordinary (W-2) income if you actively participate and your MAGI is under $100k (phasing out to $0 by $150k); unused losses carry forward. On sale, claimed depreciation is recaptured at up to 25%, and gains may owe capital-gains tax (a 1031 exchange can defer both). Figures are a year-1 estimate at your 24.0% rate — not tax advice; consult a CPA.
Schools (NCES district)
- District
- Stockton R-I
- NCES district ID
- 2929520
- Math proficiency
- 45% ▲ 2.00%
- Reading proficiency
- 50% ▼ -1.00%
- Median HH income
- $35,609
- Composite
- 39.32/100
- National rank
- #3989
- State rank
- #77 of 324 in MO
Livability — Stockton
- Score
- 61/100
- State rank
- #456
- US rank
- #18379
Category grades
Schools grade is shown separately in the Schools card above.
Census & demographics
- Census place
- Stockton, MO
- Population (ZIP)
- 5,538
Population outlook (Cedar County) Hauer SSP2
- Today (2025)
- 13,424 people
- By 2030
- 13,080 · -2.6%
- By 2040
- 12,434 · -7.4%
- By 2050
- 11,841 · -11.8%
- By 2075
- 10,171 · -24.2%
- By 2100
- 7,744 · -42.3%
Race, ethnicity, and origin ACS 2023
- Neighborhood character
- Predominantly White (92%)
- Race & ethnicity
- White 92% Two or more races 4% Hispanic / Latino 3%
- Common ancestry
- Italian 4% Lithuanian 2% Serbian 2%
- Foreign-born
- 1% · Canada
- Languages at home
- 96% English-only · Spanish 1% Other Indo-European 1% German/W. Germanic 1%
Political lean MEDSL · Cedar
- 2024 margin
- Solid R (+69.6) · D 14.8% · R 84.4%
- 2008→2024 swing
- -36.0pp toward R · 2008: -33.6pp · 2024: -69.6pp
- All cycles
- 2024: R+69.6 2020: R+65.9 2016: R+63.9 2012: R+47.0 2008: R+33.6
Not yet ingested
- Civics
- —
Market trends
- HPI YoY
- ▲ 16.72%
- Current HPI
- 293.8984
- Rent YoY
- —
- Metro
- —
- State GDP YoY
- ▲ 1.84%
- F500 in state
- 20
Industry mix (Fortune 500 HQ in MO)
| Industry | F500 HQs | Revenue |
|---|---|---|
| Healthcare | 1 | $163B |
|
||
| Insurance | 1 | $21B |
|
||
| Industrial Technology | 1 | $17B |
|
||
| Retail | 1 | $16B |
|
||
| Industrial Distribution | 1 | $10B |
|
||
| Utilities | 1 | $9B |
|
||
Price history
1 event — show timeline
- 2026-05-21 Listed $110,000 SOMO
Property tax history
+1.9%/yrLatest (2025): $521 · +7.4% YoY. Source: county tax records.
Cash-flow waterfall
monthlySold comps — $/sqft
last 12 mo · ≤1 miLoading sold comps…