 Duplex
2405 Ryan Rd · Bowman, TN
Flood risk 1/10 · Minimal
- FEMA flood zone
- X (unshaded)
- Chance of flooding over 30 yrs
- 0.0%
- Est. flood insurance / yr
- $507 – $1,088
Fire risk 7/10 · Major
- Est. fire insurance / yr
- $949 – $1,763
Heat risk 3/10 · Minor
- Hot days now (above 98°F)
- 7 days/yr
- Hot days in 30 yrs
- 20 days/yr
Wind risk 3/10 · Minor
- Chance of severe wind over 30 yrs
- 8.0%
Air-quality risk 2/10 · Minimal
- Unhealthy air days now
- 1 days/yr
- Unhealthy air days in 30 yrs
- 1 days/yr
Risk factors via First Street. Map © Google.
Why this score? — see what drove the B grade
The composite is a weighted blend of 9 inputs, each scored 0–100. Each bar is that input's sub-score; the figure is the points it added to the 100-point composite (weight × sub-score).
- Cash flow +28.0/30.0
- Appreciation +10.0/10.0
- DSCR +9.9/10.0
- ARV discount +7.5/15.0
- 1% rule +6.4/10.0
- Livability +3.4/5.0
- Schools +2.6/10.0
- Rent growth +2.5/5.0
- Condition / age +2.5/5.0
$240,900
🖨 Deal sheet 📄 Offer letter ✓ Due diligence
Multi-family units
County records classify this as Multi-Family (2-4 Unit). Listing-text estimate: 2 units. confirmed
Listing remarks
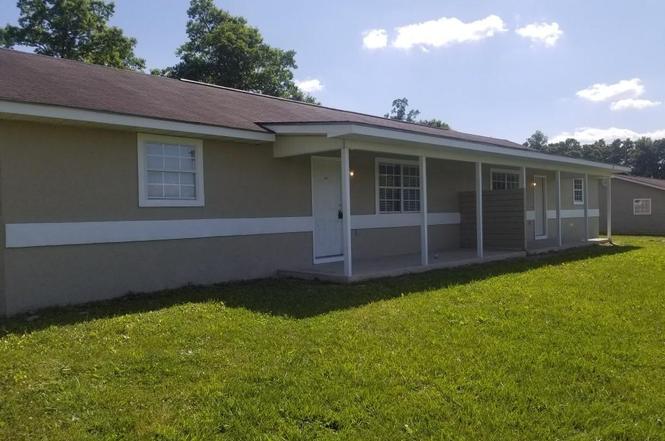
Investment Opportunity - Duplex on 2.1 Acres! Well-maintained duplex offering two spacious units, each approximately 1,000 sq ft with 2 bedrooms and 1 bath. Property provides excellent rental income potential and is situated on approximately 2.1 acres in a private country setting. Each unit offers comfortable living space, spacious laundry with room to enjoy the outdoors. Great opportunity for investors or those looking to live in one unit while renting the other. Call Today to schedule a showing!
Key facts
- Spacious laundry
- 2.1 acres
- Duplex
Tags
Property features AI
Finance
- Other: Located at 2405 Ryan Rd, Crossville, TN
- Financial info: Owner responsible for lawn maintenance
Exterior
- Parking: On-premise parking
- Utilities: Utilities available: heating (natural gas and electric), central cooling
- Home design: Duplex (2-unit building); Total building area about 1,000 (per tax records)
- Construction: Stucco and block construction
- Exterior features: Lot dimensions approximately 397 x 229
Interior
- Kitchen: Dishwasher; Self-cleaning oven; Refrigerator; Garbage disposal
- Bedrooms: Two 2-bedroom units (both unfurnished)
- Flooring: Carpet; Vinyl
- Heating & cooling: Central heating (natural gas and electric); Central cooling; Ceiling fans
- Interior features: Dishwasher; Garbage disposal; Refrigerator; Self-cleaning oven
Neighborhood map
What this means for you Summary
Snapshot
- This is a 2 × 2-bed/1.0-bath units multifamily listed at $241k.
Deal economics
- At list price, monthly cash flow is $748 ($9k/yr) — positive. Per door: $374/mo.
- The deal already cash-flows at list — no discount required.
- Meets the 1% rule at list price ($3k rent vs $241k).
- Recommended offer: $219k (9.0% below list) — sets the bar for market timing.
Location & tenants
- Location reads 67/100 on livability (#103 in TN) — a middle-class / working-renter tenant base. Strengths: cost of living A+, housing A+; Watch: health & safety C-, schools F, crime D-.
- Cumberland County (rural): math 30% / reading 31% proficiency, ranked #59 of 139 in TN (top 42%) — families likely to look elsewhere, expect single-tenant / working-renter base with shorter leases.
- Market conditions: 216 active listings in the ZIP; 114 units permitted in Cumberland County in 2024 (0 in 5+ unit buildings).
Forward outlook
- In year one you build about $26k of equity ($2k loan paydown + $24k appreciation (10.0% local appreciation)).
- Cumberland County population projected at +7% by 2050 — modest demand growth; plan on rents tracking national, not racing it.
- At projected returns (10.0% appreciation + 3.0% rent growth), your $67k cash investment doubles in ~2 years — after that, you're playing with house money.
- By year 2, paydown + projected appreciation supports a ~$41k cash-out refi (75% LTV) — recoverable capital for the next deal without selling this one.
Negotiation context
- It's been on market 101 days — a 9% lower offer ($219k) is reasonable based on typical stale-listing flexibility.
Risks & watch-outs
- Climate carrying-cost: major wildfire risk — expect insurance premiums to compound above CPI over the hold.
Questions for the listing agent
- It's been on market 101 days. Have you received any prior offers? Is the seller open to a 9% concession, seller financing, or rate buy-down credit?
- Can we see the unit-by-unit rent roll, current vacancy, and any below-market leases? What's the average tenancy length?
- What capital expenditures (roof, boiler, parking lot, exteriors) have been made in the last 5 years, and what's planned in the next 2?
- Why hasn't it sold? Are there any deal-killer items the seller is aware of (foundation, flood, title, zoning, code violations)?
- Is there a deadline driving the sale (1031 exchange, divorce, estate, relocation)? That informs how much negotiation room exists.
- Schools are F-rated, which usually means shorter tenancies and higher turnover. Who's the typical renter profile here, and what's been the actual vacancy rate?
- Crime grade is D in this area — have there been break-ins, vandalism, or insurance claims at this property in the last 3 years? What carrier currently insures it and at what premium?
- What's the average days-on-market for RENTAL listings here right now (not sales)? A rising rental-DOM trend means longer vacancies and softer asking-rent achievability than the comps imply.
- What's the recent tenant-quality profile in this submarket — average credit score on applications, eviction rate, late-payment / NSF rate, and stable-employment percentage? A property-management company in the area should have these aggregated.
- How much new apartment / multifamily construction is in the pipeline within 1–3 miles? Heavy new supply (>2% of stock underway) typically softens rents 12–24 months out; light construction supports rent growth.
Investment metrics
- 1% rule
- 1.14% ✓
- Cap rate
- 10.02%
- Cash-on-cash
- 13.30%
- DSCR
- 1.59
- GRM
- 7.3
CMA / ARV
No comps found within radius.
Projected returns pro-forma
10.0% appreciation · 3.0% rent growth · sell at horizon
- IRR
- 34.1%
- Equity multiple
- 3.65×
- Total profit
- $178,723
- Equity at exit
- $217,022
- IRR
- 29.3%
- Equity multiple
- 8.24×
- Total profit
- $488,645
- Equity at exit
- $468,016
Cash invested: $67,452 (down + closing). Projections, not guarantees.
Landlord ↔ Tenant lean methodology
- Overall (STATE)
- 87 Strongly Landlord-Friendly
- State Tennessee
- 87 Strongly Landlord-Friendly · R+13
- County
- — inherits STATE
- City
- — inherits STATE
ZIP-level market 38571
- Home prices YoY
- 6.7%
- Active inventory
- 216
- Price-to-rent
- 14.6×
Monthly cashflow live
- Estimated rent
- $2,750 medium interval (Pro) →
- Mortgage (P&I)
- −$1,263
- Tax from tax record
- −$61 /mo · $732/yr
- Insurance
- −$100
- HOA
- −$0
- Vacancy / Maint / Mgmt
- −$578
- Net cashflow
- $748
Break-even live
2-unit breakdown (identical units grouped — click to expand)
| Units | Beds | Baths | Est. rent |
|---|---|---|---|
| 2× units | 2 | 1 | $2,750 |
| #1 | 2 | 1 | $1,375 |
| #2 | 2 | 1 | $1,375 |
| Total (2 units) | $2,750 | ||
UW: 25.0% down · 7.5% · 30yr · 1.5% tax · 5.0% vac · 8.0% maint · 8.0% mgmt
Financing live
Cash to close
- Down payment
- $60,225
- Closing costs
- $7,227
- Reserves months
- —
- Total cash needed
- —
Loan-product check · same deal, 3 products live
Conventional
25% down · 7.5% · 30yr
- Down + closing
- —
- Monthly P&I
- —
- Monthly cashflow
- —
- DSCR
- —
- Eligible?
- —
Personal DTI + credit; lowest rate.
DSCR
20% down · 8.5% · 30yr
- Down + closing
- —
- Monthly P&I
- —
- Monthly cashflow
- —
- DSCR
- —
- Eligible?
- —
No personal income docs; deal must DSCR.
Hard money
10% down · 12.0% · 12mo
- Down + closing
- —
- Monthly P&I
- —
- Monthly cashflow
- —
- DSCR
- —
- Eligible?
- —
Short-term bridge; refi at stabilization.
Listing history 15 events
-
2026-06-18days on market $240,900 Active 101 DOM
-
2026-06-17days on market $240,900 Active 100 DOM
-
2026-06-16days on market $240,900 Active 99 DOM
-
2026-06-15days on market $240,900 Active 98 DOM
-
2026-06-13days on market $240,900 Active 96 DOM
-
2026-06-12days on market $240,900 Active 95 DOM
-
2026-06-09days on market $240,900 Active 92 DOM
-
2026-06-08days on market $240,900 Active 91 DOM
-
2026-06-08days on market $240,900 Active 90 DOM
-
2026-06-07days on market $240,900 Active 89 DOM
-
2026-06-03days on market $240,900 Active 86 DOM
-
2026-06-02days on market $240,900 Active 85 DOM
-
2026-06-01days on market $240,900 Active 84 DOM
-
2026-05-31days on market $240,900 Active 83 DOM
-
2026-03-09$252,900 Active
ⓘ Source: listings_history table (triggers on properties + properties_extension) + one-shot
backfill from property_details.listing_events for pre-trigger history.
Tax reassessment forecast TN · Resets to sale price
- Current annual tax
- $732 · $61/mo
- Projected year-2 tax
- $1,710 · $143/mo
- Expected delta
- +$978/yr (+$82/mo · 133.7%)
ⓘ Screening estimate from a state-policy table — verify with the county assessor before closing.
Climate risk First Street
- Flood 1/10 Low FEMA zone X (unshaded) · 0% chance over 30 yrs
- Wildfire 7/10 Severe
- Heat 3/10 Moderate 7 d/yr ≥98°F today · 20 d/yr by 30 yrs out
- Wind 3/10 Moderate 8% chance of damaging wind over 30 yrs
- Air quality 2/10 Low 1 unhealthy d/yr today · 1 by 30 yrs out
Nearby sold comps map
Loading sold comps map…
Walkable amenities ~0.75 mi
Loading nearby amenities…
Taxation est. · year 1
- Rental income
- $33,000
- − Mortgage interest
- −$13,494
- − Property taxes
- −$732
- − Insurance
- −$1,204
- − Repairs & maintenance
- −$2,640
- − Management
- −$2,640
- − Depreciation
- −$7,008
- Taxable income
- $5,281
- Est. tax owed @ 24.0%
- −$1,268
- After-tax cash flow
- $7,706/yr
For passive investors: Depreciation is non-cash, so a rental often shows a tax loss while cash-flowing — sheltering income. Rental losses are passive: they offset passive income freely, and up to $25,000/yr can offset ordinary (W-2) income if you actively participate and your MAGI is under $100k (phasing out to $0 by $150k); unused losses carry forward. On sale, claimed depreciation is recaptured at up to 25%, and gains may owe capital-gains tax (a 1031 exchange can defer both). Figures are a year-1 estimate at your 24.0% rate — not tax advice; consult a CPA.
Schools (NCES district)
- District
- Cumberland County
- NCES district ID
- 4700900
- Math proficiency
- 30% ▼ -10.00%
- Reading proficiency
- 31% ▼ -7.00%
- Median HH income
- $38,510
- Composite
- 25.52/100
- National rank
- #7438
- State rank
- #59 of 139 in TN
Livability — Bowman
- Score
- 67/100
- State rank
- #103
- US rank
- #10579
Category grades
Schools grade is shown separately in the Schools card above.
Census & demographics
- Census place
- Bowman, TN
- Population (ZIP)
- 14,573
Population outlook (Cumberland County) Hauer SSP2
- Today (2025)
- 61,344 people
- By 2030
- 62,611 · +2.1%
- By 2040
- 64,547 · +5.2%
- By 2050
- 65,462 · +6.7%
- By 2075
- 66,839 · +9.0%
- By 2100
- 63,855 · +4.1%
Race, ethnicity, and origin ACS 2023
- Neighborhood character
- Predominantly White (96%)
- Race & ethnicity
- White 96% Two or more races 2% Hispanic / Latino 1%
- Common ancestry
- Serbian 3% Italian 2% Lithuanian 2%
- Foreign-born
- 1% · Canada
- Languages at home
- 97% English-only · German/W. Germanic 1% Spanish 1% Other Indo-European 1%
Political lean MEDSL · Cumberland
- 2024 margin
- Solid R (+58.9) · D 20.2% · R 79.1%
- 2008→2024 swing
- -21.8pp toward R · 2008: -37.1pp · 2024: -58.9pp
- All cycles
- 2024: R+58.9 2020: R+57.1 2016: R+57.8 2012: R+49.1 2008: R+37.1
Not yet ingested
- Civics
- —
Market trends
- HPI YoY
- ▲ 24.02%
- Current HPI
- 382.4479
- Rent YoY
- —
- Metro
- —
- State GDP YoY
- ▲ 2.78%
- F500 in state
- 22
Industry mix (Fortune 500 HQ in TN)
| Industry | F500 HQs | Revenue |
|---|---|---|
| Healthcare | 3 | $91B |
|
||
| Retail | 3 | $72B |
|
||
| Transportation / Logistics | 1 | $88B |
|
||
| Paper / Packaging | 1 | $19B |
|
||
| Insurance | 1 | $13B |
|
||
| Energy | 1 | $12B |
|
||
Price history
1 event — show timeline
- 2026-03-09 Listed $252,900 Knoxville MLS
Property tax history
+2.0%/yrLatest (2025): $732 · +0.0% YoY. Source: county tax records.
Cash-flow waterfall
monthlySold comps — $/sqft
last 12 mo · ≤1 miLoading sold comps…