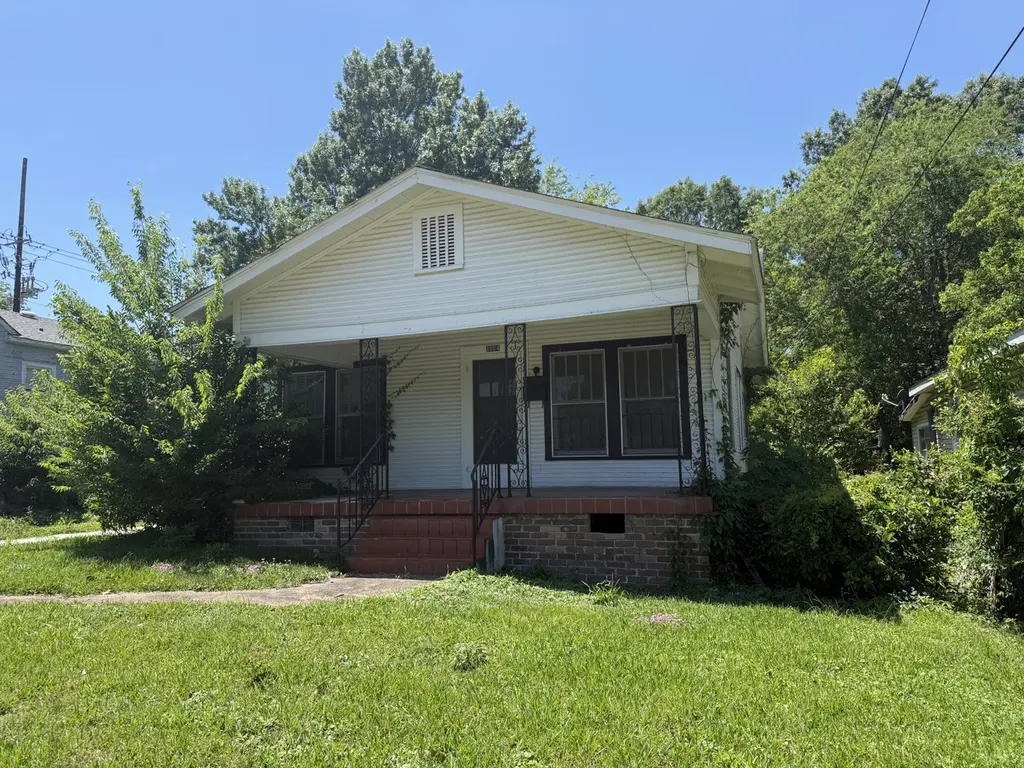
1004 N 8th Ave · Laurel, MS
Flood risk 1/10 · Minimal
- FEMA flood zone
- X (unshaded)
- Chance of flooding over 30 yrs
- 0.0%
- Est. flood insurance / yr
- $507 – $1,088
Fire risk 1/10 · Minimal
- Est. fire insurance / yr
- $1,241 – $2,305
Heat risk 8/10 · Major
- Hot days now (above 108°F)
- 7 days/yr
- Hot days in 30 yrs
- 20 days/yr
Wind risk 8/10 · Major
- Chance of severe wind over 30 yrs
- 98.0%
Air-quality risk 1/10 · Minimal
- Unhealthy air days now
- 0 days/yr
- Unhealthy air days in 30 yrs
- 0 days/yr
Risk factors via First Street. Map © Google.
Why this score? — see what drove the B grade
The composite is a weighted blend of 9 inputs, each scored 0–100. Each bar is that input's sub-score; the figure is the points it added to the 100-point composite (weight × sub-score).
- Cash flow +30.0/30.0
- ARV discount +15.0/15.0
- 1% rule +10.0/10.0
- DSCR +10.0/10.0
- Livability +3.3/5.0
- Rent growth +2.5/5.0
- Condition / age +2.5/5.0
- Schools +1.3/10.0
- Appreciation +0.0/10.0
$60,000
🖨 Deal sheet 📄 Offer letter ✓ Due diligence
Listing remarks
Located near the heart of Laurel and all the charm that makes Laurel special, this property presents a fantastic opportunity for investors or flippers. This cottage has been a successful rental for years and, with some finishing work, could once again become a strong income-producing property. Much of the renovation work has already been started, giving the next owner a valuable head start. Whether you are looking for your next investment project or a flip opportunity, this property offers plenty of potential. Buyer and buyer's agent to verify all information.
Key facts
- 8,000 sq ft lot
- Parking
- Built 1933
Property features AI
Exterior
- Parking: Attached carport (1 car); Driveway
- Utilities: Public water; Public sewer
- Home design: Single-family residence; One story; Raised foundation
- Construction: Wood siding; Composition roof
- Exterior features: Garden; Front porch
Interior
- Flooring: Wood; Vinyl
- Bathrooms: 1 full bathroom
- Heating & cooling: Central heating (natural gas); Window cooling units
- Interior features: Wood and vinyl flooring
Neighborhood map
What this means for you Summary
Snapshot
- This is a 2-bed/1.0-bath single-family listed at $60k.
Deal economics
- At list price, monthly cash flow is $742 ($9k/yr) — positive.
- The deal already cash-flows at list — no discount required.
- Meets the 1% rule at list price ($1k rent vs $60k).
- Recommended offer: $59k (1.5% below list) — sets the bar for market timing.
Location & tenants
- Location reads 66/100 on livability (#92 in MS) — a middle-class / working-renter tenant base. Strengths: cost of living A+, housing A+, health & safety A+; Watch: schools D-, crime F, commute F.
- Laurel School District (town): math 16% / reading 18% proficiency, ranked #101 of 130 in MS (top 78%) — low school quality limits family demand, transient renter base, plan for 1-2y turnover; 88% free/reduced lunch — lower-income household profile, screen leases tightly.
- Market conditions: 131 active listings in the ZIP; 23 units permitted in Jones County in 2024 (5 in 5+ unit buildings).
Forward outlook
- Local home prices are declining (-3.0%/yr); year-one equity from $415 of loan paydown is wiped out by about $2k of value loss. Plan a longer hold.
- Jones County population projected to shrink 4% by 2050 — rents likely to lag national; underwrite the cash flow, not the appreciation.
- At projected returns (-3.0% appreciation + 3.0% rent growth), your $17k cash investment doubles in ~3 years — after that, you're playing with house money.
Negotiation context
- It's been on market 15 days — a 2% lower offer ($59k) is reasonable based on typical stale-listing flexibility.
- 2 sale attempts with the ask held roughly flat each time — persistent listings suggest the price (not the market) is what's stuck; bring a comps-based counter.
- Current owner paid $25k; list at $60k implies a 140% gain — meaningful room to come down on a strong offer.
Risks & watch-outs
- Watch-outs: built in 1933 — expect roof / HVAC / electrical / plumbing capex.
- Climate carrying-cost: severe wind risk, 98% chance of damaging wind over 30y; extreme-heat days projected 7→20/yr by 2055 (HVAC capex compounding) — expect insurance premiums to compound above CPI over the hold.
Questions for the listing agent
- Built in 1933 — when were the roof, HVAC, electrical panel, plumbing, and water heater last replaced?
- Is there a deadline driving the sale (1031 exchange, divorce, estate, relocation)? That informs how much negotiation room exists.
- Schools are D-rated, which usually means shorter tenancies and higher turnover. Who's the typical renter profile here, and what's been the actual vacancy rate?
- Crime grade is F in this area — have there been break-ins, vandalism, or insurance claims at this property in the last 3 years? What carrier currently insures it and at what premium?
- What's the average days-on-market for RENTAL listings here right now (not sales)? A rising rental-DOM trend means longer vacancies and softer asking-rent achievability than the comps imply.
- What's the recent tenant-quality profile in this submarket — average credit score on applications, eviction rate, late-payment / NSF rate, and stable-employment percentage? A property-management company in the area should have these aggregated.
- How much new for-sale + rental construction is in the pipeline within 1–3 miles? Heavy new supply typically softens prices + rents 12–24 months out; constrained supply supports both.
Investment metrics
- 1% rule
- 2.46% ✓
- Cap rate
- 21.13%
- Cash-on-cash
- 52.98%
- DSCR
- 3.36
- GRM
- 3.4
CMA / ARV
- ARV (median comp)
- $81,969
- List price
- $60,000
- Delta
- -26.80%
- Verdict
- UNDERPRICED
- Comps
- 8 within 1.0 mi
Projected returns pro-forma
-3.0% appreciation · 3.0% rent growth · sell at horizon
- IRR
- 51.0%
- Equity multiple
- 3.23×
- Total profit
- $37,545
- Equity at exit
- $8,946
- IRR
- 56.4%
- Equity multiple
- 6.57×
- Total profit
- $93,634
- Equity at exit
- $5,188
Cash invested: $16,800 (down + closing). Projections, not guarantees.
Landlord ↔ Tenant lean methodology
- Overall (STATE)
- 90 Strongly Landlord-Friendly
- State Mississippi
- 90 Strongly Landlord-Friendly · R+11
- County
- — inherits STATE
- City
- — inherits STATE
ZIP-level market 39440
- Active inventory
- 131
- Price-to-rent
- 3.4×
Monthly cashflow live
- Estimated rent
- $1,475 medium interval (Pro) →
- Mortgage (P&I)
- −$315
- Tax from tax record
- −$84 /mo · $1,007/yr
- Insurance
- −$25
- HOA
- −$0
- Vacancy / Maint / Mgmt
- −$310
- Net cashflow
- $742
Break-even live
UW: 25.0% down · 7.5% · 30yr · 1.5% tax · 5.0% vac · 8.0% maint · 8.0% mgmt
Financing live
Cash to close
- Down payment
- $15,000
- Closing costs
- $1,800
- Reserves months
- —
- Total cash needed
- —
Loan-product check · same deal, 3 products live
Conventional
25% down · 7.5% · 30yr
- Down + closing
- —
- Monthly P&I
- —
- Monthly cashflow
- —
- DSCR
- —
- Eligible?
- —
Personal DTI + credit; lowest rate.
DSCR
20% down · 8.5% · 30yr
- Down + closing
- —
- Monthly P&I
- —
- Monthly cashflow
- —
- DSCR
- —
- Eligible?
- —
No personal income docs; deal must DSCR.
Hard money
10% down · 12.0% · 12mo
- Down + closing
- —
- Monthly P&I
- —
- Monthly cashflow
- —
- DSCR
- —
- Eligible?
- —
Short-term bridge; refi at stabilization.
Listing history 7 events
-
2026-06-05statusdays on market $60,000 Pending 15 DOM
-
2026-06-04days on market $60,000 Active 14 DOM
-
2026-06-02days on market $60,000 Active 13 DOM
-
2026-06-01days on market $60,000 Active 12 DOM
-
2026-05-31days on market $60,000 Active 11 DOM
-
2026-05-13$60,000 Active 566-char remark
-
2016-07-07soldstatus $25,000
ⓘ Source: listings_history table (triggers on properties + properties_extension) + one-shot
backfill from property_details.listing_events for pre-trigger history.
Tax reassessment forecast MS · Resets to sale price
- Current annual tax
- $1,007 · $84/mo
- Projected year-2 tax
- $1,007 · $84/mo
- Expected delta
- $0/yr ($0/mo · 0.0%)
ⓘ Screening estimate from a state-policy table — verify with the county assessor before closing.
Climate risk First Street
- Flood 1/10 Low FEMA zone X (unshaded) · 0% chance over 30 yrs
- Wildfire 1/10 Low
- Heat 8/10 Severe 7 d/yr ≥108°F today · 20 d/yr by 30 yrs out
- Wind 8/10 Severe 98% chance of damaging wind over 30 yrs
- Air quality 1/10 Low 0 unhealthy d/yr today · 0 by 30 yrs out
Nearby sold comps map
Loading sold comps map…
Walkable amenities ~0.75 mi
Loading nearby amenities…
Taxation est. · year 1
- Rental income
- $17,700
- − Mortgage interest
- −$3,361
- − Property taxes
- −$1,007
- − Insurance
- −$300
- − Repairs & maintenance
- −$1,416
- − Management
- −$1,416
- − Depreciation
- −$1,745
- Taxable income
- $8,455
- Est. tax owed @ 24.0%
- −$2,029
- After-tax cash flow
- $6,871/yr
For passive investors: Depreciation is non-cash, so a rental often shows a tax loss while cash-flowing — sheltering income. Rental losses are passive: they offset passive income freely, and up to $25,000/yr can offset ordinary (W-2) income if you actively participate and your MAGI is under $100k (phasing out to $0 by $150k); unused losses carry forward. On sale, claimed depreciation is recaptured at up to 25%, and gains may owe capital-gains tax (a 1031 exchange can defer both). Figures are a year-1 estimate at your 24.0% rate — not tax advice; consult a CPA.
Schools (NCES district)
- District
- Laurel School District
- NCES district ID
- 2802460
- Math proficiency
- 16% ▼ -11.00%
- Reading proficiency
- 18% ▼ -4.00%
- Median HH income
- $28,415
- Composite
- 13.36/100
- National rank
- #9535
- State rank
- #101 of 130 in MS
Livability — Laurel
- Score
- 66/100
- State rank
- #92
- US rank
- #11413
Category grades
Schools grade is shown separately in the Schools card above.
Census & demographics
- Census place
- Laurel, MS
- City population
- 20,111
- Population (ZIP)
- 20,111
Population outlook (Jones County) Hauer SSP2
- Today (2025)
- 68,800 people
- By 2030
- 68,773 · +-0.0%
- By 2040
- 68,087 · -1.0%
- By 2050
- 66,241 · -3.7%
- By 2075
- 58,600 · -14.8%
- By 2100
- 45,744 · -33.5%
Race, ethnicity, and origin ACS 2023
- Neighborhood character
- Majority Black (63%)
- Race & ethnicity
- Black 63% White 30% Hispanic / Latino 6% Two or more races 3% Native American 1%
- Hispanic origin (detail)
- Mexican 5%
- Common ancestry
- Lithuanian 1% Slovak 1% Serbian 1%
- Foreign-born
- 3% · Canada
- Languages at home
- 94% English-only · Spanish 5%
Political lean MEDSL · Jones
- 2024 margin
- Solid R (+46.8) · D 26.2% · R 73.0%
- 2008→2024 swing
- -8.2pp toward R · 2008: -38.6pp · 2024: -46.8pp
- All cycles
- 2024: R+46.8 2020: R+42.2 2016: R+43.6 2012: R+38.2 2008: R+38.6
Not yet ingested
- Civics
- —
Market trends
- HPI YoY
- ▼ -104.63%
- Current HPI
- 126.2541
- Rent YoY
- —
- Metro
- —
- State GDP YoY
- —
- F500 in state
- 0
Price history
+140.0% since first listed5 events — show timeline
- 2026-06-04 Pending — HAAR
- 2026-05-27 Relisted — HAAR
- 2026-05-20 Pending — HAAR
- 2026-05-13 Listed $60,000 HAAR
- 2016-07-07 Sold (Public Records) $25,000 Public Records
Property tax history
+4.1%/yrLatest (2025): $1,007 · +8.1% YoY. Source: county tax records.
Cash-flow waterfall
monthlySold comps — $/sqft
last 12 mo · ≤1 miLoading sold comps…