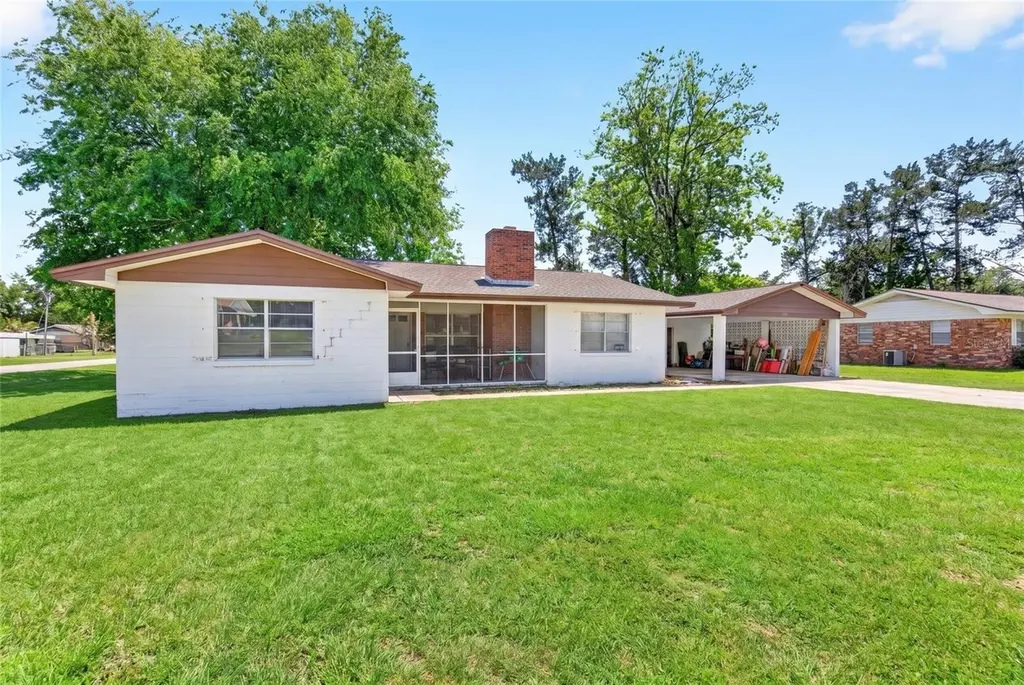
6174 SE 125th Pl · Belleview, FL
Flood risk 1/10 · Minimal
- FEMA flood zone
- X (unshaded)
- Chance of flooding over 30 yrs
- 0.0%
- Est. flood insurance / yr
- $507 – $1,088
Fire risk 3/10 · Minor
- Est. fire insurance / yr
- $947 – $1,759
Heat risk 8/10 · Major
- Hot days now (above 109°F)
- 7 days/yr
- Hot days in 30 yrs
- 21 days/yr
Wind risk 9/10 · Severe
- Chance of severe wind over 30 yrs
- 99.0%
Air-quality risk 3/10 · Minor
- Unhealthy air days now
- 2 days/yr
- Unhealthy air days in 30 yrs
- 2 days/yr
Risk factors via First Street. Map © Google.
Why this score? — see what drove the D grade
The composite is a weighted blend of 9 inputs, each scored 0–100. Each bar is that input's sub-score; the figure is the points it added to the 100-point composite (weight × sub-score).
- ARV discount +12.3/15.0
- Cash flow +11.3/30.0
- Schools +3.6/10.0
- Livability +3.5/5.0
- DSCR +3.3/10.0
- Rent growth +2.5/5.0
- Condition / age +2.5/5.0
- 1% rule +2.3/10.0
- Appreciation +0.0/10.0
$250,000
🖨 Deal sheet 📄 Offer letter ✓ Due diligence
Listing remarks
One or more photo(s) has been virtually staged. NO HOA, .32 ACRE LOT, Concrete Block home ready for your finishing touches! Home has 2022 30 year architectural shingle roof, 2025 Hvac, 2011 hot water heater, and kitchen has 2026 sink, refrigerator, oven, stove, and dishwasher. Electric updated as well as drain pipes. Covered entry leads to spacious living room needing floors finished(flooring on site), to left of the front door is the 2nd living or den, to right of living room is the dining area overlooking the kitchen and inside laundry room. 2nd and 3rd bedrooms share vintage tan bath with combo tub/shower, and vanity ready for updating but functional. primary sits in left back of home an
Key facts
- 0.32 acre lot
- Parking
- Built 1970
Property features AI
Finance
- HOA & community: No HOA association indicated; Pets not allowed
Exterior
- Parking: Driveway; 1-car carport
- Utilities: Public water; Septic tank sewer; Electricity connected
- Home design: Single family residence; One story; North-facing
- Construction: Brick and other exterior construction; Shingle roof; Slab foundation; Built with approximately 1,671 sq ft living area (public records)
- Exterior features: Paved road access; Other exterior features
Interior
- Kitchen: Dishwasher; Range; Refrigerator; Other appliances
- Bedrooms: 3 bedrooms
- Flooring: Carpet; Other flooring
- Bathrooms: 2 full bathrooms
- Heating & cooling: Central heating; Central air conditioning
- Interior features: Eat-in kitchen; Split bedroom layout; Thermostat; Window treatments; Wood-burning fireplace
- Laundry & utility: Laundry inside
Neighborhood map
What this means for you Summary
Snapshot
- This is a 3-bed/2.0-bath single-family listed at $250k.
Deal economics
- At list price, monthly cash flow is $-90 ($-1k/yr) — negative.
- To cash-flow at today's rent, offer at most $234k (6.3% below list).
- To meet the 1% rule (rent ≥ 1% of price), the offer needs to be $182k (27.2% below list).
- Recommended offer: $182k (27.2% below list) — sets the bar for 1% rule.
- Cap rate 5.9% vs local median 4.5% in Belleview — top-decile yield for the area; either an underpriced asset or a hidden risk that comps aren't pricing in. Stress-test before assuming the spread holds.
Location & tenants
- Location reads 69/100 on livability (#458 in FL) — a middle-class / working-renter tenant base. Strengths: cost of living A+, housing A+, health & safety A+; Watch: crime F, amenities F, commute F.
- Marion (rural): math 42% / reading 43% proficiency, ranked #61 of 73 in FL (top 84%) — families likely to look elsewhere, expect single-tenant / working-renter base with shorter leases; 61% free/reduced lunch — lower-income household profile, screen leases tightly.
- Zoned schools: Belleview Elementary School (math 48% / reading 44%, grade D-, #1,234 of 2,144 statewide, top 58%, 650 students, 73% FRL); Belleview High School (math 31% / reading 46%, grade F, #321 of 667 statewide, top 49%, 1,783 students, 56% FRL) — zoned schools at 65% FRL track the district average.
- Market conditions: 357 active listings in the ZIP; 7 comparable units currently listed for rent nearby; rentals at typical pace (median 21d on market — plan ~3-4 weeks tenant-placement turnaround); 7,071 units permitted in Marion County in 2024 (534 in 5+ unit buildings).
Forward outlook
- Local home prices are declining (-3.0%/yr); year-one equity from $2k of loan paydown is wiped out by about $8k of value loss. Plan a longer hold.
- Marion County population projected at +13% by 2050 — modest demand growth; plan on rents tracking national, not racing it.
Negotiation context
- It's been on market 56 days — a 3% lower offer ($242k) is reasonable based on typical stale-listing flexibility.
- 2 sale attempts since 5y ago with the ask held roughly flat each time — persistent listings suggest the price (not the market) is what's stuck; bring a comps-based counter.
- Current owner paid $83k; list at $250k implies a 202% gain — meaningful room to come down on a strong offer.
Risks & watch-outs
- Climate carrying-cost: severe wind risk, 99% chance of damaging wind over 30y; extreme-heat days projected 7→21/yr by 2055 (HVAC capex compounding) — expect insurance premiums to compound above CPI over the hold.
Questions for the listing agent
- What do current leases actually rent for vs. the listed asking? Can we see a recent rent roll and the last 12 months of T-12 income?
- It's been on market 56 days. Have you received any prior offers? Is the seller open to a 27% concession, seller financing, or rate buy-down credit?
- Built in 1970 — when were the roof, HVAC, electrical panel, plumbing, and water heater last replaced?
- Is there a deadline driving the sale (1031 exchange, divorce, estate, relocation)? That informs how much negotiation room exists.
- Schools are D-rated, which usually means shorter tenancies and higher turnover. Who's the typical renter profile here, and what's been the actual vacancy rate?
- Crime grade is F in this area — have there been break-ins, vandalism, or insurance claims at this property in the last 3 years? What carrier currently insures it and at what premium?
- The area grade is low — what's the realistic commute time and amenity access for the typical tenant pool here? Any planned neighborhood developments (good or bad) we should know about?
- What's the average days-on-market for RENTAL listings here right now (not sales)? A rising rental-DOM trend means longer vacancies and softer asking-rent achievability than the comps imply.
- What's the recent tenant-quality profile in this submarket — average credit score on applications, eviction rate, late-payment / NSF rate, and stable-employment percentage? A property-management company in the area should have these aggregated.
- How much new for-sale + rental construction is in the pipeline within 1–3 miles? Heavy new supply typically softens prices + rents 12–24 months out; constrained supply supports both.
Investment metrics
- 1% rule
- 0.73% ✗
- Cap rate
- 5.86%
- Cash-on-cash
- -1.53%
- DSCR
- 0.93
- GRM
- 11.5
CMA / ARV
- ARV (median comp)
- $279,699
- List price
- $250,000
- Delta
- -10.62%
- Verdict
- UNDERPRICED
- Comps
- 20 within 1.0 mi
Show comp detail 12 sales within ~0.75 mi
| Address | Dist | Beds/Ba | Sqft | Sold | Price | $/sf | Match |
|---|---|---|---|---|---|---|---|
| 6215 SE 125th Pl | 0.05mi | 3/2.0 | 1,519 (-9%) | 1mo | $166,240 | $109 | 82 |
| 12910 SE 58th Ct | 0.46mi | 3/2.0 | 1,685 (+1%) | 8mo | $255,000 | $151 | 71 |
| 5930 SE 126th St | 0.22mi | 3/2.5 | 1,676 (+0%) | 20mo | $295,000 | $176 | 70 |
| 12448 SE 60th Ave | 0.19mi | 3/2.0 | 1,562 (-6%) | 14mo | $255,000 | $163 | 68 |
| 6370 SE 127th Pl | 0.24mi | 3/2.0 | 1,512 (-10%) | 8mo | $282,000 | $187 | 66 |
| 10351 SE 126th St | 0.12mi | 3/2.0 | 1,464 (-12%) | 13mo | $252,000 | $172 | 63 |
| 12094 SE 60th Avenue Rd | 0.49mi | 3/2.0 | 1,509 (-10%) | 5mo | $387,000 | $256 | 57 |
| 12971 SE 55th Ave | 0.70mi | 4/2.0 (+1) | 1,715 (+3%) | 2mo | $280,900 | $164 | 56 |
| 6920 SE 123rd Pl | 0.65mi | 3/2.0 | 1,594 (-5%) | 14mo | $280,000 | $176 | 50 |
| 5432 SE 127th Ln | 0.72mi | 3/2.0 | 1,545 (-8%) | 11mo | $290,900 | $188 | 45 |
| 7020 SE 123rd Pl | 0.73mi | 3/2.0 | 1,478 (-12%) | 4mo | $287,900 | $195 | 43 |
| 5424 SE 127th Ln | 0.72mi | 4/2.0 (+1) | 1,819 (+9%) | 12mo | $305,900 | $168 | 37 |
Match score weights: distance 35% · size 25% · config 20% · recency 20%. Top-matched comps best support the ARV.
Projected returns pro-forma
-3.0% appreciation · 3.0% rent growth · sell at horizon
- IRR
- -18.9%
- Equity multiple
- 0.34×
- Total profit
- $-46,308
- Equity at exit
- $37,276
- IRR
- -11.5%
- Equity multiple
- 0.31×
- Total profit
- $-48,055
- Equity at exit
- $21,615
Cash invested: $70,000 (down + closing). Projections, not guarantees.
Landlord ↔ Tenant lean methodology
- Overall (STATE)
- 87 Strongly Landlord-Friendly
- State Florida
- 87 Strongly Landlord-Friendly · R+3
- County
- — inherits STATE
- City
- — inherits STATE
ZIP-level market 34420
- Home prices YoY
- -32.8%
- Active inventory
- 357
- Price-to-rent
- 11.5×
Monthly cashflow live
- Estimated rent
- $1,819 high interval (Pro) →
- Mortgage (P&I)
- −$1,311
- Tax from tax record
- −$112 /mo · $1,338/yr
- Insurance
- −$104
- HOA
- −$0
- Vacancy / Maint / Mgmt
- −$382
- Net cashflow
- $-90
Break-even live
UW: 25.0% down · 7.5% · 30yr · 1.5% tax · 5.0% vac · 8.0% maint · 8.0% mgmt
Financing live
Cash to close
- Down payment
- $62,500
- Closing costs
- $7,500
- Reserves months
- —
- Total cash needed
- —
Loan-product check · same deal, 3 products live
Conventional
25% down · 7.5% · 30yr
- Down + closing
- —
- Monthly P&I
- —
- Monthly cashflow
- —
- DSCR
- —
- Eligible?
- —
Personal DTI + credit; lowest rate.
DSCR
20% down · 8.5% · 30yr
- Down + closing
- —
- Monthly P&I
- —
- Monthly cashflow
- —
- DSCR
- —
- Eligible?
- —
No personal income docs; deal must DSCR.
Hard money
10% down · 12.0% · 12mo
- Down + closing
- —
- Monthly P&I
- —
- Monthly cashflow
- —
- DSCR
- —
- Eligible?
- —
Short-term bridge; refi at stabilization.
Rent comps 7 comps
| Address | Beds | Baths | Sqft | Rent | $/sqft | DOM | Units | Dist |
|---|---|---|---|---|---|---|---|---|
| 6849 SE 123rd Pl Belleview, FL | 3.0 | 2.0 | 1305 | $1,950 | $1.49 | 13d | 1 | 0.58mi |
| 6920 SE 123rd Pl Belleview, FL | 3.0 | 2.0 | 1571 | $1,850 | $1.18 | 13d | 1 | 0.62mi |
| 5890 SE 119th Pl Belleview, FL | 3.0 | 2.0 | 1144 | $1,449 | $1.27 | 21d | 1 | 0.64mi |
| 12325 SE 72 Ave Belleview, FL | 3.0 | 2.0 | 1238 | $1,600 | $1.29 | 21d | 1 | 0.91mi |
| 13609 SE 53rd Ave Summerfield, FL | 3.0 | 2.0 | 1270 | $1,940 | $1.53 | 21d | 1 | 1.33mi |
| 13705 SE 54th Ct Summerfield, FL | 3.0 | 2.0 | 1416 | $1,895 | $1.34 | 21d | 1 | 1.34mi |
| 7208 SE 113th Pl Belleview, FL | 4.0 | 2.0 | 1828 | $2,200 | $1.20 | 21d | 1 | 1.47mi |
Listing history 21 events
-
2026-06-18days on market $250,000 Active 56 DOM
-
2026-06-17days on market $250,000 Active 55 DOM
-
2026-06-16days on market $250,000 Active 54 DOM
-
2026-06-15days on market $250,000 Active 53 DOM
-
2026-06-14days on market $250,000 Active 51 DOM
-
2026-06-13days on market $250,000 Active 50 DOM
-
2026-06-10days on market $250,000 Active 48 DOM
-
2026-06-09days on market $250,000 Active 47 DOM
-
2026-06-08days on market $250,000 Active 46 DOM
-
2026-06-07days on market $250,000 Active 45 DOM
-
2026-06-03days on market $250,000 Active 41 DOM
-
2026-06-02days on market $250,000 Active 40 DOM
-
2026-06-01days on market $250,000 Active 39 DOM
-
2026-05-31days on market $250,000 Active 38 DOM
-
2026-05-30days on market $250,000 Active 37 DOM
-
2026-04-23$250,000 Active 1287-char remark
-
2021-10-13historical
-
2021-10-12price $153,000
-
2021-10-08$160,000 Active
-
2002-01-04soldstatus $82,700
-
1998-04-24soldstatus $74,900
ⓘ Source: listings_history table (triggers on properties + properties_extension) + one-shot
backfill from property_details.listing_events for pre-trigger history.
Tax reassessment forecast FL · Resets to sale price
- Current annual tax
- $1,338 · $112/mo
- Projected year-2 tax
- $2,075 · $173/mo
- Expected delta
- +$737/yr (+$61/mo · 55.0%)
ⓘ Screening estimate from a state-policy table — verify with the county assessor before closing.
Climate risk First Street
- Flood 1/10 Low FEMA zone X (unshaded) · 0% chance over 30 yrs
- Wildfire 3/10 Moderate
- Heat 8/10 Severe 7 d/yr ≥109°F today · 21 d/yr by 30 yrs out
- Wind 9/10 Extreme 99% chance of damaging wind over 30 yrs
- Air quality 3/10 Moderate 2 unhealthy d/yr today · 2 by 30 yrs out
Nearby sold comps map
Loading sold comps map…
Walkable amenities ~0.75 mi
Loading nearby amenities…
Taxation est. · year 1
- Rental income
- $21,831
- − Mortgage interest
- −$14,004
- − Property taxes
- −$1,338
- − Insurance
- −$1,250
- − Repairs & maintenance
- −$1,746
- − Management
- −$1,746
- − Depreciation
- −$7,273
- Taxable loss
- −$5,527
- Est. tax savings @ 24.0%
- +$1,326
- After-tax cash flow
- $252/yr
For passive investors: Depreciation is non-cash, so a rental often shows a tax loss while cash-flowing — sheltering income. Rental losses are passive: they offset passive income freely, and up to $25,000/yr can offset ordinary (W-2) income if you actively participate and your MAGI is under $100k (phasing out to $0 by $150k); unused losses carry forward. On sale, claimed depreciation is recaptured at up to 25%, and gains may owe capital-gains tax (a 1031 exchange can defer both). Figures are a year-1 estimate at your 24.0% rate — not tax advice; consult a CPA.
Schools (NCES district)
- District
- Marion
- NCES district ID
- 1201260
- Math proficiency
- 42% ▼ -7.00%
- Reading proficiency
- 43% ▼ -4.00%
- Median HH income
- $40,015
- Composite
- 35.61/100
- National rank
- #4890
- State rank
- #61 of 73 in FL
Livability — Belleview
- Score
- 69/100
- State rank
- #458
- US rank
- #8314
Category grades
Schools grade is shown separately in the Schools card above.
Census & demographics
- City population
- 19,167
- Population (ZIP)
- 19,167
Population outlook (Marion County) Hauer SSP2
- Today (2025)
- 365,905 people
- By 2030
- 376,768 · +3.0%
- By 2040
- 396,555 · +8.4%
- By 2050
- 412,723 · +12.8%
- By 2075
- 446,090 · +21.9%
- By 2100
- 436,193 · +19.2%
Race, ethnicity, and origin ACS 2023
- Neighborhood character
- Predominantly White (81%)
- Race & ethnicity
- White 81% Hispanic / Latino 12% Two or more races 10% Black 1%
- Hispanic origin (detail)
- Puerto Rican 7% Cuban 2%
- Common ancestry
- Lithuanian 4% Iranian 2% Romanian 2%
- Foreign-born
- 5% · Canada, Jamaica
- Languages at home
- 89% English-only · Spanish 7% Other Indo-European 2% German/W. Germanic 1%
Political lean MEDSL · Marion
- 2024 margin
- Solid R (+31.6) · D 33.8% · R 65.5%
- 2008→2024 swing
- -20.0pp toward R · 2008: -11.6pp · 2024: -31.6pp
- All cycles
- 2024: R+31.6 2020: R+25.9 2016: R+26.2 2012: R+16.2 2008: R+11.6
Not yet ingested
- Civics
- —
Market trends
- HPI YoY
- ▼ -120.90%
- Current HPI
- 247.3176
- Rent YoY
- —
- Metro
- —
- State GDP YoY
- ▲ 3.28%
- F500 in state
- 36
Industry mix (Fortune 500 HQ in FL)
| Industry | F500 HQs | Revenue |
|---|---|---|
| Industrial Technology | 2 | $29B |
|
||
| Insurance | 2 | $17B |
|
||
| Retail | 1 | $60B |
|
||
| Technology Distribution | 1 | $58B |
|
||
| Homebuilding | 1 | $35B |
|
||
| Technology Manufacturing | 1 | $35B |
|
||
Price history
+233.8% since first listed6 events — show timeline
- 2026-04-23 Listed $250,000 Stellar MLS as Distributed by MLS Grid
- 2021-10-13 Listing Removed — Stellar MLS as Distributed by MLS Grid
- 2021-10-12 Price Changed $153,000 Stellar MLS as Distributed by MLS Grid
- 2021-10-08 Listed $160,000 Stellar MLS as Distributed by MLS Grid
- 2002-01-04 Sold (Public Records) $82,700 Public Records
- 1998-04-24 Sold (Public Records) $74,900 Public Records
Property tax history
-0.4%/yrLatest (2025): $1,338 · +21.3% YoY. Source: county tax records.
Cash-flow waterfall
monthlySold comps — $/sqft
last 12 mo · ≤1 miLoading sold comps…