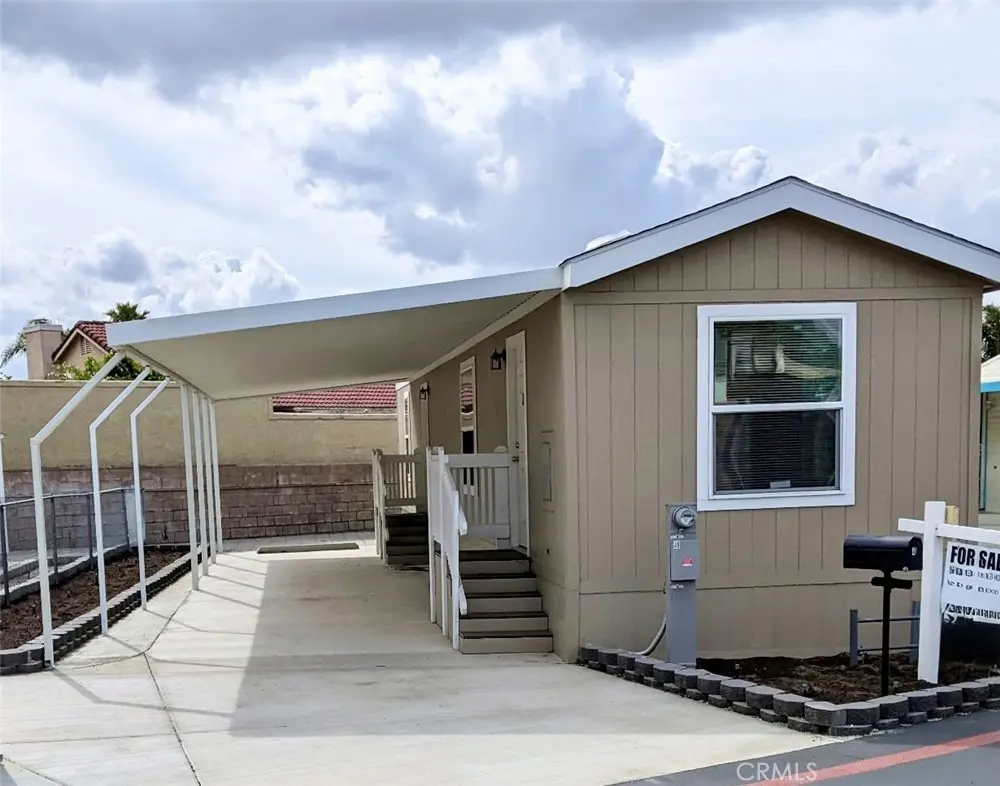
17455 Marygold Ave #49 · Fontana, CA
Flood risk 1/10 · Minimal
- FEMA flood zone
- X (unshaded)
- Chance of flooding over 30 yrs
- 0.0%
- Est. flood insurance / yr
- $507 – $1,088
Fire risk 1/10 · Minimal
- Est. fire insurance / yr
- $659 – $1,223
Heat risk 8/10 · Major
- Hot days now (above 103°F)
- 7 days/yr
- Hot days in 30 yrs
- 18 days/yr
Wind risk 1/10 · Minimal
- Chance of severe wind over 30 yrs
- —
Air-quality risk 10/10 · Severe
- Unhealthy air days now
- 27 days/yr
- Unhealthy air days in 30 yrs
- 32 days/yr
Risk factors via First Street. Map © Google.
Why this score? — see what drove the B- grade
The composite is a weighted blend of 9 inputs, each scored 0–100. Each bar is that input's sub-score; the figure is the points it added to the 100-point composite (weight × sub-score).
- Cash flow +30.0/30.0
- DSCR +10.0/10.0
- 1% rule +9.5/10.0
- ARV discount +7.5/15.0
- Condition / age +4.0/5.0
- Livability +3.2/5.0
- Rent growth +2.5/5.0
- Schools +2.4/10.0
- Appreciation +0.0/10.0
$119,000
🖨 Deal sheet 📄 Offer letter ✓ Due diligence
Listing remarks MLS
Welcome to easy, relaxed living in this brand new 2025 manufactured home located in a friendly 55+ community! This 1 bedroom, 1 bath home is move-in ready and perfect if you’re looking for something simple, comfortable, and low-maintenance. This home offers an open floor plan, a large sized bedroom, and a separate laundry room with a closet for extra storage. Also featured are dual pane windows for comfort and energy efficiency. Additional highlights include a covered carport along with great community amenities like a pool, clubhouse, and a dog park. Conveniently located near Kaiser hospital, as well as nearby shopping and restaurants, this home offers both comfort and accessibility. As an added peace of mind, the home comes with a 1-year manufacturer’s warranty. It’s a great chance to enjoy a fresh, new home in a welcoming community!
Key facts
- Open floor plan
- Covered carport
- Community amenities
Tags
Neighborhood map
What this means for you Summary
Snapshot
- This is a 1-bed/1.0-bath manufactured listed at $119k. Condition is rated good.
Deal economics
- At list price, monthly cash flow is $538 ($6k/yr) — positive.
- The deal already cash-flows at list — no discount required.
- Meets the 1% rule at list price ($2k rent vs $119k).
- Recommended offer: $112k (6.0% below list) — sets the bar for market timing.
- Cap rate 11.7% vs local median 3.2% in Fontana — top-decile yield for the area; either an underpriced asset or a hidden risk that comps aren't pricing in. Stress-test before assuming the spread holds.
Location & tenants
- Location reads 64/100 on livability (#415 in CA) — a middle-class / working-renter tenant base. Strengths: housing A+, commute A-, employment A-; Watch: schools F, amenities F, cost of living F.
- Colton Joint Unified (suburban): math 16% / reading 38% proficiency, ranked #373 of 517 in CA (top 72%) — low school quality limits family demand, transient renter base, plan for 1-2y turnover; 70% free/reduced lunch — lower-income household profile, screen leases tightly.
- Market conditions: 44 active listings in the ZIP; 4 comparable units currently listed for rent nearby; rentals lingering (median 44d on market — plan ~5-8 weeks vacancy on turnover, expect pricing pressure); 50% of comp listings sitting > 30 days — soft ceiling on asking rent; 5,458 units permitted in San Bernardino County in 2024 (1,500 in 5+ unit buildings).
Forward outlook
- Local home prices are declining (-3.0%/yr); year-one equity from $823 of loan paydown is wiped out by about $4k of value loss. Plan a longer hold.
- San Bernardino County population projected at +15% by 2050 — modest demand growth; plan on rents tracking national, not racing it.
- At projected returns (-3.0% appreciation + 3.0% rent growth), your $33k cash investment doubles in ~7 years — after that, you're playing with house money.
Negotiation context
- It's been on market 62 days — a 6% lower offer ($112k) is reasonable based on typical stale-listing flexibility.
- 2 sale attempts with the ask held roughly flat each time — persistent listings suggest the price (not the market) is what's stuck; bring a comps-based counter.
Risks & watch-outs
- Climate carrying-cost: extreme-heat days projected 7→18/yr by 2055 (HVAC capex compounding) — expect insurance premiums to compound above CPI over the hold.
Questions for the listing agent
- It's been on market 62 days. Have you received any prior offers? Is the seller open to a 6% concession, seller financing, or rate buy-down credit?
- Why hasn't it sold? Are there any deal-killer items the seller is aware of (foundation, flood, title, zoning, code violations)?
- Is there a deadline driving the sale (1031 exchange, divorce, estate, relocation)? That informs how much negotiation room exists.
- Schools are F-rated, which usually means shorter tenancies and higher turnover. Who's the typical renter profile here, and what's been the actual vacancy rate?
- What's the average days-on-market for RENTAL listings here right now (not sales)? A rising rental-DOM trend means longer vacancies and softer asking-rent achievability than the comps imply.
- What's the recent tenant-quality profile in this submarket — average credit score on applications, eviction rate, late-payment / NSF rate, and stable-employment percentage? A property-management company in the area should have these aggregated.
- How much new for-sale + rental construction is in the pipeline within 1–3 miles? Heavy new supply typically softens prices + rents 12–24 months out; constrained supply supports both.
Investment metrics
- 1% rule
- 1.45% ✓
- Cap rate
- 11.72%
- Cash-on-cash
- 19.37%
- DSCR
- 1.86
- GRM
- 5.8
CMA / ARV
- ARV (median comp)
- $78,521
- List price
- $119,000
- Delta
- 51.55%
- Verdict
- OVERPRICED
- Comps
- 2 within 1.0 mi
Show comp detail 3 sales within ~0.75 mi
| Address | Dist | Beds/Ba | Sqft | Sold | Price | $/sf | Match |
|---|---|---|---|---|---|---|---|
| 17333 Valley Blvd Unit 140E | 0.25mi | 2/1.0 (+1) | 720 (+7%) | 8mo | $58,000 | $81 | 65 |
| 17225 Valley Blvd Unit 58W | 0.41mi | 2/1.0 (+1) | 660 (-2%) | 18mo | $103,000 | $156 | 58 |
| 17225 Valley Blvd Unit 17F | 0.35mi | 2/1.0 (+1) | 720 (+7%) | 17mo | $120,000 | $167 | 52 |
Match score weights: distance 35% · size 25% · config 20% · recency 20%. Top-matched comps best support the ARV.
Projected returns pro-forma
-3.0% appreciation · 3.0% rent growth · sell at horizon
- IRR
- 11.4%
- Equity multiple
- 1.45×
- Total profit
- $15,006
- Equity at exit
- $17,743
- IRR
- 20.4%
- Equity multiple
- 2.72×
- Total profit
- $57,292
- Equity at exit
- $10,289
Cash invested: $33,320 (down + closing). Projections, not guarantees.
Landlord ↔ Tenant lean methodology
- Overall (STATE)
- 18 Strongly Tenant-Friendly
- State California
- 18 Strongly Tenant-Friendly · D+13
- County
- — inherits STATE
- City
- — inherits STATE
ZIP-level market 92316
- Home prices YoY
- -34.1%
- Active inventory
- 44
- Price-to-rent
- 5.8×
Monthly cashflow live
- Estimated rent
- $1,722 medium interval (Pro) →
- Mortgage (P&I)
- −$624
- Tax est. 1.5%
- −$149 /mo · $1,785/yr
- Insurance
- −$50
- HOA
- −$0
- Vacancy / Maint / Mgmt
- −$362
- Net cashflow
- $538
Break-even live
UW: 25.0% down · 7.5% · 30yr · 1.5% tax · 5.0% vac · 8.0% maint · 8.0% mgmt
Financing live
Cash to close
- Down payment
- $29,750
- Closing costs
- $3,570
- Reserves months
- —
- Total cash needed
- —
Loan-product check · same deal, 3 products live
Conventional
25% down · 7.5% · 30yr
- Down + closing
- —
- Monthly P&I
- —
- Monthly cashflow
- —
- DSCR
- —
- Eligible?
- —
Personal DTI + credit; lowest rate.
DSCR
20% down · 8.5% · 30yr
- Down + closing
- —
- Monthly P&I
- —
- Monthly cashflow
- —
- DSCR
- —
- Eligible?
- —
No personal income docs; deal must DSCR.
Hard money
10% down · 12.0% · 12mo
- Down + closing
- —
- Monthly P&I
- —
- Monthly cashflow
- —
- DSCR
- —
- Eligible?
- —
Short-term bridge; refi at stabilization.
Rent comps 4 comps
| Address | Beds | Baths | Sqft | Rent | $/sqft | DOM | Units | Dist |
|---|---|---|---|---|---|---|---|---|
| 17237 Deodar Ave Unit Adu Fontana, CA | 1.0 | 1.0 | 450 | $1,800 | $4.00 | 43d | 1 | 0.42mi |
| 16982 San Bernardino Ave Fontana, CA | 1.0 | 1.0 | 586 | $1,700 | $2.90 | 43d | 1 | 0.63mi |
| 8998 Mango Ave Unit I Fontana, CA | 1.0 | 1.0 | 692 | $1,650 | $2.38 | 22d | 1 | 1.28mi |
| 8919 Mango Ave Fontana, CA | 1.0 | 1.0 | 500 | $1,650 | $3.30 | 15d | 2 | 1.34mi |
Listing history 17 events
-
2026-06-18days on market $119,000 Active 62 DOM
-
2026-06-17days on market $119,000 Active 61 DOM
-
2026-06-16days on market $119,000 Active 60 DOM
-
2026-06-15days on market $119,000 Active 59 DOM
-
2026-06-13days on market $119,000 Active 57 DOM
-
2026-06-13days on market $119,000 Active 56 DOM
-
2026-06-09days on market $119,000 Active 53 DOM
-
2026-06-08days on market $119,000 Active 52 DOM
-
2026-06-07days on market $119,000 Active 51 DOM
-
2026-06-04days on market $119,000 Active 48 DOM
-
2026-06-03days on market $119,000 Active 47 DOM
-
2026-06-02days on market $119,000 Active 46 DOM
-
2026-06-01days on market $119,000 Active 45 DOM
-
2026-05-31days on market $119,000 Active 44 DOM
-
2026-04-16$119,000 Active 865-char remark
Show marketing remark (865 chars)
Welcome to easy, relaxed living in this brand new 2025 manufactured home located in a friendly 55+ community! This 1 bedroom, 1 bath home is move-in ready and perfect if you’re looking for something simple, comfortable, and low-maintenance. This home offers an open floor plan, a large sized bedroom, and a separate laundry room with a closet for extra storage. Also featured are dual pane windows for comfort and energy efficiency. Additional highlights include a covered carport along with great community amenities like a pool, clubhouse, and a dog park. Conveniently located near Kaiser hospital, as well as nearby shopping and restaurants, this home offers both comfort and accessibility. As an added peace of mind, the home comes with a 1-year manufacturer’s warranty. It’s a great chance to enjoy a fresh, new home in a welcoming community!
-
2026-03-06historical
-
2026-01-28$119,900 Active
ⓘ Source: listings_history table (triggers on properties + properties_extension) + one-shot
backfill from property_details.listing_events for pre-trigger history.
Climate risk First Street
- Flood 1/10 Low FEMA zone X (unshaded) · 0% chance over 30 yrs
- Wildfire 1/10 Low
- Heat 8/10 Severe 7 d/yr ≥103°F today · 18 d/yr by 30 yrs out
- Wind 1/10 Low
- Air quality 10/10 Extreme 27 unhealthy d/yr today · 32 by 30 yrs out
Nearby sold comps map
Loading sold comps map…
Walkable amenities ~0.75 mi
Loading nearby amenities…
Taxation est. · year 1
- Rental income
- $20,664
- − Mortgage interest
- −$6,666
- − Property taxes
- −$1,785
- − Insurance
- −$595
- − Repairs & maintenance
- −$1,653
- − Management
- −$1,653
- − Depreciation
- −$3,462
- Taxable income
- $4,850
- Est. tax owed @ 24.0%
- −$1,164
- After-tax cash flow
- $5,292/yr
For passive investors: Depreciation is non-cash, so a rental often shows a tax loss while cash-flowing — sheltering income. Rental losses are passive: they offset passive income freely, and up to $25,000/yr can offset ordinary (W-2) income if you actively participate and your MAGI is under $100k (phasing out to $0 by $150k); unused losses carry forward. On sale, claimed depreciation is recaptured at up to 25%, and gains may owe capital-gains tax (a 1031 exchange can defer both). Figures are a year-1 estimate at your 24.0% rate — not tax advice; consult a CPA.
Condition & rehab AI · 12 photos
This move-in ready manufactured home is in excellent condition with new finishes and features, making it an attractive option for both resale and rental.
Value-add opportunities
- Both Landscaping and curb appeal — Enhances curb appeal and resale value.
- Both New flooring in living areas — Improves aesthetics and adds value.
- Both New paint — Freshens the interior and enhances curb appeal.
Renovation cost estimate screening
Value-add ROI direction
- Both Landscaping and curb appeal — Enhances curb appeal and resale value. ↑
- Both New flooring in living areas — Improves aesthetics and adds value. ↑
- Both New paint — Freshens the interior and enhances curb appeal. ↑
ⓘ Cost ranges are severity-bucket heuristics (US national rule-of-thumb). Get contractor quotes + a written scope before underwriting a rehab budget.
Schools (NCES district)
- District
- Colton Joint Unified
- NCES district ID
- 0609390
- Math proficiency
- 16% ▼ -9.00%
- Reading proficiency
- 38% ▼ -1.00%
- Median HH income
- $51,178
- Composite
- 23.74/100
- National rank
- #7820
- State rank
- #373 of 517 in CA
Livability — Fontana
- Score
- 64/100
- State rank
- #415
- US rank
- #14177
Category grades
Schools grade is shown separately in the Schools card above.
Census & demographics
- Census place
- Fontana, CA
- City population
- 203,028
- Population (ZIP)
- 31,909
Population outlook (San Bernardino County) Hauer SSP2
- Today (2025)
- 2,300,329 people
- By 2030
- 2,378,907 · +3.4%
- By 2040
- 2,523,137 · +9.7%
- By 2050
- 2,642,388 · +14.9%
- By 2075
- 2,880,769 · +25.2%
- By 2100
- 2,909,436 · +26.5%
Race, ethnicity, and origin ACS 2023
- Neighborhood character
- Predominantly Hispanic (82%)
- Race & ethnicity
- Hispanic / Latino 82% Two or more races 24% White 12% Black 3% Native American 2%
- Hispanic origin (detail)
- Mexican 76%
- Common ancestry
- Italian 1% Lithuanian 1%
- Foreign-born
- 25% · Canada, Jamaica
- Languages at home
- 34% English-only · Spanish 64% Arabic 1%
Political lean MEDSL · San Bernardino
- 2024 margin
- Toss-up / Even · D 47.5% · R 49.7% · Other 2.8%
- 2008→2024 swing
- -8.5pp toward R · 2008: 6.3pp · 2024: -2.1pp
- All cycles
- 2024: R+2.1 2020: D+10.7 2016: D+9.8 2012: D+5.4 2008: D+6.3
Not yet ingested
- Civics
- —
Market trends
- HPI YoY
- ▼ -250.05%
- Current HPI
- 483.5611
- Rent YoY
- —
- Metro
- —
- State GDP YoY
- ▲ 3.21%
- F500 in state
- 116
Industry mix (Fortune 500 HQ in CA)
| Industry | F500 HQs | Revenue |
|---|---|---|
| Technology | 27 | $1,492B |
|
||
| Financial Services | 3 | $174B |
|
||
| Retail | 3 | $44B |
|
||
| Insurance | 3 | $26B |
|
||
| Media / Entertainment | 2 | $115B |
|
||
| Pharmaceuticals / Biotech | 2 | $62B |
|
||
Price history
-0.8% since first listed3 events — show timeline
- 2026-04-16 Listed $119,000 CRMLS
- 2026-03-06 Listing Removed — CRMLS
- 2026-01-28 Listed $119,900 CRMLS
Cash-flow waterfall
monthlySold comps — $/sqft
last 12 mo · ≤1 miLoading sold comps…