1216 Primrose Ter · Selma, AL
Flood risk 1/10 · Minimal
- FEMA flood zone
- X (unshaded)
- Chance of flooding over 30 yrs
- 0.0%
- Est. flood insurance / yr
- $507 – $1,088
Fire risk 4/10 · Minor
- Est. fire insurance / yr
- $916 – $1,700
Heat risk 8/10 · Major
- Hot days now (above 108°F)
- 7 days/yr
- Hot days in 30 yrs
- 20 days/yr
Wind risk 8/10 · Major
- Chance of severe wind over 30 yrs
- 80.0%
Air-quality risk 2/10 · Minimal
- Unhealthy air days now
- 0 days/yr
- Unhealthy air days in 30 yrs
- 1 days/yr
Risk factors via First Street. Map © Google.
Why this score? — see what drove the B- grade
The composite is a weighted blend of 9 inputs, each scored 0–100. Each bar is that input's sub-score; the figure is the points it added to the 100-point composite (weight × sub-score).
- Cash flow +25.8/30.0
- Appreciation +10.0/10.0
- DSCR +8.6/10.0
- ARV discount +7.5/15.0
- 1% rule +5.9/10.0
- Livability +2.8/5.0
- Rent growth +2.5/5.0
- Condition / age +2.5/5.0
- Schools +0.9/10.0
$85,000
🖨 Deal sheet 📄 Offer letter ✓ Due diligence
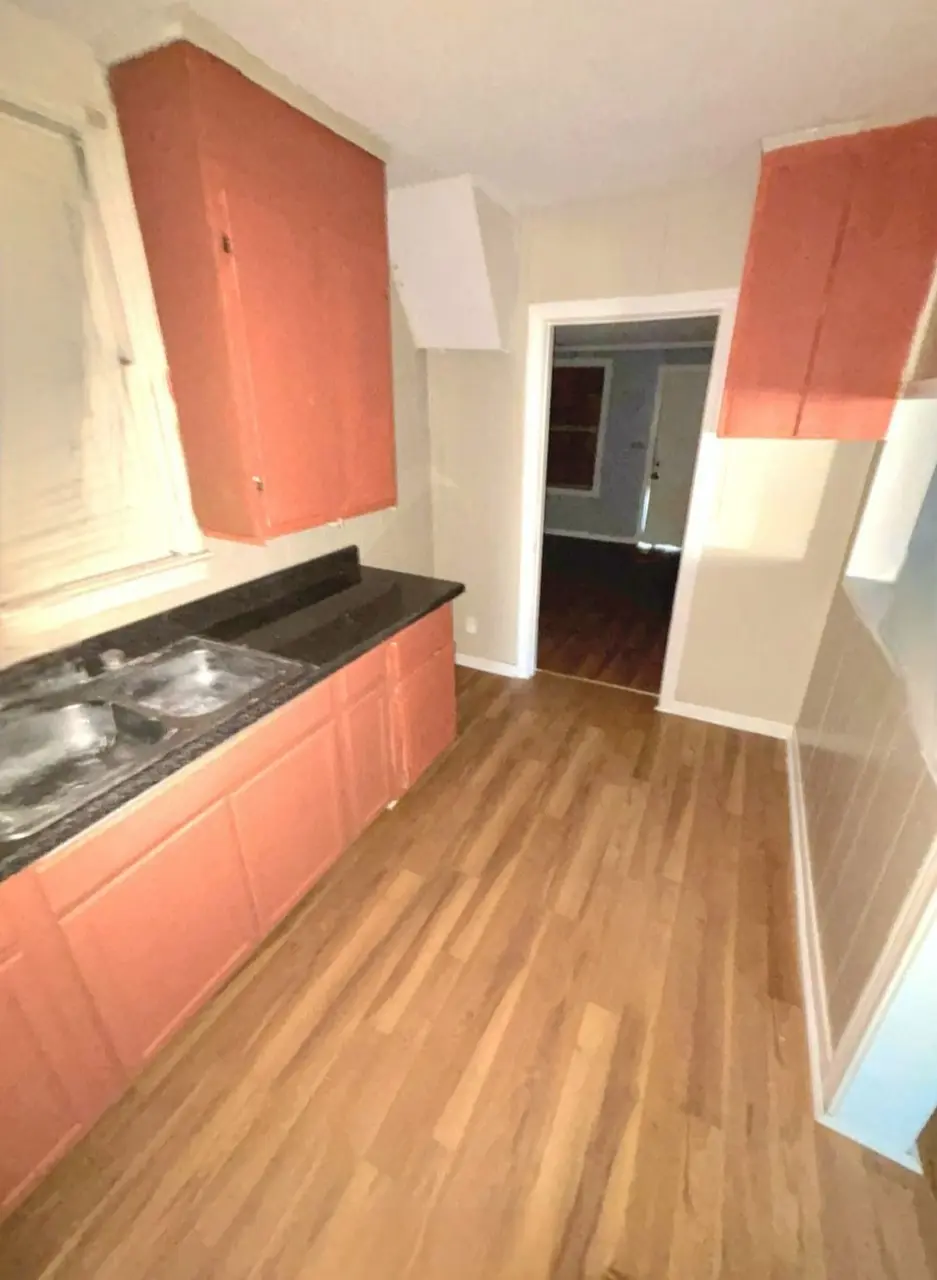
Listing remarks MLS
Someone is going to get a great opportunity on this house!! Maybe its you? Owner financing, no credit needed! A solid, spacious home ready for the right person or family who wants the chance to own instead of rent. Just one block from school and shopping, making it a convenient location for everyday living. 3 Bedrooms 1.5 Bathrooms Beautiful wood floors Cozy fireplace Separate dining room Flex room / den for office, playroom, or extra. living space Central heat Move-in condition 1-Year AHS Home Warranty Included Covers furnace, plumbing, and electrical Simple Path to Homeownership $2,000 Down payment $875 per month Price: $85,000 Bank financing not required Challenged credit OK No background checks Home sold AS-IS Text 757-550-1193 to schedule a walk-through Total investnent to move-in needed: $2,500
Key facts
- 8,305 sq ft lot
- Built 1940
- Listed 102 days
Neighborhood map
What this means for you Summary
Snapshot
- This is a 3-bed/1.5-bath single-family listed at $85k.
Deal economics
- At list price, monthly cash flow is $205 ($2k/yr) — positive.
- The deal already cash-flows at list — no discount required.
- Meets the 1% rule at list price ($929 rent vs $85k).
- Recommended offer: $77k (9.0% below list) — sets the bar for market timing.
- Cap rate 9.2% vs local median 7.5% in Selma — meaningfully above typical; check what's discounted (condition, days-on-market, listing class) to confirm the premium yield is real.
Location & tenants
- Location reads 56/100 on livability (#407 in AL) — a working-class tenant base; expect higher turnover. Strengths: cost of living A+, housing B; Watch: schools F, crime F, amenities F.
- Selma City (town): math 2% / reading 23% proficiency, ranked #118 of 129 in AL (top 92%) — low school quality limits family demand, transient renter base, plan for 1-2y turnover; 84% free/reduced lunch — lower-income household profile, screen leases tightly.
- Market conditions: 52 active listings in the ZIP; 1 comparable units currently listed for rent nearby; 7 units permitted in Dallas County in 2024 (0 in 5+ unit buildings).
Forward outlook
- In year one you build about $9k of equity ($588 loan paydown + $8k appreciation (10.0% local appreciation)).
- Dallas County population projected at -36% by 2050 — secular population decline; favor cash flow + early exit over multi-decade hold.
- At projected returns (10.0% appreciation + 3.0% rent growth), your $24k cash investment doubles in ~2 years — after that, you're playing with house money.
- By year 4, paydown + projected appreciation supports a ~$32k cash-out refi (75% LTV) — recoverable capital for the next deal without selling this one.
Negotiation context
- It's been on market 102 days — a 9% lower offer ($77k) is reasonable based on typical stale-listing flexibility.
- 2 sale attempts; this cycle's ask is 9900% above the opening price — seller raised mid-cycle; expect resistance to lowballs.
Risks & watch-outs
- Watch-outs: built in 1940 — expect roof / HVAC / electrical / plumbing capex.
- Climate carrying-cost: severe wind risk, 80% chance of damaging wind over 30y; extreme-heat days projected 7→20/yr by 2055 (HVAC capex compounding) — expect insurance premiums to compound above CPI over the hold.
Questions for the listing agent
- It's been on market 102 days. Have you received any prior offers? Is the seller open to a 9% concession, seller financing, or rate buy-down credit?
- Built in 1940 — when were the roof, HVAC, electrical panel, plumbing, and water heater last replaced?
- Why hasn't it sold? Are there any deal-killer items the seller is aware of (foundation, flood, title, zoning, code violations)?
- Is there a deadline driving the sale (1031 exchange, divorce, estate, relocation)? That informs how much negotiation room exists.
- Schools are F-rated, which usually means shorter tenancies and higher turnover. Who's the typical renter profile here, and what's been the actual vacancy rate?
- Crime grade is F in this area — have there been break-ins, vandalism, or insurance claims at this property in the last 3 years? What carrier currently insures it and at what premium?
- What's the average days-on-market for RENTAL listings here right now (not sales)? A rising rental-DOM trend means longer vacancies and softer asking-rent achievability than the comps imply.
- What's the recent tenant-quality profile in this submarket — average credit score on applications, eviction rate, late-payment / NSF rate, and stable-employment percentage? A property-management company in the area should have these aggregated.
- How much new for-sale + rental construction is in the pipeline within 1–3 miles? Heavy new supply typically softens prices + rents 12–24 months out; constrained supply supports both.
Investment metrics
- 1% rule
- 1.09% ✓
- Cap rate
- 9.19%
- Cash-on-cash
- 10.36%
- DSCR
- 1.46
- GRM
- 7.6
CMA / ARV
- ARV (median comp)
- $46,882
- List price
- $85,000
- Delta
- 81.31%
- Verdict
- OVERPRICED
- Comps
- 20 within 1.0 mi
Show comp detail 4 sales within ~0.75 mi
| Address | Dist | Beds/Ba | Sqft | Sold | Price | $/sf | Match |
|---|---|---|---|---|---|---|---|
| 1005 La Dayne Ave | 0.69mi | 3/1.5 | 1,257 (+0%) | 21mo | $110,000 | $88 | 50 |
| 802 2nd Ave | 0.66mi | 3/2.0 | 1,122 (-11%) | 6mo | $5,750 | $5 | 45 |
| 519 Columbus Dr | 0.74mi | 3/2.0 | 1,398 (+11%) | 11mo | $132,000 | $94 | 35 |
| 521 Third Ave | 0.70mi | 2/1.0 (-1) | 1,074 (-14%) | 6mo | $10,000 | $9 | 31 |
Match score weights: distance 35% · size 25% · config 20% · recency 20%. Top-matched comps best support the ARV.
Projected returns pro-forma
10.0% appreciation · 3.0% rent growth · sell at horizon
- IRR
- 31.9%
- Equity multiple
- 3.49×
- Total profit
- $59,359
- Equity at exit
- $76,575
- IRR
- 27.5%
- Equity multiple
- 7.91×
- Total profit
- $164,467
- Equity at exit
- $165,136
Cash invested: $23,800 (down + closing). Projections, not guarantees.
Landlord ↔ Tenant lean methodology
- Overall (STATE)
- 90 Strongly Landlord-Friendly
- State Alabama
- 90 Strongly Landlord-Friendly · R+15
- County
- — inherits STATE
- City
- — inherits STATE
ZIP-level market 36703
- Home prices YoY
- 13.2%
- Active inventory
- 52
- Price-to-rent
- 7.6×
Monthly cashflow live
- Estimated rent
- $929 medium interval (Pro) →
- Mortgage (P&I)
- −$446
- Tax from tax record
- −$47 /mo · $567/yr
- Insurance
- −$35
- HOA
- −$0
- Vacancy / Maint / Mgmt
- −$195
- Net cashflow
- $205
Break-even live
UW: 25.0% down · 7.5% · 30yr · 1.5% tax · 5.0% vac · 8.0% maint · 8.0% mgmt
Financing live
Cash to close
- Down payment
- $21,250
- Closing costs
- $2,550
- Reserves months
- —
- Total cash needed
- —
Loan-product check · same deal, 3 products live
Conventional
25% down · 7.5% · 30yr
- Down + closing
- —
- Monthly P&I
- —
- Monthly cashflow
- —
- DSCR
- —
- Eligible?
- —
Personal DTI + credit; lowest rate.
DSCR
20% down · 8.5% · 30yr
- Down + closing
- —
- Monthly P&I
- —
- Monthly cashflow
- —
- DSCR
- —
- Eligible?
- —
No personal income docs; deal must DSCR.
Hard money
10% down · 12.0% · 12mo
- Down + closing
- —
- Monthly P&I
- —
- Monthly cashflow
- —
- DSCR
- —
- Eligible?
- —
Short-term bridge; refi at stabilization.
Rent comps 1 comps
| Address | Beds | Baths | Sqft | Rent | $/sqft | DOM | Units | Dist |
|---|---|---|---|---|---|---|---|---|
| 1300 Cloverdale Rd Selma, AL | 2.0–3.0 | 1.5–2.5 | 1204 | $929 | $0.77 | 20d | 1 | 0.59mi |
Listing history 8 events
-
2026-06-04days on market $85,000 Active 102 DOM
-
2026-06-02days on market $85,000 Active 101 DOM
-
2026-06-01days on market $85,000 Active 100 DOM
-
2026-05-31days on market $85,000 Active 99 DOM
-
2026-05-31days on market $85,000 Active 98 DOM
-
2026-03-29historical $850
-
2026-03-24$850
-
2026-02-21$85,000 Active 836-char remark
Show marketing remark (836 chars)
Someone is going to get a great opportunity on this house!! Maybe its you? Owner financing, no credit needed! A solid, spacious home ready for the right person or family who wants the chance to own instead of rent. Just one block from school and shopping, making it a convenient location for everyday living. 3 Bedrooms 1.5 Bathrooms Beautiful wood floors Cozy fireplace Separate dining room Flex room / den for office, playroom, or extra. living space Central heat Move-in condition 1-Year AHS Home Warranty Included Covers furnace, plumbing, and electrical Simple Path to Homeownership $2,000 Down payment $875 per month Price: $85,000 Bank financing not required Challenged credit OK No background checks Home sold AS-IS Text 757-550-1193 to schedule a walk-through Total investnent to move-in needed: $2,500
ⓘ Source: listings_history table (triggers on properties + properties_extension) + one-shot
backfill from property_details.listing_events for pre-trigger history.
Tax reassessment forecast AL · Resets to sale price
- Current annual tax
- $567 · $47/mo
- Projected year-2 tax
- $567 · $47/mo
- Expected delta
- $0/yr ($0/mo · 0.0%)
ⓘ Screening estimate from a state-policy table — verify with the county assessor before closing.
Climate risk First Street
- Flood 1/10 Low FEMA zone X (unshaded) · 0% chance over 30 yrs
- Wildfire 4/10 Moderate
- Heat 8/10 Severe 7 d/yr ≥108°F today · 20 d/yr by 30 yrs out
- Wind 8/10 Severe 80% chance of damaging wind over 30 yrs
- Air quality 2/10 Low 0 unhealthy d/yr today · 1 by 30 yrs out
Nearby sold comps map
Loading sold comps map…
Walkable amenities ~0.75 mi
Loading nearby amenities…
Taxation est. · year 1
- Rental income
- $11,148
- − Mortgage interest
- −$4,761
- − Property taxes
- −$567
- − Insurance
- −$425
- − Repairs & maintenance
- −$892
- − Management
- −$892
- − Depreciation
- −$2,473
- Taxable income
- $1,138
- Est. tax owed @ 24.0%
- −$273
- After-tax cash flow
- $2,193/yr
For passive investors: Depreciation is non-cash, so a rental often shows a tax loss while cash-flowing — sheltering income. Rental losses are passive: they offset passive income freely, and up to $25,000/yr can offset ordinary (W-2) income if you actively participate and your MAGI is under $100k (phasing out to $0 by $150k); unused losses carry forward. On sale, claimed depreciation is recaptured at up to 25%, and gains may owe capital-gains tax (a 1031 exchange can defer both). Figures are a year-1 estimate at your 24.0% rate — not tax advice; consult a CPA.
Schools (NCES district)
- District
- Selma City
- NCES district ID
- 0102970
- Math proficiency
- 2% ▼ -24.00%
- Reading proficiency
- 23% ▼ -2.00%
- Median HH income
- $23,380
- Composite
- 9.07/100
- National rank
- #9870
- State rank
- #118 of 129 in AL
Livability — Selma
- Score
- 56/100
- State rank
- #407
- US rank
- #22550
Category grades
Schools grade is shown separately in the Schools card above.
Census & demographics
- Census place
- Selma, AL
- Population (ZIP)
- 9,489
Population outlook (Dallas County) Hauer SSP2
- Today (2025)
- 35,464 people
- By 2030
- 32,631 · -8.0%
- By 2040
- 27,246 · -23.2%
- By 2050
- 22,691 · -36.0%
- By 2075
- 14,867 · -58.1%
- By 2100
- 10,285 · -71.0%
Race, ethnicity, and origin ACS 2023
- Neighborhood character
- Predominantly Black (69%)
- Race & ethnicity
- Black 69% White 26% Two or more races 3%
- Common ancestry
- Serbian 1% Iranian 1%
- Foreign-born
- 1%
Political lean MEDSL · Dallas
- 2024 margin
- Solid D (+32.5) · D 65.9% · R 33.4%
- 2008→2024 swing
- -2.0pp toward R · 2008: 34.5pp · 2024: 32.5pp
- All cycles
- 2024: D+32.5 2020: D+37.5 2016: D+37.6 2012: D+39.7 2008: D+34.5
Not yet ingested
- Civics
- —
Market trends
- HPI YoY
- ▲ 19.24%
- Current HPI
- 164.88
- Rent YoY
- —
- Metro
- —
- State GDP YoY
- ▲ 2.94%
- F500 in state
- 4
Industry mix (Fortune 500 HQ in AL)
| Industry | F500 HQs | Revenue |
|---|---|---|
| Financial Services | 1 | $8B |
|
||
| Healthcare | 1 | $5B |
|
||
Price history
3 events — show timeline
- 2026-03-29 Rental Removed $850 TURBOTENANT
- 2026-03-24 Listed for Rent $850 TURBOTENANT
- 2026-02-21 Listed $85,000 ForSaleByOwner.com
Property tax history
+9.3%/yrLatest (2023): $567 · +4.0% YoY. Source: county tax records.
Cash-flow waterfall
monthlySold comps — $/sqft
last 12 mo · ≤1 miLoading sold comps…