 Multi-family
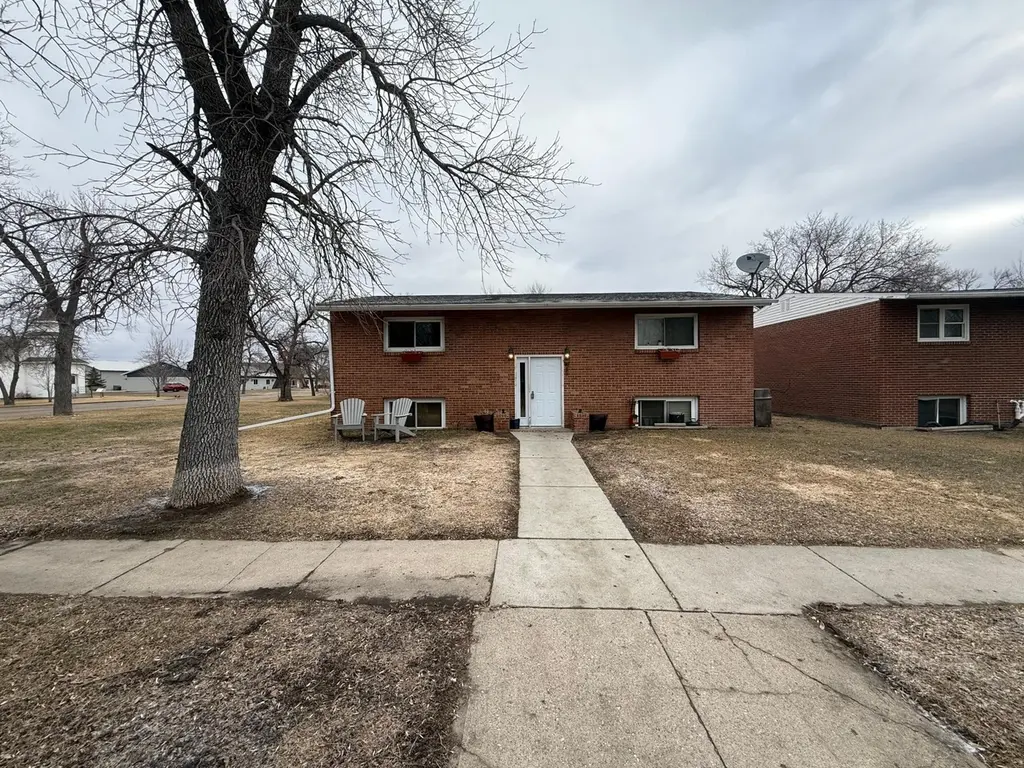
418 2nd Ave SW · Hillsboro, ND
Flood risk No data
- FEMA flood zone
- —
- Chance of flooding over 30 yrs
- —
- Est. flood insurance / yr
- —
Fire risk No data
- Est. fire insurance / yr
- —
Heat risk 2/10 · Minimal
- Hot days now (above threshold)
- 7 days/yr
- Hot days in 30 yrs
- 12 days/yr
Wind risk No data
- Chance of severe wind over 30 yrs
- —
Air-quality risk 3/10 · Minor
- Unhealthy air days now
- 3 days/yr
- Unhealthy air days in 30 yrs
- 3 days/yr
Risk factors via First Street. Map © Google.
Why this score? — see what drove the B+ grade
The composite is a weighted blend of 9 inputs, each scored 0–100. Each bar is that input's sub-score; the figure is the points it added to the 100-point composite (weight × sub-score).
- Cash flow +30.0/30.0
- 1% rule +10.0/10.0
- DSCR +10.0/10.0
- ARV discount +7.5/15.0
- Appreciation +6.9/10.0
- Schools +4.1/10.0
- Livability +3.9/5.0
- Rent growth +2.5/5.0
- Condition / age +2.2/5.0
$170,000
🖨 Deal sheet 📄 Offer letter ✓ Due diligence
Multi-family units
County records classify this as Multi-Family (2-4 Unit). Listing-text estimate: 1 unit. estimate disagrees with records
Key facts
- 7,405 sq ft lot
- Built 1973
- Listed 63 days
Property features AI
Finance
- Other: Total of 4 rental units (three units ~500 sq ft; one unit listed separately); Foundation and building areas noted; lot approximately 0.17 acres (49 x 150)
- Financial info: Gross income listed at $21,600; Net operating income listed (small value recorded in data); Listed unit-level expenses include fuel, water/sewer, trash, electric, insurance, maintenance, manager, and other (nominal values recorded in data)
Exterior
- Parking: On-street parking only
- Utilities: City water connected; City sewer connected; Electric service (fuel)
- Home design: Residential income property; Two levels; Not owner-occupied
- Construction: Block foundation; Foundation area approx. 1,120; Above and below grade finished areas listed (total living area 2,240)
- Exterior features: Stone exterior; Stucco exterior
Interior
- Kitchen: Range; Refrigerator
- Bedrooms: 4 bedrooms total (units include three 1-bed units and one 1-bed unit of a different layout)
- Bathrooms: Each unit has 1 full bathroom
- Heating & cooling: Baseboard heating; Window cooling units in some units
- Interior features: Block basement
- Laundry & utility: Electric fuel
Neighborhood map
What this means for you Summary
Snapshot
- This is a 4-bed/4.0-bath multifamily listed at $170k. Condition is rated fair.
Deal economics
- At list price, monthly cash flow is $2k ($20k/yr) — positive.
- The deal already cash-flows at list — no discount required.
- Meets the 1% rule at list price ($4k rent vs $170k).
- Recommended offer: $160k (6.0% below list) — sets the bar for market timing.
Location & tenants
- Location reads 78/100 on livability (#7 in ND, #2,511 nationally) — a middle-class / working-renter tenant base. Strengths: crime A+, cost of living A+, housing A+; Watch: schools C-, amenities F, commute F.
- Hillsboro 9 (rural): math 51% / reading 44% proficiency, ranked #16 of 53 in ND (top 30%) — families likely to look elsewhere, expect single-tenant / working-renter base with shorter leases; only 19% free/reduced lunch — higher-income household profile.
- Market conditions: 14 active listings in the ZIP; 1 comparable units currently listed for rent nearby; 8 units permitted in Traill County in 2024 (0 in 5+ unit buildings).
Forward outlook
- In year one you build about $7k of equity ($1k loan paydown + $6k appreciation (3.7% local appreciation)).
- Traill County population projected at +3% by 2050 — modest demand growth; plan on rents tracking national, not racing it.
- At projected returns (3.7% appreciation + 3.0% rent growth), your $48k cash investment doubles in ~2 years — after that, you're playing with house money.
- By year 5, paydown + projected appreciation supports a ~$32k cash-out refi (75% LTV) — recoverable capital for the next deal without selling this one.
Negotiation context
- It's been on market 63 days — a 6% lower offer ($160k) is reasonable based on typical stale-listing flexibility.
Questions for the listing agent
- It's been on market 63 days. Have you received any prior offers? Is the seller open to a 6% concession, seller financing, or rate buy-down credit?
- Have any recent inspections been done? Can we get a copy of the seller's disclosures and any deferred-maintenance estimates?
- Built in 1973 — when were the roof, HVAC, electrical panel, plumbing, and water heater last replaced?
- Why hasn't it sold? Are there any deal-killer items the seller is aware of (foundation, flood, title, zoning, code violations)?
- Is there a deadline driving the sale (1031 exchange, divorce, estate, relocation)? That informs how much negotiation room exists.
- What's the average days-on-market for RENTAL listings here right now (not sales)? A rising rental-DOM trend means longer vacancies and softer asking-rent achievability than the comps imply.
- What's the recent tenant-quality profile in this submarket — average credit score on applications, eviction rate, late-payment / NSF rate, and stable-employment percentage? A property-management company in the area should have these aggregated.
- How much new apartment / multifamily construction is in the pipeline within 1–3 miles? Heavy new supply (>2% of stock underway) typically softens rents 12–24 months out; light construction supports rent growth.
Investment metrics
- 1% rule
- 2.12% ✓
- Cap rate
- 18.12%
- Cash-on-cash
- 42.24%
- DSCR
- 2.88
- GRM
- 3.9
CMA / ARV
No comps found within radius.
Projected returns pro-forma
3.72% appreciation · 3.0% rent growth · sell at horizon
- IRR
- 48.6%
- Equity multiple
- 3.81×
- Total profit
- $133,771
- Equity at exit
- $83,380
- IRR
- 47.7%
- Equity multiple
- 7.70×
- Total profit
- $318,925
- Equity at exit
- $134,178
Cash invested: $47,600 (down + closing). Projections, not guarantees.
Landlord ↔ Tenant lean methodology
- Overall (STATE)
- 82 Strongly Landlord-Friendly
- State North Dakota
- 82 Strongly Landlord-Friendly · R+20
- County
- — inherits STATE
- City
- — inherits STATE
ZIP-level market 58045
- Home prices YoY
- 2.7%
- Active inventory
- 14
- Price-to-rent
- 7.9×
Monthly cashflow live
- Estimated rent
- $3,608 medium interval (Pro) →
- Mortgage (P&I)
- −$891
- Tax est. 1.5%
- −$212 /mo · $2,550/yr
- Insurance
- −$71
- HOA
- −$0
- Vacancy / Maint / Mgmt
- −$758
- Net cashflow
- $1,675
Break-even live
2-unit breakdown (identical units grouped — click to expand)
| Units | Beds | Baths | Est. rent |
|---|---|---|---|
| 2× units | 1 | 1 | $3,608 |
| #1 | 1 | 1 | $1,804 |
| #2 | 1 | 1 | $1,804 |
| Total (2 units) | $3,608 | ||
UW: 25.0% down · 7.5% · 30yr · 1.5% tax · 5.0% vac · 8.0% maint · 8.0% mgmt
Financing live
Cash to close
- Down payment
- $42,500
- Closing costs
- $5,100
- Reserves months
- —
- Total cash needed
- —
Loan-product check · same deal, 3 products live
Conventional
25% down · 7.5% · 30yr
- Down + closing
- —
- Monthly P&I
- —
- Monthly cashflow
- —
- DSCR
- —
- Eligible?
- —
Personal DTI + credit; lowest rate.
DSCR
20% down · 8.5% · 30yr
- Down + closing
- —
- Monthly P&I
- —
- Monthly cashflow
- —
- DSCR
- —
- Eligible?
- —
No personal income docs; deal must DSCR.
Hard money
10% down · 12.0% · 12mo
- Down + closing
- —
- Monthly P&I
- —
- Monthly cashflow
- —
- DSCR
- —
- Eligible?
- —
Short-term bridge; refi at stabilization.
Rent comps 1 comps
| Address | Beds | Baths | Sqft | Rent | $/sqft | DOM | Units | Dist |
|---|---|---|---|---|---|---|---|---|
| 303 Toronto Dr Hillsboro, ND | 4.0 | 3.0 | 2136 | $1,995 | $0.93 | 21d | 1 | 0.39mi |
Listing history 16 events
-
2026-06-18days on market $170,000 Active 63 DOM
-
2026-06-17days on market $170,000 Active 62 DOM
-
2026-06-16days on market $170,000 Active 61 DOM
-
2026-06-15days on market $170,000 Active 60 DOM
-
2026-06-13days on market $170,000 Active 58 DOM
-
2026-06-12days on market $170,000 Active 57 DOM
-
2026-06-09days on market $170,000 Active 54 DOM
-
2026-06-08days on market $170,000 Active 53 DOM
-
2026-06-07days on market $170,000 Active 52 DOM
-
2026-06-05days on market $170,000 Active 50 DOM
-
2026-06-04days on market $170,000 Active 48 DOM
-
2026-06-02days on market $170,000 Active 47 DOM
-
2026-06-01days on market $170,000 Active 46 DOM
-
2026-05-31days on market $170,000 Active 45 DOM
-
2026-05-05price $170,000
-
2026-04-16$180,000 Active
ⓘ Source: listings_history table (triggers on properties + properties_extension) + one-shot
backfill from property_details.listing_events for pre-trigger history.
Climate risk First Street
- Heat 2/10 Low
- Air quality 3/10 Moderate 3 unhealthy d/yr today · 3 by 30 yrs out
Nearby sold comps map
Loading sold comps map…
Walkable amenities ~0.75 mi
Loading nearby amenities…
Taxation est. · year 1
- Rental income
- $43,296
- − Mortgage interest
- −$9,523
- − Property taxes
- −$2,550
- − Insurance
- −$850
- − Repairs & maintenance
- −$3,464
- − Management
- −$3,464
- − Depreciation
- −$4,945
- Taxable income
- $18,501
- Est. tax owed @ 24.0%
- −$4,440
- After-tax cash flow
- $15,666/yr
For passive investors: Depreciation is non-cash, so a rental often shows a tax loss while cash-flowing — sheltering income. Rental losses are passive: they offset passive income freely, and up to $25,000/yr can offset ordinary (W-2) income if you actively participate and your MAGI is under $100k (phasing out to $0 by $150k); unused losses carry forward. On sale, claimed depreciation is recaptured at up to 25%, and gains may owe capital-gains tax (a 1031 exchange can defer both). Figures are a year-1 estimate at your 24.0% rate — not tax advice; consult a CPA.
Condition & rehab AI · 7 photos
The property requires moderate renovations to improve its curb appeal and interior aesthetics, which would significantly increase its resale and rental value.
Repairs flagged
- Major exterior paint — Significant discoloration and wear
- Major interior paint — Worn appearance in some areas
- Minor kitchen cabinets — Dated design
Value-add opportunities
- Both paint exterior and interior — Enhances curb appeal and interior aesthetics
- Both update kitchen cabinets and appliances — Modernizes the space and increases appeal
- Both replace carpet with hardwood flooring — Improves durability and aesthetic appeal
Renovation cost estimate screening
| Repair item | Severity | Est. cost |
|---|---|---|
| exterior paint · Significant discoloration and wear | Major | $15,000–50,000 |
| interior paint · Worn appearance in some areas | Major | $15,000–50,000 |
| kitchen cabinets · Dated design | Minor | $500–3,000 |
| Total estimated repair cost · 3 items | $30,500–103,000 |
Value-add ROI direction
- Both paint exterior and interior — Enhances curb appeal and interior aesthetics ↑
- Both update kitchen cabinets and appliances — Modernizes the space and increases appeal ↑
- Both replace carpet with hardwood flooring — Improves durability and aesthetic appeal ↑
ⓘ Cost ranges are severity-bucket heuristics (US national rule-of-thumb). Get contractor quotes + a written scope before underwriting a rehab budget.
Schools (NCES district)
- District
- Hillsboro 9
- NCES district ID
- 3809570
- Math proficiency
- 51% ▲ 1.00%
- Reading proficiency
- 44% ▬ 0.00%
- Median HH income
- $51,294
- Composite
- 40.88/100
- National rank
- #3622
- State rank
- #16 of 53 in ND
Livability — Hillsboro
- Score
- 78/100
- State rank
- #7
- US rank
- #2511
Category grades
Schools grade is shown separately in the Schools card above.
Census & demographics
- Census place
- Hillsboro, ND
- Population (ZIP)
- 2,181
Population outlook (Traill County) Hauer SSP2
- Today (2025)
- 8,107 people
- By 2030
- 8,099 · -0.1%
- By 2040
- 8,151 · +0.5%
- By 2050
- 8,384 · +3.4%
- By 2075
- 9,868 · +21.7%
- By 2100
- 12,181 · +50.3%
Race, ethnicity, and origin ACS 2023
- Neighborhood character
- Predominantly White (90%)
- Race & ethnicity
- White 90% Two or more races 8% Hispanic / Latino 3%
- Common ancestry
- Portuguese 31% Scottish 6% Lithuanian 3%
- Foreign-born
- 1%
- Languages at home
- 98% English-only · Other Indo-European 1% Tagalog/Filipino 1%
Political lean MEDSL · Traill
- 2024 margin
- Solid R (+31.6) · D 33.3% · R 65.0% · Other 1.7%
- 2008→2024 swing
- -38.8pp toward R · 2008: 7.2pp · 2024: -31.6pp
- All cycles
- 2024: R+31.6 2020: R+24.9 2016: R+26.5 2012: R+4.7 2008: D+7.2
Not yet ingested
- Civics
- —
Market trends
- HPI YoY
- ▲ 3.72%
- Current HPI
- 139.3759
- Rent YoY
- —
- Metro
- —
- State GDP YoY
- ▲ 2.09%
- F500 in state
- 2
Industry mix (Fortune 500 HQ in ND)
| Industry | F500 HQs | Revenue |
|---|---|---|
| Utilities / Construction | 1 | $6B |
|
||
Price history
-5.6% since first listed2 events — show timeline
- 2026-05-05 Price Changed $170,000 NORTHSTARMLS as Distributed by MLS Grid
- 2026-04-16 Listed $180,000 NORTHSTARMLS as Distributed by MLS Grid
Cash-flow waterfall
monthlySold comps — $/sqft
last 12 mo · ≤1 miLoading sold comps…