287 S Bardstown Rd · Mount Washington, KY
Flood risk 1/10 · Minimal
- FEMA flood zone
- X (unshaded)
- Chance of flooding over 30 yrs
- 0.0%
- Est. flood insurance / yr
- $507 – $1,088
Fire risk 4/10 · Minor
- Est. fire insurance / yr
- $839 – $1,559
Heat risk 5/10 · Moderate
- Hot days now (above 105°F)
- 7 days/yr
- Hot days in 30 yrs
- 19 days/yr
Wind risk 2/10 · Minimal
- Chance of severe wind over 30 yrs
- 2.0%
Air-quality risk 2/10 · Minimal
- Unhealthy air days now
- 1 days/yr
- Unhealthy air days in 30 yrs
- 2 days/yr
Risk factors via First Street. Map © Google.
Why this score? — see what drove the F grade
The composite is a weighted blend of 9 inputs, each scored 0–100. Each bar is that input's sub-score; the figure is the points it added to the 100-point composite (weight × sub-score).
- Cash flow +4.2/30.0
- Livability +3.5/5.0
- Schools +3.1/10.0
- Rent growth +2.5/5.0
- Condition / age +2.5/5.0
- 1% rule +0.1/10.0
- DSCR +0.0/10.0
- ARV discount +0.0/15.0
- Appreciation +0.0/10.0
$249,000
🖨 Deal sheet 📄 Offer letter ✓ Due diligence
Listing remarks
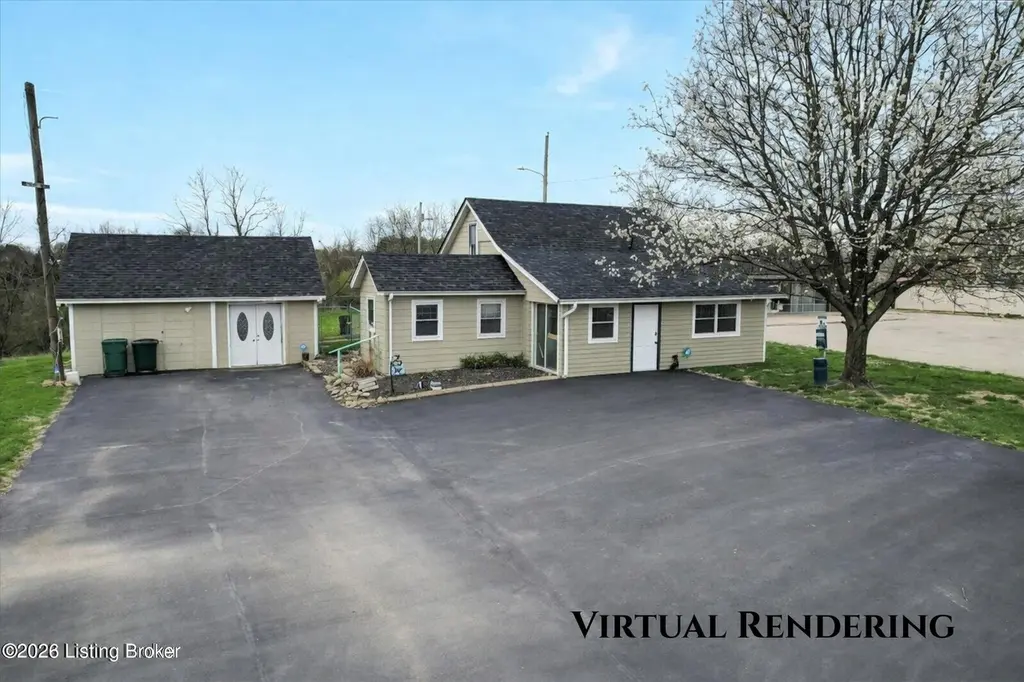
Opportunity, updates, and flexibility come together in this move-in ready home in the heart of Mt. Washington. The interior has been updated, while the exterior offers a great opportunity to enhance curb appeal—and the seller is willing to paint with an acceptable offer, allowing for a fresh, modern look tailored to your preference. This 3-bedroom, 1-bath home features all new flooring, fresh interior paint, a completely renovated kitchen, and an updated bathroom, creating a clean and modern living space ready for immediate occupancy. A new roof installed in 2023 adds additional value and peace of mind. The property offers exceptional versatility with three detached buildings, ideal f
Key facts
- Detached buildings
- Updated kitchen
- Fenced backyard
Tags
Property features AI
Finance
- HOA & community: No association fee
Exterior
- Parking: Detached garage (2 car); Driveway parking
- Utilities: Electricity connected
- Home design: Single-family residence; Cape Cod / Other architectural style; One story
- Construction: Shingle roof; Crawl space foundation; Vinyl and aluminum siding; Year built not specified
- Exterior features: Chain link fencing; Lot roughly 0.68 acres (approx. 100 x 296)
Interior
- Kitchen: Kitchen on the first floor
- Bedrooms: 3 bedrooms total; One bedroom on the first floor; Two bedrooms on the second floor
- Bathrooms: 1 full bathroom; No half bathrooms
- Heating & cooling: Forced air heating; Central air conditioning
- Interior features: 8 total rooms; First-floor primary bedroom; First-floor laundry; No basement; No fireplaces
- Laundry & utility: Laundry located on the first floor
Neighborhood map
What this means for you Summary
Snapshot
- This is a 2-bed/1.0-bath single-family listed at $249k.
Deal economics
- At list price, monthly cash flow is $-679 ($-8k/yr) — negative.
- To cash-flow at today's rent, offer at most $129k (48.2% below list).
- To meet the 1% rule (rent ≥ 1% of price), the offer needs to be $128k (48.5% below list).
- Recommended offer: $128k (48.5% below list) — sets the bar for 1% rule.
Location & tenants
- Location reads 70/100 on livability (#158 in KY) — a middle-class / working-renter tenant base. Strengths: crime A+, cost of living A+, housing A+; Watch: amenities F, commute F, health & safety F.
- Bullitt County (suburban): math 29% / reading 41% proficiency, ranked #55 of 165 in KY (top 33%) — families likely to look elsewhere, expect single-tenant / working-renter base with shorter leases.
- Market conditions: 295 active listings in the ZIP; 2 comparable units currently listed for rent nearby; solid renter incomes; 380 units permitted in Bullitt County in 2024 (8 in 5+ unit buildings).
- This rent is only 16% of the median local income ($99k/yr) — well below the 30% rent-burden line; pricing power to push rent on renewal without tenant pushback.
Forward outlook
- Local home prices are declining (-3.0%/yr); year-one equity from $2k of loan paydown is wiped out by about $7k of value loss. Plan a longer hold.
- Bullitt County population projected at +22% by 2050 — long-run rental-demand tailwind backs the buy-and-hold thesis.
Negotiation context
- It's been on market 80 days — a 6% lower offer ($234k) is reasonable based on typical stale-listing flexibility.
- 7 sale attempts since 27y ago with the ask held roughly flat each time — persistent listings suggest the price (not the market) is what's stuck; bring a comps-based counter.
- Current owner paid $108k; list at $249k implies a 131% gain — meaningful room to come down on a strong offer.
Risks & watch-outs
- Climate carrying-cost: extreme-heat days projected 7→19/yr by 2055 (HVAC capex compounding) — expect insurance premiums to compound above CPI over the hold.
Questions for the listing agent
- What do current leases actually rent for vs. the listed asking? Can we see a recent rent roll and the last 12 months of T-12 income?
- It's been on market 80 days. Have you received any prior offers? Is the seller open to a 49% concession, seller financing, or rate buy-down credit?
- Why hasn't it sold? Are there any deal-killer items the seller is aware of (foundation, flood, title, zoning, code violations)?
- Is there a deadline driving the sale (1031 exchange, divorce, estate, relocation)? That informs how much negotiation room exists.
- The area grade is low — what's the realistic commute time and amenity access for the typical tenant pool here? Any planned neighborhood developments (good or bad) we should know about?
- What's the average days-on-market for RENTAL listings here right now (not sales)? A rising rental-DOM trend means longer vacancies and softer asking-rent achievability than the comps imply.
- What's the recent tenant-quality profile in this submarket — average credit score on applications, eviction rate, late-payment / NSF rate, and stable-employment percentage? A property-management company in the area should have these aggregated.
- How much new for-sale + rental construction is in the pipeline within 1–3 miles? Heavy new supply typically softens prices + rents 12–24 months out; constrained supply supports both.
Investment metrics
- 1% rule
- 0.51% ✗
- Cap rate
- 3.02%
- Cash-on-cash
- -11.68%
- DSCR
- 0.48
- GRM
- 16.2
CMA / ARV
- ARV (on-the-fly)
- $207,760
- Comps found
- 12
Show comp detail 12 sales within ~0.75 mi
| Address | Dist | Beds/Ba | Sqft | Sold | Price | $/sf | Match |
|---|---|---|---|---|---|---|---|
| 175 Stout Ln | 0.10mi | 2/1.5 | 1,040 (+6%) | 6mo | $196,900 | $189 | 78 |
| 147 Stout Ln | 0.08mi | 3/1.0 (+1) | 1,074 (+10%) | 6mo | $183,700 | $171 | 70 |
| 130 Morning Glory Ave | 0.06mi | 3/1.0 (+1) | 1,100 (+12%) | 6mo | $210,100 | $191 | 67 |
| 307 Carla Dr | 0.36mi | 3/1.0 (+1) | 1,000 (+2%) | 15mo | $239,000 | $239 | 62 |
| 363 Carla Dr | 0.31mi | 3/1.0 (+1) | 1,000 (+2%) | 19mo | $244,000 | $244 | 61 |
| 346 S Bardstown Rd | 0.32mi | 2/1.0 | 860 (-12%) | 6mo | $166,100 | $193 | 60 |
| 163 Kimberly Dr | 0.74mi | 3/1.0 (+1) | 1,050 (+7%) | 0mo | $235,000 | $224 | 48 |
| 444 Meadowview Dr | 0.53mi | 2/1.0 | 1,080 (+10%) | 22mo | $235,100 | $218 | 40 |
| 170 Meadowview Dr | 0.66mi | 3/1.0 (+1) | 1,040 (+6%) | 21mo | $209,995 | $202 | 36 |
| 212 Georgia Ave | 0.75mi | 3/1.0 (+1) | 1,100 (+12%) | 6mo | $237,500 | $216 | 35 |
| 188 Meadowview Dr | 0.66mi | 3/1.0 (+1) | 1,050 (+7%) | 22mo | $182,000 | $173 | 34 |
| 226 Georgia Ave | 0.75mi | 3/1.0 (+1) | 1,120 (+14%) | 10mo | $237,500 | $212 | 28 |
Match score weights: distance 35% · size 25% · config 20% · recency 20%. Top-matched comps best support the ARV.
Projected returns pro-forma
-3.0% appreciation · 3.0% rent growth · sell at horizon
- IRR
- -37.7%
- Equity multiple
- -0.20×
- Total profit
- $-83,576
- Equity at exit
- $37,127
- IRR
- -55.7%
- Equity multiple
- -0.84×
- Total profit
- $-128,436
- Equity at exit
- $21,529
Cash invested: $69,720 (down + closing). Projections, not guarantees.
Landlord ↔ Tenant lean methodology
- Overall (STATE)
- 83 Strongly Landlord-Friendly
- State Kentucky
- 83 Strongly Landlord-Friendly · R+16
- County
- — inherits STATE
- City
- — inherits STATE
ZIP-level market 40047
- Home prices YoY
- -18.8%
- Active inventory
- 295
- Price-to-rent
- 16.2×
Monthly cashflow live
- Estimated rent
- $1,281 medium interval (Pro) →
- Mortgage (P&I)
- −$1,306
- Tax from tax record
- −$282 /mo · $3,379/yr
- Insurance
- −$104
- HOA
- −$0
- Vacancy / Maint / Mgmt
- −$269
- Net cashflow
- $-679
Break-even live
UW: 25.0% down · 7.5% · 30yr · 1.5% tax · 5.0% vac · 8.0% maint · 8.0% mgmt
Financing live
Cash to close
- Down payment
- $62,250
- Closing costs
- $7,470
- Reserves months
- —
- Total cash needed
- —
Loan-product check · same deal, 3 products live
Conventional
25% down · 7.5% · 30yr
- Down + closing
- —
- Monthly P&I
- —
- Monthly cashflow
- —
- DSCR
- —
- Eligible?
- —
Personal DTI + credit; lowest rate.
DSCR
20% down · 8.5% · 30yr
- Down + closing
- —
- Monthly P&I
- —
- Monthly cashflow
- —
- DSCR
- —
- Eligible?
- —
No personal income docs; deal must DSCR.
Hard money
10% down · 12.0% · 12mo
- Down + closing
- —
- Monthly P&I
- —
- Monthly cashflow
- —
- DSCR
- —
- Eligible?
- —
Short-term bridge; refi at stabilization.
Rent comps 2 comps
| Address | Beds | Baths | Sqft | Rent | $/sqft | DOM | Units | Dist |
|---|---|---|---|---|---|---|---|---|
| 235 Ables Way Mt Washington, KY | 2.0 | 1.0 | 992 | $1,190 | $1.20 | 1d | 5 | 0.68mi |
| 446 Joy Ave Unit 2 Mt Washington, KY | 2.0 | 1.0 | 750 | $895 | $1.19 | 1d | 1 | 0.99mi |
Listing history 33 events
-
2026-06-18days on market $249,000 Active 80 DOM
-
2026-06-17days on market $249,000 Active 79 DOM
-
2026-06-16days on market $249,000 Active 78 DOM
-
2026-06-15days on market $249,000 Active 77 DOM
-
2026-06-13days on market $249,000 Active 75 DOM
-
2026-06-10days on market $249,000 Active 72 DOM
-
2026-06-09days on market $249,000 Active 71 DOM
-
2026-06-08days on market $249,000 Active 70 DOM
-
2026-06-07days on market $249,000 Active 69 DOM
-
2026-06-03days on market $249,000 Active 65 DOM
-
2026-06-02days on market $249,000 Active 64 DOM
-
2026-06-01days on market $249,000 Active 63 DOM
-
2026-05-31days on market $249,000 Active 62 DOM
-
2026-04-20price $249,000
-
2026-03-30$255,000 Active
-
2025-08-21price $235,000
-
2025-07-23price $243,888
-
2025-05-27price $248,888
-
2019-06-21soldstatus $108,000
-
2018-10-14historical
-
2018-04-14$129,900 Active
-
2018-04-12historical
-
2017-10-12$130,000 Active
-
2016-02-05historical
-
2015-04-02$199,900 Active
-
2015-04-02price $179,900
-
2006-05-11soldstatus $125,000
-
2006-05-11soldstatus $125,000
-
2006-03-07$131,500
-
2000-06-22historical
-
2000-03-22$110,000
-
2000-03-20historical
-
1999-09-20$119,000
ⓘ Source: listings_history table (triggers on properties + properties_extension) + one-shot
backfill from property_details.listing_events for pre-trigger history.
Tax reassessment forecast KY · Resets to sale price
- Current annual tax
- $3,379 · $282/mo
- Projected year-2 tax
- $3,379 · $282/mo
- Expected delta
- $0/yr ($0/mo · 0.0%)
ⓘ Screening estimate from a state-policy table — verify with the county assessor before closing.
Climate risk First Street
- Flood 1/10 Low FEMA zone X (unshaded) · 0% chance over 30 yrs
- Wildfire 4/10 Moderate
- Heat 5/10 Major 7 d/yr ≥105°F today · 19 d/yr by 30 yrs out
- Wind 2/10 Low 2% chance of damaging wind over 30 yrs
- Air quality 2/10 Low 1 unhealthy d/yr today · 2 by 30 yrs out
Nearby sold comps map
Loading sold comps map…
Walkable amenities ~0.75 mi
Loading nearby amenities…
Taxation est. · year 1
- Rental income
- $15,378
- − Mortgage interest
- −$13,948
- − Property taxes
- −$3,379
- − Insurance
- −$1,245
- − Repairs & maintenance
- −$1,230
- − Management
- −$1,230
- − Depreciation
- −$7,244
- Taxable loss
- −$12,898
- Est. tax savings @ 24.0%
- +$3,096
- After-tax cash flow
- $-5,049/yr
For passive investors: Depreciation is non-cash, so a rental often shows a tax loss while cash-flowing — sheltering income. Rental losses are passive: they offset passive income freely, and up to $25,000/yr can offset ordinary (W-2) income if you actively participate and your MAGI is under $100k (phasing out to $0 by $150k); unused losses carry forward. On sale, claimed depreciation is recaptured at up to 25%, and gains may owe capital-gains tax (a 1031 exchange can defer both). Figures are a year-1 estimate at your 24.0% rate — not tax advice; consult a CPA.
Schools (NCES district)
- District
- Bullitt County
- NCES district ID
- 2100750
- Math proficiency
- 29% ▼ -15.00%
- Reading proficiency
- 41% ▼ -14.00%
- Median HH income
- $55,009
- Composite
- 30.78/100
- National rank
- #6151
- State rank
- #55 of 165 in KY
Livability — Mount Washington
- Score
- 70/100
- State rank
- #158
- US rank
- #7984
Category grades
Schools grade is shown separately in the Schools card above.
Census & demographics
- Census place
- Mount Washington, KY
- County
- Bullitt County · 62,065 people
- City population
- 23,662
- Metro
- Louisville/Jefferson County, KY-IN
- Population (ZIP)
- 23,662
- Household income
- $99,124
- Rent vs Own
- Severe rent burden
- 90.0
Population outlook (Bullitt County) Hauer SSP2
- Today (2025)
- 89,555 people
- By 2030
- 94,389 · +5.4%
- By 2040
- 102,759 · +14.7%
- By 2050
- 108,955 · +21.7%
- By 2075
- 121,898 · +36.1%
- By 2100
- 126,383 · +41.1%
Race, ethnicity, and origin ACS 2023
- Neighborhood character
- Predominantly White (92%)
- Race & ethnicity
- White 92% Two or more races 5% Hispanic / Latino 3%
- Common ancestry
- Lithuanian 3% Slovak 2% Iranian 2%
- Foreign-born
- 2% · Canada
- Languages at home
- 97% English-only · Spanish 2%
Political lean MEDSL · Bullitt
- 2024 margin
- Solid R (+51.0) · D 23.8% · R 74.8% · Other 1.4%
- 2008→2024 swing
- -18.7pp toward R · 2008: -32.3pp · 2024: -51.0pp
- All cycles
- 2024: R+51.0 2020: R+48.0 2016: R+49.8 2012: R+35.7 2008: R+32.3
Not yet ingested
- Civics
- —
Market trends
- HPI YoY
- ▼ -61.20%
- Current HPI
- 264.3563
- Rent YoY
- —
- Metro
- Louisville/Jefferson County, KY-IN
- State GDP YoY
- ▲ 1.81%
- F500 in state
- 4
Industry mix (Fortune 500 HQ in KY)
| Industry | F500 HQs | Revenue |
|---|---|---|
| Healthcare | 1 | $118B |
|
||
| Food / Beverage | 1 | $7B |
|
||
Price history
+109.2% since first listed20 events — show timeline
- 2026-04-20 Price Changed $249,000 Metro Search MLS
- 2026-03-30 Listed $255,000 Metro Search MLS
- 2025-08-21 Price Changed $235,000 Metro Search MLS
- 2025-07-23 Price Changed $243,888 Metro Search MLS
- 2025-05-27 Price Changed $248,888 Metro Search MLS
- 2019-06-21 Sold (Public Records) $108,000 Public Records
- 2018-10-14 Listing Removed — Metro Search MLS
- 2018-04-14 Listed $129,900 Metro Search MLS
- 2018-04-12 Listing Removed — Metro Search MLS
- 2017-10-12 Listed $130,000 Metro Search MLS
- 2016-02-05 Listing Removed — Metro Search MLS
- 2015-04-02 Listed $199,900 Metro Search MLS
- 2015-04-02 Price Changed $179,900 Metro Search MLS
- 2006-05-11 Sold (Public Records) $125,000 Public Records
- 2006-05-11 Sold (MLS) $125,000 Metro Search MLS
- 2006-03-07 Listed $131,500 Metro Search MLS
- 2000-06-22 Listing Removed — Metro Search MLS
- 2000-03-22 Listed $110,000 Metro Search MLS
- 2000-03-20 Listing Removed — Metro Search MLS
- 1999-09-20 Listed $119,000 Metro Search MLS
Property tax history
+7.9%/yrLatest (2025): $3,379 · +74.9% YoY. Source: county tax records.
Cash-flow waterfall
monthlySold comps — $/sqft
last 12 mo · ≤1 miLoading sold comps…