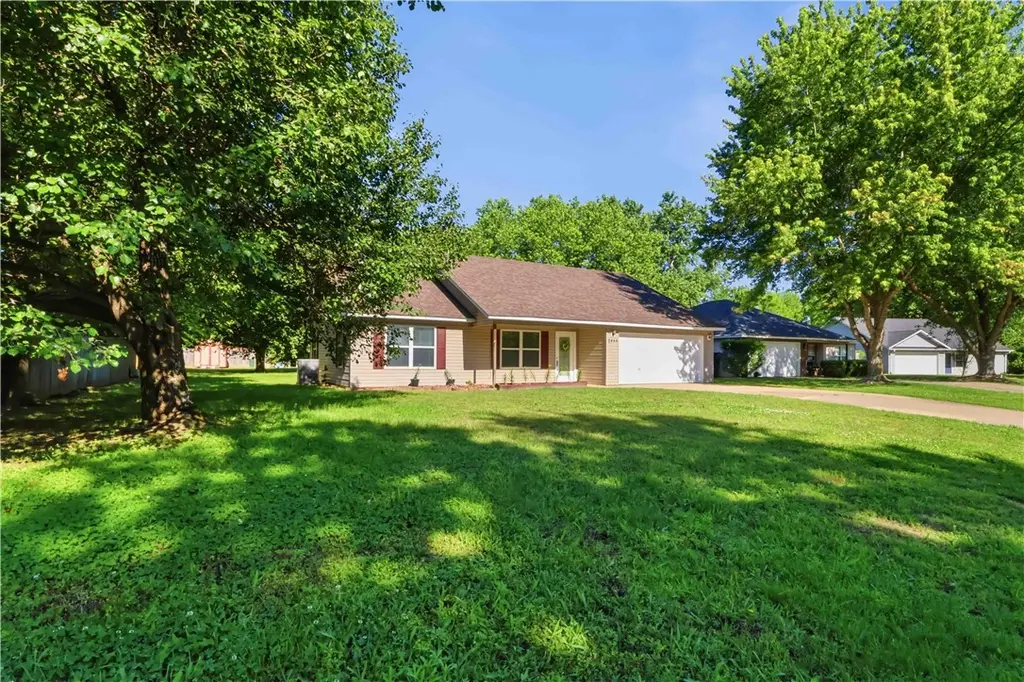
2855 Colten Cv · Fayetteville, AR
Flood risk 1/10 · Minimal
- FEMA flood zone
- X (unshaded)
- Chance of flooding over 30 yrs
- 0.0%
- Est. flood insurance / yr
- $507 – $1,088
Fire risk 1/10 · Minimal
- Est. fire insurance / yr
- $1,499 – $2,785
Heat risk 5/10 · Moderate
- Hot days now (above 106°F)
- 7 days/yr
- Hot days in 30 yrs
- 21 days/yr
Wind risk 2/10 · Minimal
- Chance of severe wind over 30 yrs
- 2.0%
Air-quality risk 1/10 · Minimal
- Unhealthy air days now
- 0 days/yr
- Unhealthy air days in 30 yrs
- 0 days/yr
Risk factors via First Street. Map © Google.
Why this score? — see what drove the D- grade
The composite is a weighted blend of 9 inputs, each scored 0–100. Each bar is that input's sub-score; the figure is the points it added to the 100-point composite (weight × sub-score).
- ARV discount +15.0/15.0
- Cash flow +7.0/30.0
- Livability +4.2/5.0
- Schools +4.1/10.0
- Rent growth +3.2/5.0
- Condition / age +2.5/5.0
- 1% rule +1.9/10.0
- DSCR +1.2/10.0
- Appreciation +0.0/10.0
$267,000
🖨 Deal sheet 📄 Offer letter ✓ Due diligence
Listing remarks
Welcome home to this well-maintained, one-owner gem. This inviting 3-bedroom, 2-bath home with a 2-car garage features a desirable split floor plan designed for comfort and privacy. The spacious eat-in kitchen includes a pantry, ample cabinetry, and plenty of storage throughout the home. The primary suite offers two closets and a private bath with double sinks for added convenience. Major updates include a new roof in December 2025 and heater replaced in 2019. Situated on a large lot with adjoining farmland to back of the property, this home is just a short 7-minute drive to Lake Sequoyah and the Elkins Sports Complex, with shopping, restaurants, and everyday conveniences nearby. Start your
Key facts
- Double sinks
- Ample cabinetry
- Private bath
Tags
Property features AI
Finance
- HOA & community: Monthly association fee; Community amenities include nearby park and shopping
Exterior
- Parking: Attached 2-car garage with garage door opener
- Security: Smoke detectors
- Utilities: Public water; Public sewer; Electricity available; Natural gas available; Cable available; Phone available
- Home design: Single-story home; Vinyl siding; Shingle architectural roof; Slab foundation; Residential zoning; Public road frontage on a paved street; Located on a cleared, level cul-de-sac lot; View of Lake Sequoyah
- Construction: Built with vinyl siding; Architectural shingle roof; Slab foundation
- Exterior features: Covered patio and porch; Concrete driveway; Storage structure; Partial wood and wire privacy fencing; Views; Located near a park
Interior
- Kitchen: Dishwasher; Electric range; Range hood; Disposal; Plumbed for ice maker
- Bedrooms: Three main-level bedrooms
- Flooring: Carpet; Tile; Vinyl
- Bathrooms: Two full bathrooms
- Heating & cooling: Central heating (gas); Central electric air conditioning
- Interior features: Ceiling fans; Eat-in kitchen; Pantry; Split bedrooms; Walk-in closets; Window treatments; Double-pane vinyl windows with blinds
- Laundry & utility: Washer hookup; Dryer hookup; Utility room on main level; Electric water heater
Neighborhood map
What this means for you Summary
Snapshot
- This is a 3-bed/2.0-bath single-family listed at $267k.
Deal economics
- At list price, monthly cash flow is $-393 ($-5k/yr) — negative.
- To cash-flow at today's rent, offer at most $210k (21.3% below list).
- To meet the 1% rule (rent ≥ 1% of price), the offer needs to be $184k (31.2% below list).
- Recommended offer: $184k (31.2% below list) — sets the bar for 1% rule.
- Cap rate 4.5% vs local median 3.5% in Fayetteville — meaningfully above typical; check what's discounted (condition, days-on-market, listing class) to confirm the premium yield is real.
Location & tenants
- Location reads 83/100 on livability (#3 in AR, #871 nationally) — a professional / high-income tenant draw. Strengths: amenities A+, commute A+, health & safety A+; Watch: employment D+, crime D-.
- Fayetteville School District (urban): math 50% / reading 49% proficiency, ranked #19 of 238 in AR (top 8%) — families likely to look elsewhere, expect single-tenant / working-renter base with shorter leases.
- Market conditions: Rents rising (+2.6%/yr); 525 active listings in the ZIP; 40 comparable units currently listed for rent nearby; rentals at typical pace (median 24d on market — plan ~3-4 weeks tenant-placement turnaround); 48% of comp listings sitting > 30 days — soft ceiling on asking rent; 3,494 units permitted in Washington County in 2024 (1,497 in 5+ unit buildings).
- This rent runs 40% of the median local income ($56k/yr) — at the standard rent-burdened threshold; future hikes will face affordability resistance.
Forward outlook
- Local home prices are declining (-3.0%/yr); year-one equity from $2k of loan paydown is wiped out by about $8k of value loss. Plan a longer hold.
- Washington County population projected at +47% by 2050 — long-run rental-demand tailwind backs the buy-and-hold thesis.
Negotiation context
- It's been on market 16 days — a 2% lower offer ($263k) is reasonable based on typical stale-listing flexibility.
- 2 sale attempts with the ask held roughly flat each time — persistent listings suggest the price (not the market) is what's stuck; bring a comps-based counter.
- Current owner paid $85k; list at $267k implies a 214% gain — meaningful room to come down on a strong offer.
Risks & watch-outs
- Climate carrying-cost: extreme-heat days projected 7→21/yr by 2055 (HVAC capex compounding) — expect insurance premiums to compound above CPI over the hold.
Questions for the listing agent
- What do current leases actually rent for vs. the listed asking? Can we see a recent rent roll and the last 12 months of T-12 income?
- Is there a deadline driving the sale (1031 exchange, divorce, estate, relocation)? That informs how much negotiation room exists.
- Schools are B-rated — typically a magnet for longer-tenancy family renters. What's the average tenant stay here, and is there a school-zone premium baked into asking?
- Crime grade is D in this area — have there been break-ins, vandalism, or insurance claims at this property in the last 3 years? What carrier currently insures it and at what premium?
- The area grade is low — what's the realistic commute time and amenity access for the typical tenant pool here? Any planned neighborhood developments (good or bad) we should know about?
- What's the average days-on-market for RENTAL listings here right now (not sales)? A rising rental-DOM trend means longer vacancies and softer asking-rent achievability than the comps imply.
- What's the recent tenant-quality profile in this submarket — average credit score on applications, eviction rate, late-payment / NSF rate, and stable-employment percentage? A property-management company in the area should have these aggregated.
- How much new for-sale + rental construction is in the pipeline within 1–3 miles? Heavy new supply typically softens prices + rents 12–24 months out; constrained supply supports both.
Investment metrics
- 1% rule
- 0.69% ✗
- Cap rate
- 4.53%
- Cash-on-cash
- -6.31%
- DSCR
- 0.72
- GRM
- 12.1
CMA / ARV
- ARV (median comp)
- $423,428
- List price
- $267,000
- Delta
- -36.94%
- Verdict
- UNDERPRICED
- Comps
- 20 within 1.0 mi
Show comp detail 12 sales within ~0.75 mi
| Address | Dist | Beds/Ba | Sqft | Sold | Price | $/sf | Match |
|---|---|---|---|---|---|---|---|
| 2871 Colton Cv | 0.00mi | 3/2.0 | 1,300 (0%) | 1mo | $275,000 | $212 | 99 |
| 2842 Colton Cv | 0.00mi | 3/2.0 | 1,340 (+3%) | 2mo | $215,000 | $160 | 93 |
| 411 W North St | 0.13mi | 3/2.0 | 1,288 (-1%) | 11mo | $431,000 | $335 | 83 |
| 618 N Wilson | 0.44mi | 2/2.0 (-1) | 1,447 (+11%) | 1mo | $525,000 | $363 | 55 |
| 1740 Gregg Ave | 0.55mi | 4/2.0 (+1) | 1,248 (-4%) | 9mo | $275,000 | $220 | 55 |
| 929 W Lawson St | 0.42mi | 3/2.5 | 1,406 (+8%) | 12mo | $380,000 | $270 | 54 |
| 1771 Oakland Ave | 0.69mi | 4/2.0 (+1) | 1,350 (+4%) | 3mo | $340,000 | $252 | 54 |
| 822 N Garland Ave | 0.49mi | 3/2.5 | 1,376 (+6%) | 15mo | $445,000 | $323 | 53 |
| 990 W Holly St | 0.42mi | 3/2.5 | 1,452 (+12%) | 8mo | $420,000 | $289 | 52 |
| 811 N Lindell Ave | 0.47mi | 3/1.0 | 1,411 (+8%) | 11mo | $355,000 | $252 | 50 |
| 835 W Davis St | 0.63mi | 3/1.5 | 1,196 (-8%) | 21mo | $280,000 | $234 | 38 |
| 220 W Lafayette St | 0.65mi | 2/2.0 (-1) | 1,466 (+13%) | 7mo | $691,250 | $472 | 38 |
Match score weights: distance 35% · size 25% · config 20% · recency 20%. Top-matched comps best support the ARV.
Projected returns pro-forma
-3.0% appreciation · 2.64% rent growth · sell at horizon
- IRR
- -27.6%
- Equity multiple
- 0.08×
- Total profit
- $-68,941
- Equity at exit
- $39,811
- IRR
- -27.2%
- Equity multiple
- -0.27×
- Total profit
- $-94,865
- Equity at exit
- $23,085
Cash invested: $74,760 (down + closing). Projections, not guarantees.
Landlord ↔ Tenant lean methodology
- Overall (STATE)
- 92 Strongly Landlord-Friendly
- State Arkansas
- 92 Strongly Landlord-Friendly · R+14
- County
- — inherits STATE
- City
- — inherits STATE
ZIP-level market 72701
- Rents YoY
- 2.6%
- Active inventory
- 525
- Price-to-rent
- 12.1×
Monthly cashflow live
- Estimated rent
- $1,838 high interval (Pro) →
- Mortgage (P&I)
- −$1,400
- Tax est. 1.5%
- −$334 /mo · $4,005/yr
- Insurance
- −$111
- HOA
- −$0
- Vacancy / Maint / Mgmt
- −$386
- Net cashflow
- $-393
Break-even live
UW: 25.0% down · 7.5% · 30yr · 1.5% tax · 5.0% vac · 8.0% maint · 8.0% mgmt
Financing live
Cash to close
- Down payment
- $66,750
- Closing costs
- $8,010
- Reserves months
- —
- Total cash needed
- —
Loan-product check · same deal, 3 products live
Conventional
25% down · 7.5% · 30yr
- Down + closing
- —
- Monthly P&I
- —
- Monthly cashflow
- —
- DSCR
- —
- Eligible?
- —
Personal DTI + credit; lowest rate.
DSCR
20% down · 8.5% · 30yr
- Down + closing
- —
- Monthly P&I
- —
- Monthly cashflow
- —
- DSCR
- —
- Eligible?
- —
No personal income docs; deal must DSCR.
Hard money
10% down · 12.0% · 12mo
- Down + closing
- —
- Monthly P&I
- —
- Monthly cashflow
- —
- DSCR
- —
- Eligible?
- —
Short-term bridge; refi at stabilization.
Rent comps 40 comps
| Address | Beds | Baths | Sqft | Rent | $/sqft | DOM | Units | Dist |
|---|---|---|---|---|---|---|---|---|
| 1222 N Iron Horse Dr Unit 1221925P Fayetteville, AR | 2.0 | 1.5 | 904 | $4,034 | $4.46 | 23d | 1 | 0.05mi |
| 1005 N Molly Ct Fayetteville, AR | 3.0 | 3.5 | 1800 | $1,900 | $1.06 | 43d | 1 | 0.10mi |
| 1000 N Molly Ct Fayetteville, AR | 3.0 | 1.0–3.5 | 1100 | $1,900 | $1.73 | 14d | 10 | 0.10mi |
| 645 W Adams St Fayetteville, AR | 2.0 | 1.0 | 1120 | $1,380 | $1.23 | 14d | 1 | 0.13mi |
| 1345 N Hog Trough Dr Fayetteville, AR | 4.0 | 3.5 | 1850 | $3,200 | $1.73 | 43d | 1 | 0.17mi |
| 1399 N Hog Trough Dr Fayetteville, AR | 2.0–4.0 | 2.5–3.5 | 1660 | $2,800 | $1.69 | 13d | 5 | 0.21mi |
| 787 W Sandy Beach Ln Fayetteville, AR | 3.0 | 2.0 | 1268 | $1,495 | $1.18 | 14d | 1 | 0.26mi |
| 1508 N Gregg Ave Unit 1508 Fayetteville, AR | 3.0 | 3.5 | 1868 | $2,400 | $1.28 | 43d | 1 | 0.27mi |
| 1523 N Dawn Dr Fayetteville, AR | 3.0 | 2.5 | 1472 | $1,500 | $1.02 | 14d | 1 | 0.30mi |
| 825 N Leverett Ave Unit 7 Fayetteville, AR | 2.0 | 2.0 | 884 | $1,425 | $1.61 | 14d | 1 | 0.31mi |
| 825 N Leverett Ave Unit 2 Fayetteville, AR | 2.0 | 2.0 | 895 | $1,395 | $1.56 | 43d | 1 | 0.31mi |
| 1150 N Oakland Ave Fayetteville, AR | 4.0 | 3.0 | 1800 | $3,300 | $1.83 | 21d | 1 | 0.33mi |
| 686 W Martha Dr Fayetteville, AR | 3.0 | 2.0 | 1100 | $1,100 | $1.00 | 43d | 1 | 0.34mi |
| 782 N Storer Ave Fayetteville, AR | 2.0 | 1.5 | 1200 | $1,400 | $1.17 | 43d | 1 | 0.36mi |
| 1370 Oakland Ave Unit 1 Fayetteville, AR | 2.0 | 1.0 | 900 | $1,195 | $1.33 | 14d | 1 | 0.36mi |
| 776 N Storer Ave Fayetteville, AR | 2.0 | 1.5 | 1200 | $1,400 | $1.17 | 43d | 1 | 0.36mi |
| 933 Oakland Ave Unit NA Fayetteville, AR | 3.0 | 2.5 | 1180 | $2,300 | $1.95 | 43d | 1 | 0.36mi |
| 736 N Storer Ave Unit 782 Fayetteville, AR | 2.0 | 1.5 | 1200 | $1,400 | $1.17 | 43d | 1 | 0.38mi |
| 736 N Storer Ave Unit 736 Fayetteville, AR | 2.0 | 1.5 | 1200 | $1,250 | $1.04 | 14d | 1 | 0.38mi |
| 956 W Eagle St Fayetteville, AR | 2.0 | 2.5 | 1050 | $1,900 | $1.81 | 43d | 2 | 0.41mi |
| 1659 N Dawn Dr Unit 1 Fayetteville, AR | 2.0 | 2.0 | 1100 | $1,350 | $1.23 | 14d | 1 | 0.43mi |
| 594 W Moan Pl Fayetteville, AR | 3.0 | 2.5 | 1400 | $2,500 | $1.79 | 23d | 1 | 0.45mi |
| 1684 N Dawn Dr Fayetteville, AR | 2.0 | 2.0 | 1050 | $1,400 | $1.33 | 43d | 1 | 0.45mi |
| 1023 W Eagle St Unit 1057 Fayetteville, AR | 2.0 | 1.0 | 1000 | $1,000 | $1.00 | 14d | 1 | 0.47mi |
| 802 N Park Ave Unit 1375235P Fayetteville, AR | 3.0 | 3.0 | 1442 | $7,634 | $5.29 | 43d | 1 | 0.48mi |
| 1723 N Chestnut Ave Unit 102 Fayetteville, AR | 2.0 | 2.0 | 1200 | $1,800 | $1.50 | 21d | 1 | 0.50mi |
| 1536 N London Ave Fayetteville, AR | 3.0 | 2.5 | 1505 | $1,695 | $1.13 | 43d | 1 | 0.51mi |
| 1071 W Malibu St Fayetteville, AR | 3.0 | 2.5 | 1505 | $1,695 | $1.13 | 23d | 1 | 0.54mi |
| 1433 N Garland Ave Fayetteville, AR | 2.0 | 1.0 | 960 | $1,125 | $1.17 | 43d | 1 | 0.55mi |
| 1773 N Chestnut Ave Fayetteville, AR | 3.0 | 2.0 | 1450 | $1,395 | $0.96 | 43d | 1 | 0.56mi |
| 1764 N Leverett Ave Fayetteville, AR | 3.0 | 1.0–2.0 | 751 | $1,425 | $1.90 | 13d | 22 | 0.57mi |
| 1223 Haven Dr Fayetteville, AR | 2.0–4.0 | 2.0–4.0 | 1146 | $2,229 | $1.94 | 21d | 1 | 0.58mi |
| 1117 N Washington Ave Unit 1221908P Fayetteville, AR | 3.0 | 2.0 | 1743 | $5,016 | $2.88 | 14d | 1 | 0.61mi |
| 1246 W James St Unit 2 Fayetteville, AR | 3.0 | 3.5 | 1800 | $3,250 | $1.81 | 43d | 1 | 0.61mi |
| 145 Baxter Ln Unit 1241294P Fayetteville, AR | 3.0 | 2.0 | 1194 | $6,340 | $5.31 | 14d | 1 | 0.64mi |
| 1882 N Scull Creek Dr Fayetteville, AR | 2.0 | 2.5 | 1450 | $1,395 | $0.96 | 43d | 1 | 0.65mi |
| 339 N West Ave Unit 1221798P Fayetteville, AR | 2.0 | 2.0 | 1291 | $6,610 | $5.12 | 14d | 1 | 0.68mi |
| 40 E Maple St Unit 3 Fayetteville, AR | 2.0 | 2.0 | 1400 | $1,600 | $1.14 | 43d | 1 | 0.70mi |
| 299 E Noble Ln Unit 1221799P Fayetteville, AR | 2.0 | 2.5 | 1431 | $7,937 | $5.55 | 14d | 1 | 0.71mi |
| 820 W Piedmont Pl Unit 3 Fayetteville, AR | 2.0 | 1.5 | 1000 | $900 | $0.90 | 44d | 1 | 0.72mi |
Listing history 8 events
-
2026-06-02status $267,000 Pending 16 DOM
-
2026-06-01days on market $267,000 Active 16 DOM
-
2026-05-31days on market $267,000 Active 15 DOM
-
2026-05-31days on market $267,000 Active 14 DOM
-
2026-05-17status Pending 947-char remark
-
2026-05-13$267,000 Active 947-char remark
-
2001-06-12soldstatus $85,000
-
2000-02-28soldstatus $10,000
ⓘ Source: listings_history table (triggers on properties + properties_extension) + one-shot
backfill from property_details.listing_events for pre-trigger history.
Climate risk First Street
- Flood 1/10 Low FEMA zone X (unshaded) · 0% chance over 30 yrs
- Wildfire 1/10 Low
- Heat 5/10 Major 7 d/yr ≥106°F today · 21 d/yr by 30 yrs out
- Wind 2/10 Low 2% chance of damaging wind over 30 yrs
- Air quality 1/10 Low 0 unhealthy d/yr today · 0 by 30 yrs out
Nearby sold comps map
Loading sold comps map…
Walkable amenities ~0.75 mi
Loading nearby amenities…
Taxation est. · year 1
- Rental income
- $22,056
- − Mortgage interest
- −$14,956
- − Property taxes
- −$4,005
- − Insurance
- −$1,335
- − Repairs & maintenance
- −$1,764
- − Management
- −$1,764
- − Depreciation
- −$7,767
- Taxable loss
- −$9,536
- Est. tax savings @ 24.0%
- +$2,289
- After-tax cash flow
- $-2,429/yr
For passive investors: Depreciation is non-cash, so a rental often shows a tax loss while cash-flowing — sheltering income. Rental losses are passive: they offset passive income freely, and up to $25,000/yr can offset ordinary (W-2) income if you actively participate and your MAGI is under $100k (phasing out to $0 by $150k); unused losses carry forward. On sale, claimed depreciation is recaptured at up to 25%, and gains may owe capital-gains tax (a 1031 exchange can defer both). Figures are a year-1 estimate at your 24.0% rate — not tax advice; consult a CPA.
Schools (NCES district)
- District
- Fayetteville School District
- NCES district ID
- 0506120
- Math proficiency
- 50% ▼ -11.00%
- Reading proficiency
- 49% ▼ -8.00%
- Median HH income
- $39,595
- Composite
- 41.39/100
- National rank
- #3477
- State rank
- #19 of 238 in AR
Livability — Fayetteville
- Score
- 83/100
- State rank
- #3
- US rank
- #871
Category grades
Schools grade is shown separately in the Schools card above.
Census & demographics
- Census place
- Fayetteville, AR
- County
- Washington County · 252,056 people
- City population
- 118,228
- Metro
- Fayetteville-Springdale-Rogers, AR
- Population (ZIP)
- 49,835
- Household income
- $55,506
- Rent vs Own
- Severe rent burden
- 2582.0
Population outlook (Washington County) Hauer SSP2
- Today (2025)
- 271,748 people
- By 2030
- 296,414 · +9.1%
- By 2040
- 346,874 · +27.6%
- By 2050
- 398,552 · +46.7%
- By 2075
- 523,309 · +92.6%
- By 2100
- 615,280 · +126.4%
Race, ethnicity, and origin ACS 2023
- Neighborhood character
- Predominantly White (73%)
- Race & ethnicity
- White 73% Two or more races 12% Hispanic / Latino 8% Black 5% Asian 3% Native American 1%
- Hispanic origin (detail)
- Mexican 5%
- Common ancestry
- Italian 3% Lithuanian 2% Slovak 2%
- Foreign-born
- 5% · Canada, China, Vietnam
- Languages at home
- 93% English-only · Spanish 4% Other Indo-European 1%
Political lean MEDSL · Washington
- 2024 margin
- Lean R (+6.7) · D 45.1% · R 51.7% · Other 3.2%
- 2008→2024 swing
- +6.4pp toward D · 2008: -13.1pp · 2024: -6.7pp
- All cycles
- 2024: R+6.7 2020: R+3.9 2016: R+10.4 2012: R+16.3 2008: R+13.1
Not yet ingested
- Civics
- —
Market trends
- HPI YoY
- ▼ -326.86%
- Current HPI
- 329.5644
- Rent YoY
- ▲ 2.64%
- Metro
- Fayetteville-Springdale-Rogers, AR
- State GDP YoY
- ▲ 3.80%
- F500 in state
- 10
Industry mix (Fortune 500 HQ in AR)
| Industry | F500 HQs | Revenue |
|---|---|---|
| Retail | 1 | $681B |
|
||
| Food / Agriculture | 1 | $53B |
|
||
| Retail / Energy | 1 | $22B |
|
||
| Transportation / Logistics | 1 | $12B |
|
||
| Energy | 1 | $4B |
|
||
Price history
+2570.0% since first listed6 events — show timeline
- 2026-06-01 Pending — NWARMLS
- 2026-05-20 Relisted — NWARMLS
- 2026-05-17 Pending — NWARMLS
- 2026-05-13 Listed $267,000 NWARMLS
- 2001-06-12 Sold (Public Records) $85,000 Public Records
- 2000-02-28 Sold (Public Records) $10,000 Public Records
Property tax history
-5.1%/yrLatest (2025): $298 · -25.1% YoY. Source: county tax records.
Cash-flow waterfall
monthlySold comps — $/sqft
last 12 mo · ≤1 miLoading sold comps…