2804 Major St · Pea Ridge, AR
Flood risk 1/10 · Minimal
- FEMA flood zone
- X (unshaded)
- Chance of flooding over 30 yrs
- 0.0%
- Est. flood insurance / yr
- $507 – $1,088
Fire risk 5/10 · Moderate
- Est. fire insurance / yr
- $1,499 – $2,785
Heat risk 5/10 · Moderate
- Hot days now (above 104°F)
- 7 days/yr
- Hot days in 30 yrs
- 21 days/yr
Wind risk 3/10 · Minor
- Chance of severe wind over 30 yrs
- 5.0%
Air-quality risk 2/10 · Minimal
- Unhealthy air days now
- 0 days/yr
- Unhealthy air days in 30 yrs
- 1 days/yr
Risk factors via First Street. Map © Google.
Why this score? — see what drove the D- grade
The composite is a weighted blend of 9 inputs, each scored 0–100. Each bar is that input's sub-score; the figure is the points it added to the 100-point composite (weight × sub-score).
- Appreciation +8.7/10.0
- Cash flow +7.2/30.0
- ARV discount +6.8/15.0
- Schools +3.7/10.0
- Livability +3.4/5.0
- Rent growth +2.5/5.0
- Condition / age +2.5/5.0
- 1% rule +2.0/10.0
- DSCR +1.4/10.0
$278,250
🖨 Deal sheet (PDF) 📄 Offer letter ✓ Due diligence
Listing remarks
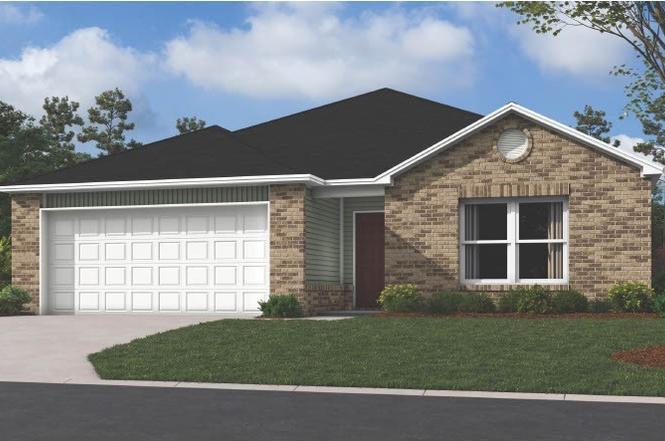
Introducing the delightful Foster II plan, a home design that welcomes you from the moment you arrive. Its charming curb appeal, featuring a front porch and thoughtfully landscaped front yard, creates an inviting atmosphere. This open-concept layout offers a spacious living experience with three comfortable bedrooms and two well-appointed bathrooms. The kitchen stands out as a highlight, fully equipped with energy-efficient appliances to make cooking a breeze. Discover the warmth and charm of the Foster II plan today! * Photos are of a similar model.
Key facts
- Front porch
- Open-concept layout
- 7,840 sq ft lot
Tags
Property features AI
Finance
- HOA & community: HOA fees charged monthly; Near hospital; Near schools; Near park
Exterior
- Parking: Attached garage; 2 covered spaces
- Security: Smoke detector(s)
- Utilities: Electricity available; Fiber optic available; Public water; Public sewer
- Home design: Single-story; New construction; Faces west; To be built
- Construction: Brick and vinyl siding exterior; Architectural shingle roof; Shingle roof; Slab foundation; Has home warranty
- Exterior features: Concrete driveway; Covered patio; Landscaped lot; Near park; Subdivision setting; Shared road frontage
Interior
- Kitchen: Dishwasher; Electric range; Plumbed for ice maker; ENERGY STAR qualified appliances
- Flooring: Carpet; Luxury vinyl plank
- Bathrooms: 2 full bathrooms
- Heating & cooling: Heat pump heating; Electric heating; Heat pump cooling; Electric cooling
- Interior features: Pantry; Walk-in closet(s)
- Laundry & utility: Washer hookup; Dryer hookup; Electric water heater
Neighborhood map
What this means for you Summary
Snapshot
- This is a 3-bed/2.0-bath single-family listed at $278k.
Deal economics
- At list price, monthly cash flow is $-377 ($-5k/yr) — negative.
- To cash-flow at today's rent, offer at most $224k (19.6% below list).
- To meet the 1% rule (rent ≥ 1% of price), the offer needs to be $196k (29.7% below list).
- Recommended offer: $196k (29.7% below list) — sets the bar for 1% rule.
- Cap rate 4.7% vs local median 3.5% in Pea Ridge — top-decile yield for the area; either an underpriced asset or a hidden risk that comps aren't pricing in. Stress-test before assuming the spread holds.
Location & tenants
- Location reads 67/100 on livability (#98 in AR) — a middle-class / working-renter tenant base. Strengths: employment A+, housing A+, cost of living A-; Watch: amenities F, commute F.
- Pea Ridge School District (suburban): math 43% / reading 42% proficiency, ranked #43 of 238 in AR (top 18%) — families likely to look elsewhere, expect single-tenant / working-renter base with shorter leases.
- Zoned schools: Pea Ridge Primary School (575 students, 36% FRL); Pea Ridge Middle School (math 47% / reading 42%, grade D, #61 of 201 statewide, top 32%, 395 students, 34% FRL); Pea Ridge High School (math 22% / reading 37%, grade F, #142 of 292 statewide, top 53%, 566 students, 24% FRL) — zoned schools at 31% FRL track the district average.
- Market conditions: 433 active listings in the ZIP; 6 comparable units currently listed for rent nearby; rentals lingering (median 46d on market — plan ~5-8 weeks vacancy on turnover, expect pricing pressure); 50% of comp listings sitting > 30 days — soft ceiling on asking rent; solid renter incomes; 4,359 units permitted in Benton County in 2024 (402 in 5+ unit buildings).
Forward outlook
- In year one you build about $23k of equity ($2k loan paydown + $21k appreciation (7.5% local appreciation)).
- Benton County population projected at +56% by 2050 — long-run rental-demand tailwind backs the buy-and-hold thesis.
- By year 2, paydown + projected appreciation supports a ~$36k cash-out refi (75% LTV) — recoverable capital for the next deal without selling this one.
Negotiation context
- It's been on market 64 days — a 6% lower offer ($262k) is reasonable based on typical stale-listing flexibility.
Risks & watch-outs
- Climate carrying-cost: moderate wildfire risk; extreme-heat days projected 7→21/yr by 2055 (HVAC capex compounding) — expect insurance premiums to compound above CPI over the hold.
Questions for the listing agent
- What do current leases actually rent for vs. the listed asking? Can we see a recent rent roll and the last 12 months of T-12 income?
- It's been on market 64 days. Have you received any prior offers? Is the seller open to a 30% concession, seller financing, or rate buy-down credit?
- Why hasn't it sold? Are there any deal-killer items the seller is aware of (foundation, flood, title, zoning, code violations)?
- Is there a deadline driving the sale (1031 exchange, divorce, estate, relocation)? That informs how much negotiation room exists.
- The area grade is low — what's the realistic commute time and amenity access for the typical tenant pool here? Any planned neighborhood developments (good or bad) we should know about?
- What's the average days-on-market for RENTAL listings here right now (not sales)? A rising rental-DOM trend means longer vacancies and softer asking-rent achievability than the comps imply.
- What's the recent tenant-quality profile in this submarket — average credit score on applications, eviction rate, late-payment / NSF rate, and stable-employment percentage? A property-management company in the area should have these aggregated.
- How much new for-sale + rental construction is in the pipeline within 1–3 miles? Heavy new supply typically softens prices + rents 12–24 months out; constrained supply supports both.
Investment metrics
- 1% rule
- 0.70% ✗
- Cap rate
- 4.66%
- Cash-on-cash
- -5.81%
- DSCR
- 0.74
- GRM
- 11.9
CMA / ARV
- ARV (on-the-fly)
- $273,710
- Comps found
- 12
Show comp detail 12 sales within ~0.75 mi
| Address | Dist | Beds/Ba | Sqft | Sold | Price | $/sf | Match |
|---|---|---|---|---|---|---|---|
| 2804 Major St | 0.00mi | 3/2.0 | 1,355 (0%) | 1mo | $278,250 | $205 | 99 |
| 2700 Chittick St | 0.09mi | 3/2.0 | 1,355 (0%) | 2mo | $285,900 | $211 | 94 |
| 2712 Chittick St | 0.13mi | 3/2.0 | 1,355 (0%) | 1mo | $275,250 | $203 | 93 |
| 2720 Chittick St | 0.09mi | 3/2.0 | 1,422 (+5%) | 2mo | $287,000 | $202 | 86 |
| 2704 Chittick St | 0.15mi | 3/2.0 | 1,422 (+5%) | 1mo | $279,900 | $197 | 84 |
| 2800 Major St | 0.01mi | 3/2.0 | 1,216 (-10%) | 1mo | $268,400 | $221 | 82 |
| 2709 Murphy St | 0.37mi | 3/2.0 | 1,422 (+5%) | 2mo | $272,000 | $191 | 73 |
| 2105 General Franz Sigel Dr | 0.51mi | 3/2.0 | 1,425 (+5%) | 0mo | $275,000 | $193 | 67 |
| 2820 Murphy St | 0.39mi | 3/2.0 | 1,218 (-10%) | 1mo | $265,000 | $218 | 64 |
| 2813 Bauer St | 0.41mi | 3/2.0 | 1,494 (+10%) | 1mo | $292,000 | $195 | 63 |
| 2709 Bauer St | 0.41mi | 4/2.0 (+1) | 1,453 (+7%) | 2mo | $280,000 | $193 | 62 |
| 2805 Bauer St | 0.40mi | 3/2.0 | 1,526 (+13%) | 2mo | $289,900 | $190 | 58 |
Match score weights: distance 35% · size 25% · config 20% · recency 20%. Top-matched comps best support the ARV.
Projected returns pro-forma
7.48% appreciation · 3.0% rent growth · sell at horizon
- IRR
- 14.4%
- Equity multiple
- 2.04×
- Total profit
- $81,375
- Equity at exit
- $201,569
- IRR
- 14.4%
- Equity multiple
- 4.26×
- Total profit
- $254,000
- Equity at exit
- $391,089
Cash invested: $77,910 (down + closing). Projections, not guarantees.
Landlord ↔ Tenant lean methodology
- Overall (STATE)
- 92 Strongly Landlord-Friendly
- State Arkansas
- 92 Strongly Landlord-Friendly · R+14
- County
- — inherits STATE
- City
- — inherits STATE
ZIP-level market 72751
- Home prices YoY
- 2.2%
- Active inventory
- 433
- Price-to-rent
- 11.9×
Monthly cashflow live
- Estimated rent
- $1,956 high interval (Pro) →
- Mortgage (P&I)
- −$1,459
- Tax est. 1.5%
- −$348 /mo · $4,174/yr
- Insurance
- −$116
- HOA
- −$0
- Lot rent
- −$0
- Vacancy / Maint / Mgmt
- −$411
- Net cashflow
- $-377
Break-even live
Sensitivity live
| Price | -10% $-185 | -5% $-281 | +0% $-377 | +5% $-474 | +10% $-570 |
|---|---|---|---|---|---|
| Rent | -10% $-532 | -5% $-455 | +0% $-377 | +5% $-300 | +10% $-223 |
| Rate | -1.0pp $-237 | -0.5pp $-307 | base $-377 | +0.5pp $-450 | +1.0pp $-523 |
UW: 25.0% down · 7.5% · 30yr · 1.5% tax · 5.0% vac · 8.0% maint · 8.0% mgmt
Financing live
Cash to close
- Down payment
- $69,562
- Closing costs
- $8,348
- Reserves months
- —
- Total cash needed
- —
Loan-product check · same deal, 3 products live
Conventional
25% down · 7.5% · 30yr
- Down + closing
- —
- Monthly P&I
- —
- Monthly cashflow
- —
- DSCR
- —
- Eligible?
- —
Personal DTI + credit; lowest rate.
DSCR
20% down · 8.5% · 30yr
- Down + closing
- —
- Monthly P&I
- —
- Monthly cashflow
- —
- DSCR
- —
- Eligible?
- —
No personal income docs; deal must DSCR.
Hard money
10% down · 12.0% · 12mo
- Down + closing
- —
- Monthly P&I
- —
- Monthly cashflow
- —
- DSCR
- —
- Eligible?
- —
Short-term bridge; refi at stabilization.
Rent comps 6 comps
| Address | Beds | Baths | Sqft | Rent | $/sqft | DOM | Units | Dist |
|---|---|---|---|---|---|---|---|---|
| 2608 Chittick St Pea Ridge, AR | 4.0 | 2.0 | 1630 | $1,795 | $1.10 | 46d | 1 | 0.23mi |
| 2720 Gorman St Pea Ridge, AR | 3.0 | 2.0 | 1480 | $1,695 | $1.15 | 16d | 1 | 0.26mi |
| 2813 Reynolds St Pea Ridge, AR | 3.0 | 2.0 | 1422 | $1,795 | $1.26 | 16d | 1 | 0.28mi |
| 2301 Langford St Pea Ridge, AR | 3.0 | 2.0 | 1637 | $1,800 | $1.10 | 23d | 1 | 0.75mi |
| 1910 Hahn St Pea Ridge, AR | 3.0 | 2.0 | 1555 | $1,900 | $1.22 | 46d | 1 | 0.76mi |
| 1812 Seay Cir Pea Ridge, AR | 4.0 | 2.5 | 1854 | $1,900 | $1.02 | 46d | 1 | 1.42mi |
Listing history 3 events
-
2026-04-30status Pending
-
2026-04-13price $278,250
-
2026-02-25$282,900 Active
ⓘ Source: listings_history table (triggers on properties + properties_extension) + one-shot
backfill from property_details.listing_events for pre-trigger history.
Climate risk First Street
- Flood 1/10 Low FEMA zone X (unshaded) · 0% chance over 30 yrs
- Wildfire 5/10 Major
- Heat 5/10 Major 7 d/yr ≥104°F today · 21 d/yr by 30 yrs out
- Wind 3/10 Moderate 5% chance of damaging wind over 30 yrs
- Air quality 2/10 Low 0 unhealthy d/yr today · 1 by 30 yrs out
Nearby sold comps map
Loading sold comps map…
Walkable amenities ~0.75 mi
Loading nearby amenities…
Taxation est. · year 1
- Rental income
- $23,475
- − Mortgage interest
- −$15,586
- − Property taxes
- −$4,174
- − Insurance
- −$1,391
- − Repairs & maintenance
- −$1,878
- − Management
- −$1,878
- − Depreciation
- −$8,095
- Taxable loss
- −$9,527
- Est. tax savings @ 24.0%
- +$2,286
- After-tax cash flow
- $-2,243/yr
For passive investors: Depreciation is non-cash, so a rental often shows a tax loss while cash-flowing — sheltering income. Rental losses are passive: they offset passive income freely, and up to $25,000/yr can offset ordinary (W-2) income if you actively participate and your MAGI is under $100k (phasing out to $0 by $150k); unused losses carry forward. On sale, claimed depreciation is recaptured at up to 25%, and gains may owe capital-gains tax (a 1031 exchange can defer both). Figures are a year-1 estimate at your 24.0% rate — not tax advice; consult a CPA.
Schools (NCES district)
- District
- Pea Ridge School District
- NCES district ID
- 0503030
- Math proficiency
- 43% ▼ -3.00%
- Reading proficiency
- 42% ▼ -8.00%
- Median HH income
- $53,156
- Composite
- 36.88/100
- National rank
- #4546
- State rank
- #43 of 238 in AR
Livability — Pea Ridge
- Score
- 67/100
- State rank
- #98
- US rank
- #10429
Category grades
Schools grade is shown separately in the Schools card above.
Census & demographics
- Census place
- Pea Ridge, AR
- County
- Benton County · 259,241 people
- City population
- 9,997
- Metro
- Fayetteville-Springdale-Rogers, AR
- Population (ZIP)
- 9,997
- Household income
- $95,299
- Rent vs Own
- Severe rent burden
- 83.0
Population outlook (Benton County) Hauer SSP2
- Today (2025)
- 318,683 people
- By 2030
- 353,481 · +10.9%
- By 2040
- 425,280 · +33.4%
- By 2050
- 497,239 · +56.0%
- By 2075
- 662,114 · +107.8%
- By 2100
- 776,431 · +143.6%
Race, ethnicity, and origin ACS 2023
- Neighborhood character
- Predominantly White (72%)
- Race & ethnicity
- White 72% Two or more races 17% Hispanic / Latino 7% Black 3%
- Hispanic origin (detail)
- Mexican 5%
- Common ancestry
- Slovak 4% Scottish 2% Lithuanian 2%
- Foreign-born
- 7% · Canada, Vietnam
- Languages at home
- 97% English-only · Spanish 2% Vietnamese 1%
Political lean MEDSL · Benton
- 2024 margin
- Strong R (+27.0) · D 35.2% · R 62.1% · Other 2.7%
- 2008→2024 swing
- +9.6pp toward D · 2008: -36.5pp · 2024: -27.0pp
- All cycles
- 2024: R+27.0 2020: R+26.4 2016: R+34.9 2012: R+40.4 2008: R+36.5
Not yet ingested
- Civics
- —
Market trends
- HPI YoY
- ▲ 7.48%
- Current HPI
- 352.7133
- Rent YoY
- —
- Metro
- Fayetteville-Springdale-Rogers, AR
- State GDP YoY
- ▲ 3.80%
- F500 in state
- 10
Industry mix (Fortune 500 HQ in AR)
| Industry | F500 HQs | Revenue |
|---|---|---|
| Retail | 1 | $681B |
|
||
| Food / Agriculture | 1 | $53B |
|
||
| Retail / Energy | 1 | $22B |
|
||
| Transportation / Logistics | 1 | $12B |
|
||
| Energy | 1 | $4B |
|
||
Price history
-1.6% since first listed3 events — show timeline
- 2026-04-30 Pending — NWARMLS
- 2026-04-13 Price Changed $278,250 NWARMLS
- 2026-02-25 Listed $282,900 NWARMLS
Cash-flow waterfall
monthlySold comps — $/sqft
last 12 mo · ≤1 miLoading sold comps…