 Duplex
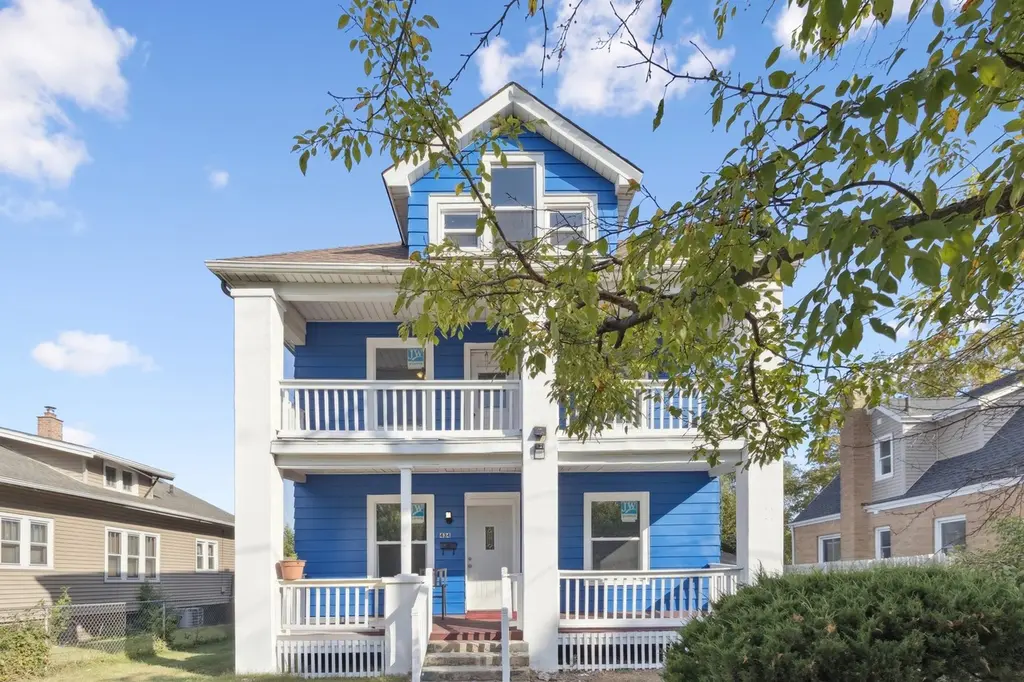
434 16th Ave · Rockford, IL
Flood risk 1/10 · Minimal
- FEMA flood zone
- X (unshaded)
- Chance of flooding over 30 yrs
- 0.0%
- Est. flood insurance / yr
- $473 – $860
Fire risk 1/10 · Minimal
- Est. fire insurance / yr
- $804 – $1,492
Heat risk 3/10 · Minor
- Hot days now (above 101°F)
- 7 days/yr
- Hot days in 30 yrs
- 15 days/yr
Wind risk 2/10 · Minimal
- Chance of severe wind over 30 yrs
- —
Air-quality risk 2/10 · Minimal
- Unhealthy air days now
- 1 days/yr
- Unhealthy air days in 30 yrs
- 2 days/yr
Risk factors via First Street. Map © Google.
Why this score? — see what drove the C+ grade
The composite is a weighted blend of 9 inputs, each scored 0–100. Each bar is that input's sub-score; the figure is the points it added to the 100-point composite (weight × sub-score).
- Cash flow +26.1/30.0
- DSCR +8.8/10.0
- ARV discount +7.5/15.0
- 1% rule +6.1/10.0
- Rent growth +4.9/5.0
- Livability +3.1/5.0
- Condition / age +2.5/5.0
- Schools +1.2/10.0
- Appreciation +0.0/10.0
$215,000
🖨 Deal sheet 📄 Offer letter ✓ Due diligence
Multi-family units
County records classify this as Multi-Family (2-4 Unit). Listing-text estimate: 2 units. confirmed
Listing remarks MLS
TURN KEY DUPLEX IN ROCKFORD offering a great investment opportunity! This well-maintained property features two spacious 3-bedroom, 1-bath units. Interior highlights include hardwood floors, updated bathrooms, and freshly painted kitchens. The property also offers a full basement, fenced backyard, storage shed, and a 2-car garage. Conveniently located near schools, dining, and everyday amenities. Ideal for an owner-occupant or an investor looking to expand their portfolio!
Key facts
- Turn key duplex
- Full basement
- Storage shed
Tags
Neighborhood map
What this means for you Summary
Snapshot
- This is a 2 × 3-bed/1.0-bath units multifamily listed at $215k.
Deal economics
- At list price, monthly cash flow is $544 ($7k/yr) — positive. Per door: $272/mo.
- The deal already cash-flows at list — no discount required.
- Meets the 1% rule at list price ($2k rent vs $215k).
- Cap rate 9.3% vs local median 6.1% in Rockford — top-decile yield for the area; either an underpriced asset or a hidden risk that comps aren't pricing in. Stress-test before assuming the spread holds.
Location & tenants
- Location reads 62/100 on livability (#876 in IL) — a middle-class / working-renter tenant base. Strengths: cost of living A+, housing A+, health & safety A+; Watch: schools F, crime F, amenities F.
- Rockford SD 205 (urban): math 12% / reading 16% proficiency, ranked #533 of 620 in IL (top 86%) — low school quality limits family demand, transient renter base, plan for 1-2y turnover; 73% free/reduced lunch — lower-income household profile, screen leases tightly.
- Market conditions: Rents rising fast (+9.7%/yr); 67 active listings in the ZIP; lower-income renter base — watch delinquency; 285 units permitted in Winnebago County in 2024 (0 in 5+ unit buildings).
- At $2,388/mo this rent would consume 85% of the median local household income ($34k/yr) (locally 1406% of renters already pay >50% of income on rent) — very limited rent-growth headroom before tenants either downsize or default.
Forward outlook
- Local home prices are declining (-3.0%/yr); year-one equity from $1k of loan paydown is wiped out by about $6k of value loss. Plan a longer hold.
- Winnebago County population projected at -20% by 2050 — secular population decline; favor cash flow + early exit over multi-decade hold.
- At projected returns (-3.0% appreciation + 8.0% rent growth), your $60k cash investment doubles in ~8 years — after that, you're playing with house money.
Negotiation context
- Only 11 days on market — expect competitive offers; lowballing is unlikely to land.
- 7 sale attempts with the ask held roughly flat each time — persistent listings suggest the price (not the market) is what's stuck; bring a comps-based counter.
- Current owner paid $57k; list at $215k implies a 278% gain — meaningful room to come down on a strong offer.
Risks & watch-outs
- Watch-outs: built in 1923 — expect roof / HVAC / electrical / plumbing capex.
Questions for the listing agent
- Can we see the unit-by-unit rent roll, current vacancy, and any below-market leases? What's the average tenancy length?
- What capital expenditures (roof, boiler, parking lot, exteriors) have been made in the last 5 years, and what's planned in the next 2?
- Built in 1923 — when were the roof, HVAC, electrical panel, plumbing, and water heater last replaced?
- Is there a deadline driving the sale (1031 exchange, divorce, estate, relocation)? That informs how much negotiation room exists.
- Schools are F-rated, which usually means shorter tenancies and higher turnover. Who's the typical renter profile here, and what's been the actual vacancy rate?
- Crime grade is F in this area — have there been break-ins, vandalism, or insurance claims at this property in the last 3 years? What carrier currently insures it and at what premium?
- What's the average days-on-market for RENTAL listings here right now (not sales)? A rising rental-DOM trend means longer vacancies and softer asking-rent achievability than the comps imply.
- What's the recent tenant-quality profile in this submarket — average credit score on applications, eviction rate, late-payment / NSF rate, and stable-employment percentage? A property-management company in the area should have these aggregated.
- How much new apartment / multifamily construction is in the pipeline within 1–3 miles? Heavy new supply (>2% of stock underway) typically softens rents 12–24 months out; light construction supports rent growth.
Investment metrics
- 1% rule
- 1.11% ✓
- Cap rate
- 9.33%
- Cash-on-cash
- 10.85%
- DSCR
- 1.48
- GRM
- 7.5
CMA / ARV
- ARV (median comp)
- $138,555
- List price
- $215,000
- Delta
- 62.39%
- Verdict
- OVERPRICED
- Comps
- 16 within 1.0 mi
Projected returns pro-forma
-3.0% appreciation · 8.0% rent growth · sell at horizon
- IRR
- 5.0%
- Equity multiple
- 1.21×
- Total profit
- $12,403
- Equity at exit
- $32,057
- IRR
- 18.4%
- Equity multiple
- 2.87×
- Total profit
- $112,677
- Equity at exit
- $18,589
Cash invested: $60,200 (down + closing). Projections, not guarantees.
Landlord ↔ Tenant lean methodology
- Overall (STATE)
- 43 Moderately Tenant-Leaning
- State Illinois
- 43 Moderately Tenant-Leaning · D+7
- County
- — inherits STATE
- City
- — inherits STATE
ZIP-level market 61104
- Home prices YoY
- -21.4%
- Rents YoY
- 9.7%
- Active inventory
- 67
- Price-to-rent
- 15.0×
Monthly cashflow live
- Estimated rent
- $2,388 medium interval (Pro) →
- Mortgage (P&I)
- −$1,127
- Tax from tax record
- −$125 /mo · $1,500/yr
- Insurance
- −$90
- HOA
- −$0
- Vacancy / Maint / Mgmt
- −$501
- Net cashflow
- $544
Break-even live
2-unit breakdown (identical units grouped — click to expand)
| Units | Beds | Baths | Est. rent |
|---|---|---|---|
| 2× units | 3 | 1 | $2,388 |
| #1 | 3 | 1 | $1,194 |
| #2 | 3 | 1 | $1,194 |
| Total (2 units) | $2,388 | ||
UW: 25.0% down · 7.5% · 30yr · 1.5% tax · 5.0% vac · 8.0% maint · 8.0% mgmt
Financing live
Cash to close
- Down payment
- $53,750
- Closing costs
- $6,450
- Reserves months
- —
- Total cash needed
- —
Loan-product check · same deal, 3 products live
Conventional
25% down · 7.5% · 30yr
- Down + closing
- —
- Monthly P&I
- —
- Monthly cashflow
- —
- DSCR
- —
- Eligible?
- —
Personal DTI + credit; lowest rate.
DSCR
20% down · 8.5% · 30yr
- Down + closing
- —
- Monthly P&I
- —
- Monthly cashflow
- —
- DSCR
- —
- Eligible?
- —
No personal income docs; deal must DSCR.
Hard money
10% down · 12.0% · 12mo
- Down + closing
- —
- Monthly P&I
- —
- Monthly cashflow
- —
- DSCR
- —
- Eligible?
- —
Short-term bridge; refi at stabilization.
Listing history 33 events
-
2026-06-19days on market $215,000 Active 11 DOM
-
2026-06-18days on market $215,000 Active 10 DOM
-
2026-06-17days on market $215,000 Active 9 DOM
-
2026-06-16days on market $215,000 Active 8 DOM
-
2026-06-15days on market $215,000 Active 7 DOM
-
2026-06-14days on market $215,000 Active 5 DOM
-
2026-06-13days on market $215,000 Active 4 DOM
-
2026-06-10days on market $215,000 Active 2 DOM
-
2026-06-09pricedays on market $215,000 Active 1 DOM
-
2026-06-08days on market $225,000 Active 95 DOM
-
2026-06-07days on market $225,000 Active 94 DOM
-
2026-06-03days on market $225,000 Active 90 DOM
-
2026-06-02days on market $225,000 Active 89 DOM
-
2026-06-01days on market $225,000 Active 88 DOM
-
2026-05-31days on market $225,000 Active 87 DOM
-
2026-05-30days on market $225,000 Active 86 DOM
-
2026-03-05$225,000 Active 477-char remark
Show marketing remark (477 chars)
TURN KEY DUPLEX IN ROCKFORD offering a great investment opportunity! This well-maintained property features two spacious 3-bedroom, 1-bath units. Interior highlights include hardwood floors, updated bathrooms, and freshly painted kitchens. The property also offers a full basement, fenced backyard, storage shed, and a 2-car garage. Conveniently located near schools, dining, and everyday amenities. Ideal for an owner-occupant or an investor looking to expand their portfolio!
-
2026-02-07historical
-
2025-12-03historical
-
2025-12-02Active
-
2025-11-09status Active
-
2025-10-15status Pending
-
2025-10-07price
-
2025-10-07Active
-
2025-06-27soldstatus $56,900 Closed
-
2025-06-27soldstatus $56,900 Closed
-
2025-05-23status Pending
-
2025-05-23status Pending
-
2025-05-01$56,900 Active
-
2025-05-01$56,900 Active
-
1997-03-18soldstatus $49,000
-
1997-03-18soldstatus $49,000
ⓘ Source: listings_history table (triggers on properties + properties_extension) + one-shot
backfill from property_details.listing_events for pre-trigger history.
Tax reassessment forecast IL · Partial reset (capped growth)
- Current annual tax
- $1,500 · $125/mo
- Projected year-2 tax
- $3,190 · $266/mo
- Expected delta
- +$1,690/yr (+$141/mo · 112.7%)
ⓘ Screening estimate from a state-policy table — verify with the county assessor before closing.
Climate risk First Street
- Flood 1/10 Low FEMA zone X (unshaded) · 0% chance over 30 yrs
- Wildfire 1/10 Low
- Heat 3/10 Moderate 7 d/yr ≥101°F today · 15 d/yr by 30 yrs out
- Wind 2/10 Low
- Air quality 2/10 Low 1 unhealthy d/yr today · 2 by 30 yrs out
Nearby sold comps map
Loading sold comps map…
Walkable amenities ~0.75 mi
Loading nearby amenities…
Taxation est. · year 1
- Rental income
- $28,656
- − Mortgage interest
- −$12,043
- − Property taxes
- −$1,500
- − Insurance
- −$1,075
- − Repairs & maintenance
- −$2,292
- − Management
- −$2,292
- − Depreciation
- −$6,255
- Taxable income
- $3,198
- Est. tax owed @ 24.0%
- −$767
- After-tax cash flow
- $5,766/yr
For passive investors: Depreciation is non-cash, so a rental often shows a tax loss while cash-flowing — sheltering income. Rental losses are passive: they offset passive income freely, and up to $25,000/yr can offset ordinary (W-2) income if you actively participate and your MAGI is under $100k (phasing out to $0 by $150k); unused losses carry forward. On sale, claimed depreciation is recaptured at up to 25%, and gains may owe capital-gains tax (a 1031 exchange can defer both). Figures are a year-1 estimate at your 24.0% rate — not tax advice; consult a CPA.
Schools (NCES district)
- District
- Rockford SD 205
- NCES district ID
- 1734510
- Math proficiency
- 12% ▼ -2.00%
- Reading proficiency
- 16% ▼ -3.00%
- Median HH income
- $42,533
- Composite
- 12.21/100
- National rank
- #9649
- State rank
- #533 of 620 in IL
Livability — Rockford
- Score
- 62/100
- State rank
- #876
- US rank
- #17035
Category grades
Schools grade is shown separately in the Schools card above.
Census & demographics
- Census place
- Rockford, IL
- County
- Winnebago County · 147,297 people
- City population
- 147,297
- Metro
- Rockford, IL
- Population (ZIP)
- 17,222
- Household income
- $33,772
- Rent vs Own
- Severe rent burden
- 1406.0
Population outlook (Winnebago County) Hauer SSP2
- Today (2025)
- 271,080 people
- By 2030
- 260,684 · -3.8%
- By 2040
- 238,405 · -12.1%
- By 2050
- 216,129 · -20.3%
- By 2075
- 172,882 · -36.2%
- By 2100
- 135,336 · -50.1%
Race, ethnicity, and origin ACS 2023
- Neighborhood character
- Highly diverse neighborhood (Simpson 0.70)
- Race & ethnicity
- White 41% Hispanic / Latino 26% Black 25% Two or more races 13% Asian 4%
- Hispanic origin (detail)
- Mexican 22% Puerto Rican 2%
- Common ancestry
- Romanian 2% Portuguese 2% Lithuanian 2%
- Foreign-born
- 16% · Canada, South Korea, Philippines
- Languages at home
- 74% English-only · Spanish 18% Other Asian/Pacific 3% Russian/Polish/Slavic 1%
Political lean MEDSL · Winnebago
- 2024 margin
- Toss-up / Even · D 49.5% · R 49.0% · Other 1.5%
- 2008→2024 swing
- -12.2pp toward R · 2008: 12.8pp · 2024: 0.6pp
- All cycles
- 2024: D+0.6 2020: D+2.5 2016: R+1.2 2012: D+5.7 2008: D+12.8
Not yet ingested
- Civics
- —
Market trends
- HPI YoY
- ▼ -63.40%
- Current HPI
- 233.0219
- Rent YoY
- ▲ 9.67%
- Metro
- Rockford, IL
- State GDP YoY
- ▲ 1.59%
- F500 in state
- 60
Industry mix (Fortune 500 HQ in IL)
| Industry | F500 HQs | Revenue |
|---|---|---|
| Insurance | 4 | $201B |
|
||
| Consumer Goods | 4 | $87B |
|
||
| Industrial Machinery | 3 | $64B |
|
||
| Healthcare | 2 | $55B |
|
||
| Retail / Pharmacy | 1 | $148B |
|
||
| Agriculture / Food | 1 | $86B |
|
||
Price history
+359.2% since first listed17 events — show timeline
- 2026-03-05 Listed $225,000 NWIAR
- 2026-03-05 Listed $225,000 MRED as Distributed by MLS Grid
- 2026-02-07 Listing Removed — MRED as Distributed by MLS Grid
- 2025-12-03 Listing Removed — MRED as Distributed by MLS Grid
- 2025-12-02 Listed — MRED as Distributed by MLS Grid
- 2025-11-09 Relisted — MRED as Distributed by MLS Grid
- 2025-10-15 Pending — MRED as Distributed by MLS Grid
- 2025-10-07 Price Changed — MRED as Distributed by MLS Grid
- 2025-10-07 Listed — MRED as Distributed by MLS Grid
- 2025-06-27 Sold (MLS) $56,900 NWIAR
- 2025-06-27 Sold (MLS) $56,900 MRED as Distributed by MLS Grid
- 2025-05-23 Pending — NWIAR
- 2025-05-23 Pending — MRED as Distributed by MLS Grid
- 2025-05-01 Listed $56,900 NWIAR
- 2025-05-01 Listed $56,900 MRED as Distributed by MLS Grid
- 1997-03-18 Sold (Public Records) $49,000 Public Records
- 1997-03-18 Sold (Public Records) $49,000 Public Records
Property tax history
-2.3%/yrLatest (2024): $1,500 · +9.0% YoY. Source: county tax records.
Cash-flow waterfall
monthlySold comps — $/sqft
last 12 mo · ≤1 miLoading sold comps…