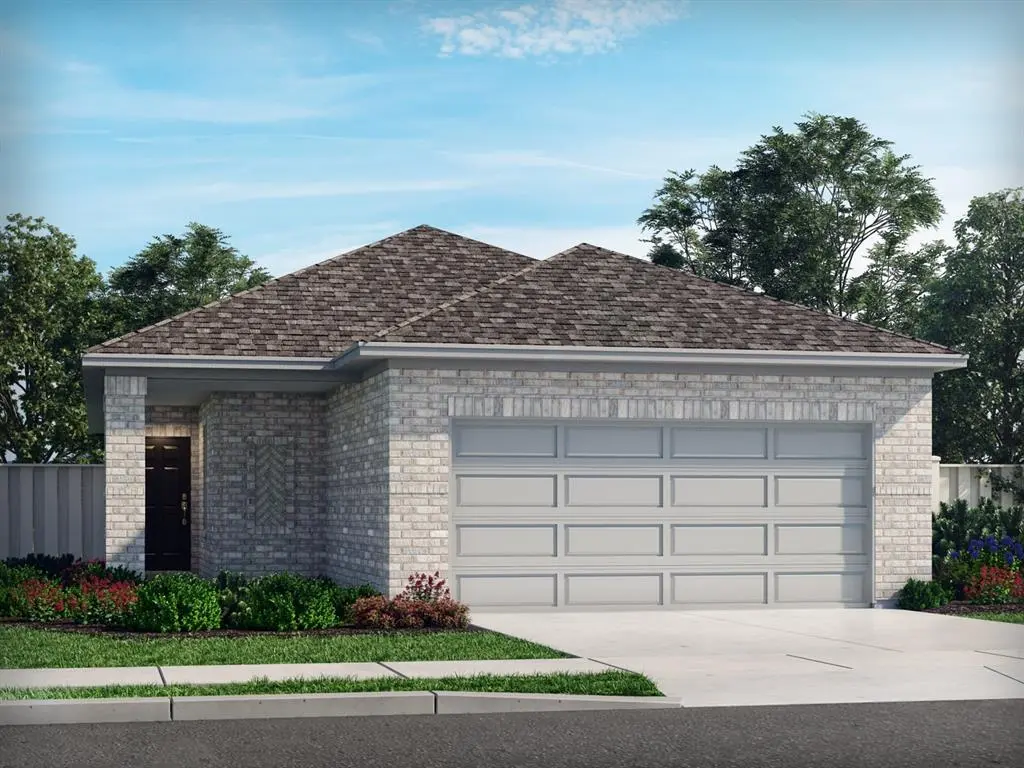
410 Dorothy Dr · Princeton, TX
Flood risk 1/10 · Minimal
- FEMA flood zone
- X (unshaded)
- Chance of flooding over 30 yrs
- 0.0%
- Est. flood insurance / yr
- $507 – $1,088
Fire risk 3/10 · Minor
- Est. fire insurance / yr
- $1,222 – $2,270
Heat risk 7/10 · Major
- Hot days now (above 110°F)
- 7 days/yr
- Hot days in 30 yrs
- 23 days/yr
Wind risk 6/10 · Moderate
- Chance of severe wind over 30 yrs
- 27.0%
Air-quality risk 3/10 · Minor
- Unhealthy air days now
- 3 days/yr
- Unhealthy air days in 30 yrs
- 3 days/yr
Risk factors via First Street. Map © Google.
Why this score? — see what drove the D grade
The composite is a weighted blend of 9 inputs, each scored 0–100. Each bar is that input's sub-score; the figure is the points it added to the 100-point composite (weight × sub-score).
- Cash flow +10.1/30.0
- ARV discount +9.8/15.0
- Condition / age +5.0/5.0
- Schools +4.2/10.0
- 1% rule +3.3/10.0
- Livability +3.1/5.0
- DSCR +2.9/10.0
- Rent growth +2.0/5.0
- Appreciation +0.0/10.0
$265,667
🖨 Deal sheet 📄 Offer letter ✓ Due diligence
Listing remarks
BRAND NEW energy - efficient home Jun 2026! Enjoy family dinners around the kitchen island in the Sequoia's convenient eat-in kitchen. Spend your weekends by the resort-style community pool or splashing with the kids at the nearby playground. Located off US 380, Southridge is just minutes from major employment centers and premier shopping, dining, and entertainment. Each energy-efficient home also comes standard with features that go beyond helping you save on utility bills—they allow your whole family to live better and breathe easier too. * Each of our homes is built with innovative, energy-efficient features designed to help you enjoy more savings, better health, real comfort and
Key facts
- 4,356 sq ft lot
- 2 garage spots
- Community pool
Property features AI
Finance
- Other: Builder special listing conditions; Possession at closing/funding; Listing status: Active
- Financial info: Accepted financing: 1031 Exchange, Cash, Conventional, FHA, VA; Treat as clear loan type; No second mortgage
- HOA & community: Mandatory association; Annual association fee of $600; Association includes full use of facilities and management fees; HOA managed by Neighborhood Management Inc
Exterior
- Parking: Covered parking for 2 vehicles; 2-car attached garage with single 2-car door and garage door opener; Garage dimensions approximately 20' x 20'
- Security: Smart home features (accessible)
- Utilities: City water; City sewer; Individual gas meter; Low-flow fixtures for water conservation; Not in a municipal utility district
- Home design: Single family residence; One story; New construction (incomplete, 2026); Not attached; Restrictions: easement(s), no divide, no livestock, no mobile home; Subdivision: Southridge
- Construction: Brick construction; Composition roof; Slab foundation; Year built 2026 (new construction - incomplete)
- Exterior features: Wood fencing; Less than 0.5 acre lot; Community pool; Greenbelt; Jogging/bike path; Park; Playground; Pool
Interior
- Kitchen: Dishwasher; Disposal; Gas cooktop; Gas oven; Microwave; Vented exhaust fan; Tankless water heater
- Bedrooms: Primary bedroom (level 1) with dual sinks, separate shower, and walk-in closet; Bedroom (level 1); Bedroom (level 1)
- Flooring: Carpet; Ceramic tile; Luxury vinyl plank
- Bathrooms: 2 full bathrooms
- Heating & cooling: Central heating; Heat pump; Energy-efficient cooling equipment
- Interior features: High-speed internet available; Smart home system; 7 total rooms; 1 living area; 1 dining area; Energy Star qualified equipment
- Laundry & utility: Laundry room (level 1)
Neighborhood map
What this means for you Summary
Snapshot
- This is a 3-bed/2.0-bath single-family listed at $266k. Condition is rated excellent.
Deal economics
- At list price, monthly cash flow is $-154 ($-2k/yr) — negative.
- To cash-flow at today's rent, offer at most $243k (8.4% below list).
- To meet the 1% rule (rent ≥ 1% of price), the offer needs to be $219k (17.5% below list).
- Recommended offer: $219k (17.5% below list) — sets the bar for 1% rule.
- Cap rate 5.6% vs local median 4.5% in Princeton — meaningfully above typical; check what's discounted (condition, days-on-market, listing class) to confirm the premium yield is real.
Location & tenants
- Location reads 62/100 on livability (#969 in TX) — a middle-class / working-renter tenant base. Strengths: employment A+, housing A+, cost of living A; Watch: schools C-, amenities F, commute F.
- Princeton ISD (suburban): math 51% / reading 47% proficiency, ranked #188 of 826 in TX (top 23%) — families likely to look elsewhere, expect single-tenant / working-renter base with shorter leases.
- Market conditions: Rents soft (-2.1%/yr); 2125 active listings in the ZIP; 40 comparable units currently listed for rent nearby; rentals lingering (median 44d on market — plan ~5-8 weeks vacancy on turnover, expect pricing pressure); 50% of comp listings sitting > 30 days — soft ceiling on asking rent; high-income renter base; 19,194 units permitted in Collin County in 2024 (3,988 in 5+ unit buildings).
Forward outlook
- Local home prices are declining (-3.0%/yr); year-one equity from $2k of loan paydown is wiped out by about $8k of value loss. Plan a longer hold.
- Collin County population projected at +60% by 2050 — long-run rental-demand tailwind backs the buy-and-hold thesis.
Negotiation context
- Only 13 days on market — expect competitive offers; lowballing is unlikely to land.
Risks & watch-outs
- Climate carrying-cost: major wind risk, 27% chance of damaging wind over 30y; extreme-heat days projected 7→23/yr by 2055 (HVAC capex compounding) — expect insurance premiums to compound above CPI over the hold.
Questions for the listing agent
- What do current leases actually rent for vs. the listed asking? Can we see a recent rent roll and the last 12 months of T-12 income?
- What does the HOA fee cover, when was the last increase, and are there any pending special assessments or reserve-fund shortfalls?
- Is there a deadline driving the sale (1031 exchange, divorce, estate, relocation)? That informs how much negotiation room exists.
- The area grade is low — what's the realistic commute time and amenity access for the typical tenant pool here? Any planned neighborhood developments (good or bad) we should know about?
- What's the average days-on-market for RENTAL listings here right now (not sales)? A rising rental-DOM trend means longer vacancies and softer asking-rent achievability than the comps imply.
- What's the recent tenant-quality profile in this submarket — average credit score on applications, eviction rate, late-payment / NSF rate, and stable-employment percentage? A property-management company in the area should have these aggregated.
- How much new for-sale + rental construction is in the pipeline within 1–3 miles? Heavy new supply typically softens prices + rents 12–24 months out; constrained supply supports both.
Investment metrics
- 1% rule
- 0.83% ✗
- Cap rate
- 5.60%
- Cash-on-cash
- -2.49%
- DSCR
- 0.89
- GRM
- 10.1
CMA / ARV
- ARV (median comp)
- $279,652
- List price
- $265,667
- Delta
- -5.00%
- Verdict
- FAIR
- Comps
- 20 within 1.0 mi
Show comp detail 12 sales within ~0.75 mi
| Address | Dist | Beds/Ba | Sqft | Sold | Price | $/sf | Match |
|---|---|---|---|---|---|---|---|
| 501 Dorothy Dr | 0.08mi | 3/2.0 | 1,270 (0%) | 0mo | $268,557 | $211 | 96 |
| 506 Dorothy Dr | 0.09mi | 3/2.0 | 1,270 (0%) | 1mo | $268,057 | $211 | 95 |
| 511 Green Gables Dr | 0.11mi | 3/2.0 | 1,270 (0%) | 2mo | $269,167 | $212 | 93 |
| 513 Dorothy Dr | 0.12mi | 3/2.0 | 1,270 (0%) | 2mo | $269,167 | $212 | 93 |
| 401 Green Gables Dr | 0.02mi | 3/2.0 | 1,232 (-3%) | 5mo | $264,990 | $215 | 90 |
| 311 Green Gables Dr | 0.01mi | 3/2.0 | 1,335 (+5%) | 3mo | $269,990 | $202 | 88 |
| 3406 Brompton Dr | 0.16mi | 3/2.0 | 1,270 (0%) | 9mo | $297,062 | $234 | 85 |
| 204 Greenbriar Dr | 0.21mi | 3/2.0 | 1,232 (-3%) | 2mo | $264,990 | $215 | 84 |
| 415 Green Gables Dr | 0.06mi | 3/2.0 | 1,335 (+5%) | 7mo | $279,990 | $210 | 83 |
| 206 Greenbriar Dr | 0.20mi | 3/2.0 | 1,335 (+5%) | 2mo | $269,990 | $202 | 81 |
| 3414 Brompton Dr | 0.15mi | 3/2.0 | 1,318 (+4%) | 9mo | $295,112 | $224 | 79 |
| 804 Pine Beach Dr | 0.48mi | 3/2.0 | 1,232 (-3%) | 8mo | $264,990 | $215 | 66 |
Match score weights: distance 35% · size 25% · config 20% · recency 20%. Top-matched comps best support the ARV.
Projected returns pro-forma
-3.0% appreciation · 0.0% rent growth · sell at horizon
- IRR
- -23.9%
- Equity multiple
- 0.20×
- Total profit
- $-59,228
- Equity at exit
- $39,612
- IRR
- -31.0%
- Equity multiple
- -0.19×
- Total profit
- $-88,786
- Equity at exit
- $22,970
Cash invested: $74,387 (down + closing). Projections, not guarantees.
Landlord ↔ Tenant lean methodology
- Overall (STATE)
- 87 Strongly Landlord-Friendly
- State Texas
- 87 Strongly Landlord-Friendly · R+5
- County
- — inherits STATE
- City
- — inherits STATE
ZIP-level market 75071
- Home prices YoY
- -19.1%
- Rents YoY
- -2.1%
- Active inventory
- 2125
- Price-to-rent
- 10.1×
Monthly cashflow live
- Estimated rent
- $2,192 high interval (Pro) →
- Mortgage (P&I)
- −$1,393
- Tax est. 1.5%
- −$332 /mo · $3,985/yr
- Insurance
- −$111
- HOA
- −$50
- Vacancy / Maint / Mgmt
- −$460
- Net cashflow
- $-154
Break-even live
UW: 25.0% down · 7.5% · 30yr · 1.5% tax · 5.0% vac · 8.0% maint · 8.0% mgmt
Financing live
Cash to close
- Down payment
- $66,417
- Closing costs
- $7,970
- Reserves months
- —
- Total cash needed
- —
Loan-product check · same deal, 3 products live
Conventional
25% down · 7.5% · 30yr
- Down + closing
- —
- Monthly P&I
- —
- Monthly cashflow
- —
- DSCR
- —
- Eligible?
- —
Personal DTI + credit; lowest rate.
DSCR
20% down · 8.5% · 30yr
- Down + closing
- —
- Monthly P&I
- —
- Monthly cashflow
- —
- DSCR
- —
- Eligible?
- —
No personal income docs; deal must DSCR.
Hard money
10% down · 12.0% · 12mo
- Down + closing
- —
- Monthly P&I
- —
- Monthly cashflow
- —
- DSCR
- —
- Eligible?
- —
Short-term bridge; refi at stabilization.
Rent comps 40 comps
| Address | Beds | Baths | Sqft | Rent | $/sqft | DOM | Units | Dist |
|---|---|---|---|---|---|---|---|---|
| 405 Green Gables Dr McKinney, TX | 3.0 | 2.0 | 1548 | $2,200 | $1.42 | 44d | 1 | 0.02mi |
| 501 Green Gables Dr McKinney, TX | 3.0 | 2.0 | 1551 | $2,200 | $1.42 | 7d | 1 | 0.06mi |
| 501 Dorothy Dr McKinney, TX | 3.0 | 2.0 | 1270 | $2,000 | $1.57 | 3d | 1 | 0.07mi |
| 503 Dorothy Dr McKinney, TX | 3.0 | 2.0 | 1498 | $2,200 | $1.47 | 22d | 1 | 0.08mi |
| 517 River Ridge Dr McKinney, TX | 4.0 | 2.0 | 1791 | $2,400 | $1.34 | 44d | 1 | 0.15mi |
| 3407 Copperwood Dr McKinney, TX | 3.0 | 2.0 | 1833 | $2,300 | $1.25 | 10d | 1 | 0.16mi |
| 519 Ridgedale DR McKinney, TX | 3.0 | 2.0 | 1318 | $2,098 | $1.59 | 44d | 1 | 0.27mi |
| 3906 Walmer WAY McKinney, TX | 3.0 | 2.0 | 1318 | $1,950 | $1.48 | 44d | 1 | 0.35mi |
| 206 Berkshire Dr McKinney, TX | 3.0 | 2.0 | 1334 | $1,999 | $1.50 | 44d | 1 | 0.35mi |
| 205 Travine Dr McKinney, TX | 3.0 | 2.0 | 1566 | $2,300 | $1.47 | 44d | 1 | 0.37mi |
| 4005 High Valley Dr McKinney, TX | 3.0 | 2.0 | 1600 | $2,100 | $1.31 | 44d | 1 | 0.42mi |
| 106 Travine Dr McKinney, TX | 3.0 | 2.0 | 1600 | $2,100 | $1.31 | 44d | 1 | 0.43mi |
| 206 Goosewood Dr McKinney, TX | 3.0 | 2.0 | 1566 | $2,300 | $1.47 | 19d | 1 | 0.82mi |
| 3007 Italia Ter Princeton, TX | 3.0 | 2.0 | 1800 | $2,300 | $1.28 | 24d | 1 | 0.96mi |
| 4908 Pebblewood Dr McKinney, TX | 4.0 | 2.0 | 1818 | $2,595 | $1.43 | 3d | 1 | 0.97mi |
| 2905 Cantoni Crk Princeton, TX | 4.0 | 2.0 | 1800 | $2,300 | $1.28 | 44d | 1 | 1.03mi |
| 421 Bertney Dr McKinney, TX | 3.0 | 2.0 | 1500 | $2,200 | $1.47 | 44d | 1 | 1.04mi |
| 610 Union Dr Princeton, TX | 4.0 | 2.0 | 1829 | $2,350 | $1.28 | 24d | 1 | 1.06mi |
| 114 Mountain Meadow Ln McKinney, TX | 3.0 | 2.0 | 1475 | $2,300 | $1.56 | 44d | 1 | 1.10mi |
| 108 Mountain Meadow Ln McKinney, TX | 3.0 | 2.0 | 1566 | $2,200 | $1.40 | 44d | 1 | 1.10mi |
| 3204 Ferrero Ln Princeton, TX | 3.0 | 2.0 | 1814 | $1,950 | $1.07 | 2d | 1 | 1.14mi |
| 111 Connecticut Ct Princeton, TX | 3.0 | 2.0 | 1412 | $1,895 | $1.34 | 21d | 1 | 1.14mi |
| 112 Connecticut Ct , TX | 3.0 | 2.5 | 1605 | $1,990 | $1.24 | 44d | 1 | 1.14mi |
| 2107 Camellia St Princeton, TX | 4.0 | 2.0 | 1829 | $2,200 | $1.20 | 13d | 1 | 1.18mi |
| 812 Indigo Rd Princeton, TX | 3.0 | 2.0 | 1653 | $2,200 | $1.33 | 44d | 1 | 1.20mi |
| 2313 States St Princeton, TX | 3.0 | 2.5 | 1826 | $2,200 | $1.20 | 24d | 1 | 1.23mi |
| 2307 States St Princeton, TX | 3.0 | 2.0 | 1412 | $1,800 | $1.27 | 44d | 1 | 1.25mi |
| 1101 Rainer Dr Princeton, TX | 4.0 | 2.0 | 1712 | $2,150 | $1.26 | 24d | 1 | 1.26mi |
| 2301 States St Princeton, TX | 3.0 | 2.0 | 1443 | $1,770 | $1.23 | 44d | 1 | 1.27mi |
| 4330 FM 75 Princeton, TX | 4.0 | 2.0 | 1832 | $2,200 | $1.20 | 10d | 1 | 1.28mi |
| 216 Savannah Way Princeton, TX | 3.0 | 2.5 | 1650 | $1,875 | $1.14 | 7d | 1 | 1.31mi |
| 1212 Roman Dr Princeton, TX | 4.0 | 2.0 | 1712 | $1,895 | $1.11 | 17d | 1 | 1.33mi |
| 1114 Bellevue Dr Princeton, TX | 4.0 | 2.0 | 1591 | $1,949 | $1.23 | 2d | 1 | 1.35mi |
| 2207 Pioneer Dr Unit 2207 Princeton, TX | 3.0 | 2.0 | 1412 | $2,100 | $1.49 | 13d | 1 | 1.35mi |
| 2119 Hamilton St Princeton, TX | 3.0 | 2.5 | 1605 | $2,000 | $1.25 | 44d | 1 | 1.36mi |
| 506 Towerglen Dr McKinney, TX | 3.0 | 2.0 | 1503 | $2,100 | $1.40 | 44d | 1 | 1.42mi |
| 1210 Augustin Dr Princeton, TX | 4.0 | 2.0 | 1760 | $1,750 | $0.99 | 18d | 1 | 1.43mi |
| 519 Green Grass Dr McKinney, TX | 3.0 | 2.0 | 1450 | $2,500 | $1.72 | 1d | 1 | 1.43mi |
| 2117 Revere Dr Princeton, TX | 3.0 | 2.5 | 1633 | $2,050 | $1.26 | 44d | 1 | 1.43mi |
| 1213 Lambert Dr Princeton, TX | 3.0 | 2.0 | 1691 | $1,995 | $1.18 | 44d | 1 | 1.47mi |
HOA detail
- Monthly dues
- $50 · $600/yr
- Likely covers
- pool
Listing history 3 events
-
2026-05-12status Pending 711-char remark
-
2026-05-02price $265,667 711-char remark
-
2026-04-29$263,667 Active 711-char remark
ⓘ Source: listings_history table (triggers on properties + properties_extension) + one-shot
backfill from property_details.listing_events for pre-trigger history.
Climate risk First Street
- Flood 1/10 Low FEMA zone X (unshaded) · 0% chance over 30 yrs
- Wildfire 3/10 Moderate
- Heat 7/10 Severe 7 d/yr ≥110°F today · 23 d/yr by 30 yrs out
- Wind 6/10 Major 27% chance of damaging wind over 30 yrs
- Air quality 3/10 Moderate 3 unhealthy d/yr today · 3 by 30 yrs out
Nearby sold comps map
Loading sold comps map…
Walkable amenities ~0.75 mi
Loading nearby amenities…
Taxation est. · year 1
- Rental income
- $26,306
- − Mortgage interest
- −$14,881
- − Property taxes
- −$3,985
- − Insurance
- −$1,328
- − Repairs & maintenance
- −$2,104
- − Management
- −$2,104
- − HOA
- −$600
- − Depreciation
- −$7,728
- Taxable loss
- −$6,426
- Est. tax savings @ 24.0%
- +$1,542
- After-tax cash flow
- $-308/yr
For passive investors: Depreciation is non-cash, so a rental often shows a tax loss while cash-flowing — sheltering income. Rental losses are passive: they offset passive income freely, and up to $25,000/yr can offset ordinary (W-2) income if you actively participate and your MAGI is under $100k (phasing out to $0 by $150k); unused losses carry forward. On sale, claimed depreciation is recaptured at up to 25%, and gains may owe capital-gains tax (a 1031 exchange can defer both). Figures are a year-1 estimate at your 24.0% rate — not tax advice; consult a CPA.
Condition & rehab AI · 2 photos
This brand-new energy-efficient home is move-in ready with no repairs or maintenance needed. It offers a high ROI with potential for both resale and rental value through minor updates.
Value-add opportunities
- Both Landscaping improvements — Enhances curb appeal and adds value for both resale and rental.
- Both Painting exterior and interior — Maintains the home's appearance and adds value for both resale and rental.
- Resale Upgrade appliances — Modernizes the kitchen and adds value for resale.
- Both Install smart home features — Enhances convenience and adds value for both resale and rental.
Renovation cost estimate screening
Value-add ROI direction
- Both Landscaping improvements — Enhances curb appeal and adds value for both resale and rental. ↑
- Both Painting exterior and interior — Maintains the home's appearance and adds value for both resale and rental. ↑
- Resale Upgrade appliances — Modernizes the kitchen and adds value for resale. ↑
- Both Install smart home features — Enhances convenience and adds value for both resale and rental. ↑
ⓘ Cost ranges are severity-bucket heuristics (US national rule-of-thumb). Get contractor quotes + a written scope before underwriting a rehab budget.
Schools (NCES district)
- District
- Princeton ISD
- NCES district ID
- 4835850
- Math proficiency
- 51% ▼ -8.00%
- Reading proficiency
- 47% ▬ 0.00%
- Median HH income
- $54,827
- Composite
- 42.44/100
- National rank
- #3226
- State rank
- #188 of 826 in TX
Livability — Princeton
- Score
- 62/100
- State rank
- #969
- US rank
- #17215
Category grades
Schools grade is shown separately in the Schools card above.
Census & demographics
- County
- Collin County · 1,159,394 people
- City population
- 34,171
- Metro
- Dallas-Fort Worth-Arlington, TX
- Population (ZIP)
- 72,964
- Household income
- $132,447
- Rent vs Own
- Severe rent burden
- 1682.0
Population outlook (Collin County) Hauer SSP2
- Today (2025)
- 1,210,074 people
- By 2030
- 1,358,201 · +12.2%
- By 2040
- 1,654,061 · +36.7%
- By 2050
- 1,937,359 · +60.1%
- By 2075
- 2,567,039 · +112.1%
- By 2100
- 2,952,048 · +144.0%
Race, ethnicity, and origin ACS 2023
- Neighborhood character
- Diverse neighborhood (Simpson 0.64)
- Race & ethnicity
- White 55% Hispanic / Latino 17% Black 13% Two or more races 12% Asian 10%
- Hispanic origin (detail)
- Mexican 12%
- Common ancestry
- Italian 2% Slovak 2% Portuguese 1%
- Foreign-born
- 16% · Canada, China, South Korea
- Languages at home
- 76% English-only · Spanish 11% Other Indo-European 4% Other Asian/Pacific 2%
Political lean MEDSL · Collin
- 2024 margin
- R (+11.1) · D 43.1% · R 54.3% · Other 2.6%
- 2008→2024 swing
- +14.4pp toward D · 2008: -25.6pp · 2024: -11.1pp
- All cycles
- 2024: R+11.1 2020: R+4.3 2016: R+17.0 2012: R+31.6 2008: R+25.6
Not yet ingested
- Civics
- —
Market trends
- HPI YoY
- ▼ -59.92%
- Current HPI
- 254.4946
- Rent YoY
- ▼ -2.15%
- Metro
- Dallas-Fort Worth-Arlington, TX
- State GDP YoY
- ▲ 3.95%
- F500 in state
- 110
Industry mix (Fortune 500 HQ in TX)
| Industry | F500 HQs | Revenue |
|---|---|---|
| Energy | 16 | $1,198B |
|
||
| Technology | 5 | $198B |
|
||
| Engineering / Construction | 4 | $72B |
|
||
| Energy Services | 3 | $60B |
|
||
| Utilities | 3 | $41B |
|
||
| Healthcare | 2 | $330B |
|
||
Price history
+0.8% since first listed3 events — show timeline
- 2026-05-12 Pending — NTREIS
- 2026-05-02 Price Changed $265,667 NTREIS
- 2026-04-29 Listed $263,667 NTREIS
Cash-flow waterfall
monthlySold comps — $/sqft
last 12 mo · ≤1 miLoading sold comps…