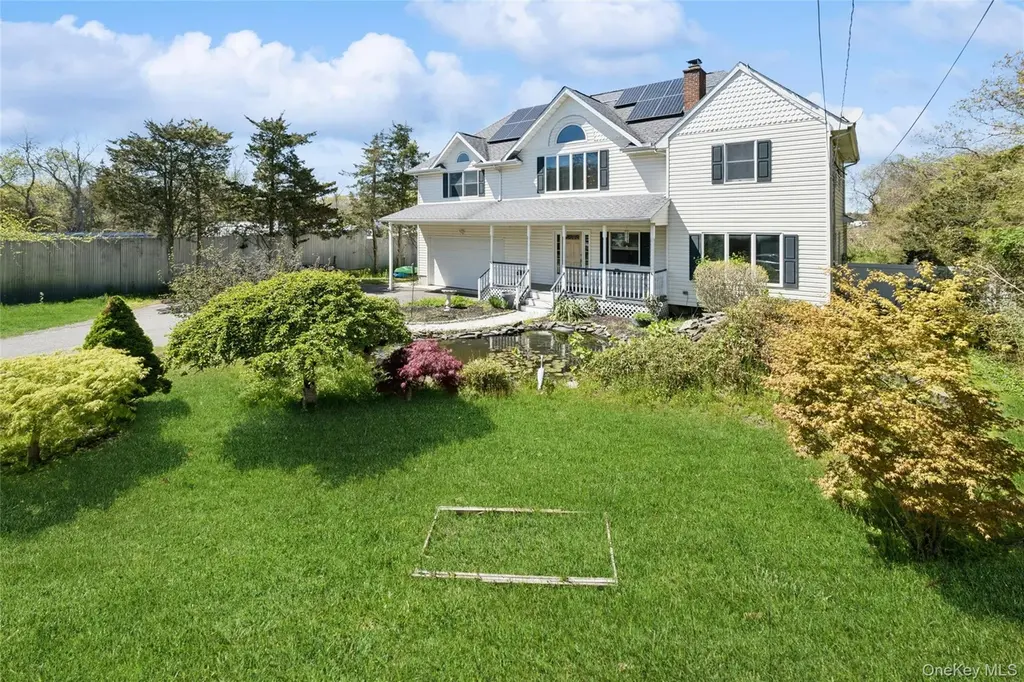
106 S Country Rd · Quiogue, NY
Flood risk 1/10 · Minimal
- FEMA flood zone
- X (unshaded)
- Chance of flooding over 30 yrs
- 0.0%
- Est. flood insurance / yr
- $473 – $860
Fire risk 1/10 · Minimal
- Est. fire insurance / yr
- $691 – $1,283
Heat risk 4/10 · Minor
- Hot days now (above 90°F)
- 7 days/yr
- Hot days in 30 yrs
- 19 days/yr
Wind risk 8/10 · Major
- Chance of severe wind over 30 yrs
- 80.0%
Air-quality risk 2/10 · Minimal
- Unhealthy air days now
- 2 days/yr
- Unhealthy air days in 30 yrs
- 2 days/yr
Risk factors via First Street. Map © Google.
Why this score? — see what drove the A grade
The composite is a weighted blend of 9 inputs, each scored 0–100. Each bar is that input's sub-score; the figure is the points it added to the 100-point composite (weight × sub-score).
- Cash flow +30.0/30.0
- ARV discount +15.0/15.0
- 1% rule +10.0/10.0
- DSCR +10.0/10.0
- Appreciation +10.0/10.0
- Schools +6.6/10.0
- Livability +3.0/5.0
- Rent growth +2.5/5.0
- Condition / age +2.5/5.0
$980,000
🖨 Deal sheet 📄 Offer letter ✓ Due diligence
Listing remarks
Nestled in the heart of Westhampton Beach, this beautifully maintained 4-bedroom, 3-bath home offers the perfect blend of comfort, charm, and entertaining space. From the cozy front porch, and stunning vaulted entry to the large sun-filled windows and warm wood-burning fireplace, every detail creates a welcoming atmosphere. The formal living room with French doors flows seamlessly into the extended living/dining area, making it ideal for gatherings and everyday living. The kitchen features stainless-steel appliances, while upstairs offers 4 spacious bedrooms with wood floors and two full baths. The primary bedroom includes a private balcony, with Primary Bath a perfect retreat with views of
Key facts
- French doors
- Formal living room
- Cozy front porch
Tags
Property features AI
Exterior
- Parking: Driveway; Garage (1.5 spaces)
- Utilities: Cesspool sewer; Cable available
- Home design: Single family residence; Two levels; Actual property condition
- Construction: Frame construction
- Exterior features: In-ground vinyl pool (private); Back yard fencing; Frame construction; Not waterfront
Interior
- Kitchen: Dishwasher; Gas range; Refrigerator; Eat-in kitchen
- Bedrooms: Bedrooms across two levels
- Flooring: Wood flooring
- Bathrooms: 3 full bathrooms
- Heating & cooling: Baseboard heating; No central cooling
- Interior features: First-floor full bath; Cathedral ceilings; Eat-in kitchen; Entrance foyer; Primary bathroom; Recessed lighting; Soaking tub; Walk-in closets; Unfinished basement; Partial attic with pull-down stairs; Solar panels
- Laundry & utility: Washer hookup (in basement); Electric dryer hookup (in basement); Washer and dryer included
Neighborhood map
What this means for you Summary
Snapshot
- This is a 5-bed/2.5-bath single-family listed at $980k.
Deal economics
- At list price, monthly cash flow is $13k ($159k/yr) — positive.
- The deal already cash-flows at list — no discount required.
- Meets the 1% rule at list price ($24k rent vs $980k).
- Recommended offer: $965k (1.5% below list) — sets the bar for market timing.
Location & tenants
- Location reads 59/100 on livability (#1,023 in NY) — a working-class tenant base; expect higher turnover. Strengths: crime A+, employment A+, housing B; Watch: amenities F, commute F, cost of living F.
- Westhampton Beach Union Free School District (suburban): math 72% / reading 75% proficiency, ranked #81 of 590 in NY (top 14%) — strong family-tenant draw, lease renewals of 3-5y typical.
- Zoned schools: Westhampton Beach Elementary School (math 67% / reading 67%, grade B+, #525 of 2,108 statewide, top 27%, 356 students, 43% FRL); Westhampton Middle School (math 61% / reading 63%, grade B+, #136 of 729 statewide, top 20%, 434 students, 26% FRL); Westhampton Beach Senior High School (math 90% / reading 96%, grade A+, #147 of 1,100 statewide, top 14%, 964 students, 24% FRL).
- Market conditions: 112 active listings in the ZIP; 8 comparable units currently listed for rent nearby; rentals lingering (median 44d on market — plan ~5-8 weeks vacancy on turnover, expect pricing pressure); 50% of comp listings sitting > 30 days — soft ceiling on asking rent; high-income renter base; 1,366 units permitted in Suffolk County in 2024 (216 in 5+ unit buildings).
- At $24,203/mo this rent would consume 232% of the median local household income ($125k/yr) (locally 43% of renters already pay >50% of income on rent) — very limited rent-growth headroom before tenants either downsize or default.
Forward outlook
- In year one you build about $105k of equity ($7k loan paydown + $98k appreciation (10.0% local appreciation)).
- Suffolk County population projected to shrink 5% by 2050 — rents likely to lag national; underwrite the cash flow, not the appreciation.
- At projected returns (10.0% appreciation + 3.0% rent growth), your $274k cash investment doubles in ~2 years — after that, you're playing with house money.
- By year 2, paydown + projected appreciation supports a ~$168k cash-out refi (75% LTV) — recoverable capital for the next deal without selling this one.
Negotiation context
- It's been on market 24 days — a 2% lower offer ($965k) is reasonable based on typical stale-listing flexibility.
- 2 sale attempts with the ask held roughly flat each time — persistent listings suggest the price (not the market) is what's stuck; bring a comps-based counter.
- Current owner paid $100k; list at $980k implies a 880% gain — meaningful room to come down on a strong offer.
Risks & watch-outs
- Climate carrying-cost: severe wind risk, 80% chance of damaging wind over 30y — expect insurance premiums to compound above CPI over the hold.
Questions for the listing agent
- Is there a deadline driving the sale (1031 exchange, divorce, estate, relocation)? That informs how much negotiation room exists.
- Schools are D-rated, which usually means shorter tenancies and higher turnover. Who's the typical renter profile here, and what's been the actual vacancy rate?
- What's the average days-on-market for RENTAL listings here right now (not sales)? A rising rental-DOM trend means longer vacancies and softer asking-rent achievability than the comps imply.
- What's the recent tenant-quality profile in this submarket — average credit score on applications, eviction rate, late-payment / NSF rate, and stable-employment percentage? A property-management company in the area should have these aggregated.
- How much new for-sale + rental construction is in the pipeline within 1–3 miles? Heavy new supply typically softens prices + rents 12–24 months out; constrained supply supports both.
Investment metrics
- 1% rule
- 2.47% ✓
- Cap rate
- 22.47%
- Cash-on-cash
- 57.77%
- DSCR
- 3.57
- GRM
- 3.4
CMA / ARV
- ARV (median comp)
- $1,895,082
- List price
- $980,000
- Delta
- -48.29%
- Verdict
- UNDERPRICED
- Comps
- 20 within 1.0 mi
Show comp detail 3 sales within ~0.75 mi
| Address | Dist | Beds/Ba | Sqft | Sold | Price | $/sf | Match |
|---|---|---|---|---|---|---|---|
| 31 Jeffrey Ln | 0.49mi | 4/3.5 (-1) | 2,433 (-1%) | 17mo | $2,000,000 | $822 | 52 |
| 28 Bridle Path | 0.54mi | 4/3.5 (-1) | 2,652 (+8%) | 14mo | $1,885,000 | $711 | 41 |
| 18 Pine St | 0.73mi | 4/3.5 (-1) | 2,340 (-5%) | 21mo | $1,800,000 | $769 | 31 |
Match score weights: distance 35% · size 25% · config 20% · recency 20%. Top-matched comps best support the ARV.
Projected returns pro-forma
10.0% appreciation · 3.0% rent growth · sell at horizon
- IRR
- 70.2%
- Equity multiple
- 6.01×
- Total profit
- $1,374,866
- Equity at exit
- $882,862
- IRR
- 64.0%
- Equity multiple
- 13.34×
- Total profit
- $3,386,838
- Equity at exit
- $1,903,924
Cash invested: $274,400 (down + closing). Projections, not guarantees.
Landlord ↔ Tenant lean methodology
- Overall (STATE)
- 15 Strongly Tenant-Friendly
- State New York
- 15 Strongly Tenant-Friendly · D+10
- County
- — inherits STATE
- City
- — inherits STATE
ZIP-level market 11978
- Home prices YoY
- 2.9%
- Active inventory
- 112
- Price-to-rent
- 3.4×
Monthly cashflow live
- Estimated rent
- $24,203 medium interval (Pro) →
- Mortgage (P&I)
- −$5,139
- Tax from tax record
- −$364 /mo · $4,365/yr
- Insurance
- −$408
- HOA
- −$0
- Vacancy / Maint / Mgmt
- −$5,083
- Net cashflow
- $13,209
Break-even live
UW: 25.0% down · 7.5% · 30yr · 1.5% tax · 5.0% vac · 8.0% maint · 8.0% mgmt
Financing live
Cash to close
- Down payment
- $245,000
- Closing costs
- $29,400
- Reserves months
- —
- Total cash needed
- —
Loan-product check · same deal, 3 products live
Conventional
25% down · 7.5% · 30yr
- Down + closing
- —
- Monthly P&I
- —
- Monthly cashflow
- —
- DSCR
- —
- Eligible?
- —
Personal DTI + credit; lowest rate.
DSCR
20% down · 8.5% · 30yr
- Down + closing
- —
- Monthly P&I
- —
- Monthly cashflow
- —
- DSCR
- —
- Eligible?
- —
No personal income docs; deal must DSCR.
Hard money
10% down · 12.0% · 12mo
- Down + closing
- —
- Monthly P&I
- —
- Monthly cashflow
- —
- DSCR
- —
- Eligible?
- —
Short-term bridge; refi at stabilization.
Rent comps 8 comps
| Address | Beds | Baths | Sqft | Rent | $/sqft | DOM | Units | Dist |
|---|---|---|---|---|---|---|---|---|
| 20 Jennifers Path Westhampton Beach, NY | 4.0 | 3.5 | 3000 | $20,000 | $6.67 | 22d | 1 | 0.37mi |
| 9 Ocame Ave Westhampton Beach, NY | 4.0 | 3.0 | 1823 | $20,000 | $10.97 | 43d | 1 | 0.48mi |
| 44 Griffing Ave Westhampton Beach, NY | 4.0 | 4.5 | 1825 | $12,000 | $6.58 | 19d | 1 | 0.84mi |
| 64 Aspatuck Rd Westhampton Beach, NY | 4.0 | 3.0 | 2157 | $10,000 | $4.64 | 43d | 1 | 0.87mi |
| 99 Beach Rd Westhampton Beach, NY | 4.0 | 2.5 | 2600 | $20,000 | $7.69 | 5d | 1 | 0.87mi |
| 60 Aspatuck Rd Westhampton Beach, NY | 4.0 | 3.0 | 2150 | $10,000 | $4.65 | 43d | 1 | 0.91mi |
| 38 Liberty St Westhampton Beach, NY | 4.0 | 2.5 | 2565 | $35,000 | $13.65 | 43d | 1 | 1.24mi |
| 37 School St Westhampton Beach, NY | 4.0 | 4.0 | 3204 | $50,000 | $15.61 | 22d | 1 | 1.32mi |
Listing history 12 events
-
2026-06-08status $980,000 Pending 24 DOM
-
2026-06-07days on market $980,000 Active 24 DOM
-
2026-06-04days on market $980,000 Active 21 DOM
-
2026-06-03days on market $980,000 Active 20 DOM
-
2026-06-02days on market $980,000 Active 19 DOM
-
2026-06-01days on market $980,000 Active 18 DOM
-
2026-05-31days on market $980,000 Active 17 DOM
-
2026-05-14$980,000 Active 1301-char remark
-
2025-09-26price $975,000
-
2025-07-14price $999,990
-
2025-05-29$1,200,000 Active
-
1997-01-23soldstatus $100,000
ⓘ Source: listings_history table (triggers on properties + properties_extension) + one-shot
backfill from property_details.listing_events for pre-trigger history.
Tax reassessment forecast NY · Partial reset (capped growth)
- Current annual tax
- $4,365 · $364/mo
- Projected year-2 tax
- $10,463 · $872/mo
- Expected delta
- +$6,099/yr (+$508/mo · 139.7%)
ⓘ Screening estimate from a state-policy table — verify with the county assessor before closing.
Climate risk First Street
- Flood 1/10 Low FEMA zone X (unshaded) · 0% chance over 30 yrs
- Wildfire 1/10 Low
- Heat 4/10 Moderate 7 d/yr ≥90°F today · 19 d/yr by 30 yrs out
- Wind 8/10 Severe 80% chance of damaging wind over 30 yrs
- Air quality 2/10 Low 2 unhealthy d/yr today · 2 by 30 yrs out
Nearby sold comps map
Loading sold comps map…
Walkable amenities ~0.75 mi
Loading nearby amenities…
Taxation est. · year 1
- Rental income
- $290,437
- − Mortgage interest
- −$54,895
- − Property taxes
- −$4,365
- − Insurance
- −$4,900
- − Repairs & maintenance
- −$23,235
- − Management
- −$23,235
- − Depreciation
- −$28,509
- Taxable income
- $151,298
- Est. tax owed @ 24.0%
- −$36,311
- After-tax cash flow
- $122,198/yr
For passive investors: Depreciation is non-cash, so a rental often shows a tax loss while cash-flowing — sheltering income. Rental losses are passive: they offset passive income freely, and up to $25,000/yr can offset ordinary (W-2) income if you actively participate and your MAGI is under $100k (phasing out to $0 by $150k); unused losses carry forward. On sale, claimed depreciation is recaptured at up to 25%, and gains may owe capital-gains tax (a 1031 exchange can defer both). Figures are a year-1 estimate at your 24.0% rate — not tax advice; consult a CPA.
Schools (NCES district)
- District
- Westhampton Beach Union Free School District
- NCES district ID
- 3631020
- Math proficiency
- 72% ▼ -5.00%
- Reading proficiency
- 75% ▲ 3.00%
- Median HH income
- $88,137
- Composite
- 65.91/100
- National rank
- #444
- State rank
- #81 of 590 in NY
Livability — Quiogue
- Score
- 59/100
- State rank
- #1023
- US rank
- #19962
Category grades
Schools grade is shown separately in the Schools card above.
Census & demographics
- Census place
- Quiogue, NY
- County
- Suffolk County · 679,920 people
- City population
- 4,376
- Metro
- New York-Newark-Jersey City, NY-NJ-PA
- Population (ZIP)
- 4,705
- Household income
- $125,179
- Rent vs Own
- Severe rent burden
- 43.0
Population outlook (Suffolk County) Hauer SSP2
- Today (2025)
- 1,505,262 people
- By 2030
- 1,498,318 · -0.5%
- By 2040
- 1,471,101 · -2.3%
- By 2050
- 1,424,848 · -5.3%
- By 2075
- 1,337,157 · -11.2%
- By 2100
- 1,217,720 · -19.1%
Race, ethnicity, and origin ACS 2023
- Neighborhood character
- Predominantly White (72%)
- Race & ethnicity
- White 72% Two or more races 14% Hispanic / Latino 11% Black 6% Asian 2%
- Hispanic origin (detail)
- Puerto Rican 1%
- Common ancestry
- Romanian 7% Scotch-Irish 2% Italian 2%
- Foreign-born
- 14% · Canada, Jamaica, China
- Languages at home
- 84% English-only · Spanish 10% Other Indo-European 2% Russian/Polish/Slavic 1%
Political lean MEDSL · Suffolk
- 2024 margin
- Lean R (+10.0) · D 45.0% · R 55.0%
- 2008→2024 swing
- -16.0pp toward R · 2008: 6.0pp · 2024: -10.0pp
- All cycles
- 2024: R+10.0 2020: R+0.0 2016: R+8.2 2012: D+2.9 2008: D+6.0
Not yet ingested
- Civics
- —
Market trends
- HPI YoY
- ▲ 13.02%
- Current HPI
- 460.3964
- Rent YoY
- —
- Metro
- New York-Newark-Jersey City, NY-NJ-PA
- State GDP YoY
- ▲ 2.60%
- F500 in state
- 92
Industry mix (Fortune 500 HQ in NY)
| Industry | F500 HQs | Revenue |
|---|---|---|
| Financial Services | 10 | $950B |
|
||
| Consumer Goods | 9 | $162B |
|
||
| Insurance | 4 | $225B |
|
||
| Telecommunications | 2 | $144B |
|
||
| Pharmaceuticals | 2 | $112B |
|
||
| Media / Entertainment | 2 | $69B |
|
||
Price history
+880.0% since first listed6 events — show timeline
- 2026-06-08 Pending — OneKey® MLS as Distributed by MLS Grid
- 2026-05-14 Listed $980,000 OneKey® MLS as Distributed by MLS Grid
- 2025-09-26 Price Changed $975,000 OneKey® MLS as Distributed by MLS Grid
- 2025-07-14 Price Changed $999,990 OneKey® MLS as Distributed by MLS Grid
- 2025-05-29 Listed $1,200,000 OneKey® MLS as Distributed by MLS Grid
- 1997-01-23 Sold (Public Records) $100,000 Public Records
Property tax history
+0.9%/yrLatest (2024): $4,365 · +0.0% YoY. Source: county tax records.
Cash-flow waterfall
monthlySold comps — $/sqft
last 12 mo · ≤1 miLoading sold comps…