 Duplex
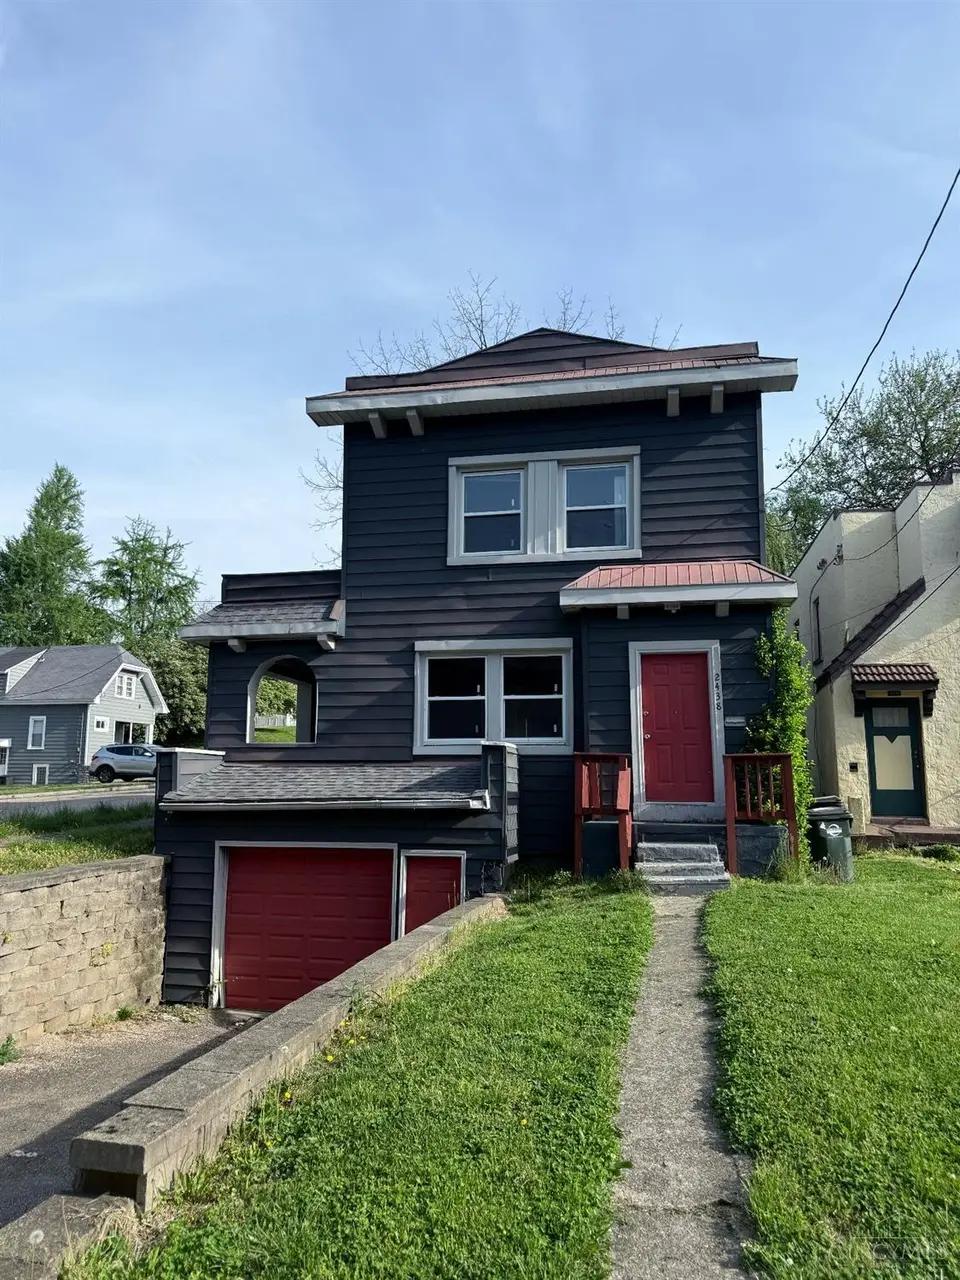
2438 Duck Creek Rd · Norwood, OH
Flood risk 9/10 · Severe
- FEMA flood zone
- X (unshaded)
- Chance of flooding over 30 yrs
- 0.99%
- Est. flood insurance / yr
- $473 – $860
Fire risk 1/10 · Minimal
- Est. fire insurance / yr
- $713 – $1,323
Heat risk 5/10 · Moderate
- Hot days now (above 103°F)
- 7 days/yr
- Hot days in 30 yrs
- 19 days/yr
Wind risk 2/10 · Minimal
- Chance of severe wind over 30 yrs
- 1.0%
Air-quality risk 3/10 · Minor
- Unhealthy air days now
- 2 days/yr
- Unhealthy air days in 30 yrs
- 3 days/yr
Risk factors via First Street. Map © Google.
Why this score? — see what drove the B+ grade
The composite is a weighted blend of 9 inputs, each scored 0–100. Each bar is that input's sub-score; the figure is the points it added to the 100-point composite (weight × sub-score).
- Cash flow +29.5/30.0
- ARV discount +15.0/15.0
- DSCR +10.0/10.0
- 1% rule +8.7/10.0
- Livability +4.0/5.0
- Schools +3.7/10.0
- Rent growth +2.6/5.0
- Condition / age +2.5/5.0
- Appreciation +0.0/10.0
$180,000
🖨 Deal sheet 📄 Offer letter ✓ Due diligence
Multi-family units
County records classify this as Multi-Family (2-4 Unit). Listing-text estimate: 2 units. confirmed
Listing remarks MLS
Attention investors! Opportunity awaits with this 2-family property in Norwood. Being sold as-is, a little TLC will go a long way. This property offers tremendous potential for strong rental income, or a quick rehab. Both units are 2 bedrooms, 1 bath. Features include garage, separate utilities, separate entrances, and a desirable corner lot. Great chance to build equity and/or maximize returns in a convenient location. Easy to show!
Key facts
- 2 family property
- Separate utilities
- Build equity
Tags
Neighborhood map
What this means for you Summary
Snapshot
- This is a 2 × 2-bed/1-bath units multifamily listed at $180k.
Deal economics
- At list price, monthly cash flow is $588 ($7k/yr) — positive. Per door: $294/mo.
- The deal already cash-flows at list — no discount required.
- Meets the 1% rule at list price ($2k rent vs $180k).
- Recommended offer: $169k (6.0% below list) — sets the bar for market timing.
- Cap rate 10.6% vs local median 4.7% in Norwood — top-decile yield for the area; either an underpriced asset or a hidden risk that comps aren't pricing in. Stress-test before assuming the spread holds.
Location & tenants
- Location reads 79/100 on livability (#154 in OH, #2,322 nationally) — a middle-class / working-renter tenant base. Strengths: commute A+, cost of living A+, housing A+; Watch: crime C-, employment C-, amenities D+.
- Norwood City (suburban): math 35% / reading 53% proficiency, ranked #513 of 656 in OH (top 78%) — families likely to look elsewhere, expect single-tenant / working-renter base with shorter leases; 62% free/reduced lunch — lower-income household profile, screen leases tightly.
- Market conditions: Rents flat; 56 active listings in the ZIP; 35 comparable units currently listed for rent nearby; rentals at typical pace (median 15d on market — plan ~3-4 weeks tenant-placement turnaround); 801 units permitted in Hamilton County in 2024 (190 in 5+ unit buildings).
- This rent runs 41% of the median local income ($72k/yr) — at the standard rent-burdened threshold; future hikes will face affordability resistance.
Forward outlook
- Local home prices are declining (-3.0%/yr); year-one equity from $1k of loan paydown is wiped out by about $5k of value loss. Plan a longer hold.
Negotiation context
- It's been on market 63 days — a 6% lower offer ($169k) is reasonable based on typical stale-listing flexibility.
- 7 sale attempts since 16y ago with the ask held roughly flat each time — persistent listings suggest the price (not the market) is what's stuck; bring a comps-based counter.
- Current owner paid $145k; 24% above their basis — modest negotiation headroom, anchor on the comps not their cost.
Risks & watch-outs
- Watch-outs: flood insurance adds $56/mo; built in 1929 — expect roof / HVAC / electrical / plumbing capex.
- Climate carrying-cost: severe flood risk; extreme-heat days projected 7→19/yr by 2055 (HVAC capex compounding) — expect insurance premiums to compound above CPI over the hold.
Questions for the listing agent
- It's been on market 63 days. Have you received any prior offers? Is the seller open to a 6% concession, seller financing, or rate buy-down credit?
- Can we see the unit-by-unit rent roll, current vacancy, and any below-market leases? What's the average tenancy length?
- What capital expenditures (roof, boiler, parking lot, exteriors) have been made in the last 5 years, and what's planned in the next 2?
- Built in 1929 — when were the roof, HVAC, electrical panel, plumbing, and water heater last replaced?
- What's the actual annual flood-insurance premium (NFIP or private), and is the property in a SFHA with mandatory coverage?
- Why hasn't it sold? Are there any deal-killer items the seller is aware of (foundation, flood, title, zoning, code violations)?
- Is there a deadline driving the sale (1031 exchange, divorce, estate, relocation)? That informs how much negotiation room exists.
- Schools are B-rated — typically a magnet for longer-tenancy family renters. What's the average tenant stay here, and is there a school-zone premium baked into asking?
- What's the average days-on-market for RENTAL listings here right now (not sales)? A rising rental-DOM trend means longer vacancies and softer asking-rent achievability than the comps imply.
- What's the recent tenant-quality profile in this submarket — average credit score on applications, eviction rate, late-payment / NSF rate, and stable-employment percentage? A property-management company in the area should have these aggregated.
- How much new apartment / multifamily construction is in the pipeline within 1–3 miles? Heavy new supply (>2% of stock underway) typically softens rents 12–24 months out; light construction supports rent growth.
Investment metrics
- 1% rule
- 1.37% ✓
- Cap rate
- 10.58%
- Cash-on-cash
- 15.32%
- DSCR
- 1.68
- GRM
- 6.1
CMA / ARV
- ARV (median comp)
- $343,777
- List price
- $180,000
- Delta
- -47.64%
- Verdict
- UNDERPRICED
- Comps
- 20 within 1.0 mi
Show comp detail 4 sales within ~0.75 mi
| Address | Dist | Beds/Ba | Sqft | Sold | Price | $/sf | Match |
|---|---|---|---|---|---|---|---|
| 2458 Duck Creek Rd | 0.10mi | 2/2.0 (-1) | 1,680 (+3%) | 10mo | $153,000 | $91 | 78 |
| 4029 Burwood Ave | 0.29mi | 4/2.5 (+1) | 1,646 (+1%) | 23mo | $315,000 | $191 | 59 |
| 2533 Ida Ave | 0.60mi | 3/2.0 | 1,752 (+7%) | 21mo | $225,000 | $128 | 43 |
| 3652 Shaw Ave | 0.74mi | 2/2.0 (-1) | 1,520 (-7%) | 22mo | $330,000 | $217 | 31 |
Match score weights: distance 35% · size 25% · config 20% · recency 20%. Top-matched comps best support the ARV.
Projected returns pro-forma
-3.0% appreciation · 0.21% rent growth · sell at horizon
- IRR
- 0.9%
- Equity multiple
- 1.03×
- Total profit
- $1,646
- Equity at exit
- $26,839
- IRR
- 7.3%
- Equity multiple
- 1.47×
- Total profit
- $23,927
- Equity at exit
- $15,563
Cash invested: $50,400 (down + closing). Projections, not guarantees.
Landlord ↔ Tenant lean methodology
- Overall (STATE)
- 73 Landlord-Friendly
- State Ohio
- 73 Landlord-Friendly · R+6
- County
- — inherits STATE
- City
- — inherits STATE
ZIP-level market 45212
- Rents YoY
- 0.2%
- Active inventory
- 56
- Price-to-rent
- 12.1×
Monthly cashflow live
- Estimated rent
- $2,470 high interval (Pro) →
- Mortgage (P&I)
- −$944
- Tax from tax record
- −$289 /mo · $3,466/yr
- Insurance
- −$75
- Flood insurance flood zone
- −$56 /mo · $666/yr
- HOA
- −$0
- Vacancy / Maint / Mgmt
- −$519
- Net cashflow
- $588
Break-even live
2-unit breakdown (identical units grouped — click to expand)
| Units | Beds | Baths | Est. rent |
|---|---|---|---|
| 2× units | 2 | 1 | $2,470 |
| #1 | 2 | 1 | $1,235 |
| #2 | 2 | 1 | $1,235 |
| Total (2 units) | $2,470 | ||
UW: 25.0% down · 7.5% · 30yr · 1.5% tax · 5.0% vac · 8.0% maint · 8.0% mgmt
Financing live
Cash to close
- Down payment
- $45,000
- Closing costs
- $5,400
- Reserves months
- —
- Total cash needed
- —
Loan-product check · same deal, 3 products live
Conventional
25% down · 7.5% · 30yr
- Down + closing
- —
- Monthly P&I
- —
- Monthly cashflow
- —
- DSCR
- —
- Eligible?
- —
Personal DTI + credit; lowest rate.
DSCR
20% down · 8.5% · 30yr
- Down + closing
- —
- Monthly P&I
- —
- Monthly cashflow
- —
- DSCR
- —
- Eligible?
- —
No personal income docs; deal must DSCR.
Hard money
10% down · 12.0% · 12mo
- Down + closing
- —
- Monthly P&I
- —
- Monthly cashflow
- —
- DSCR
- —
- Eligible?
- —
Short-term bridge; refi at stabilization.
Rent comps 35 comps
| Address | Beds | Baths | Sqft | Rent | $/sqft | DOM | Units | Dist |
|---|---|---|---|---|---|---|---|---|
| 3901 Elsmere Ave Cincinnati, OH | 3.0 | 2.0 | 1415 | $1,995 | $1.41 | 3d | 1 | 0.38mi |
| 2584 Madison Rd Unit 1056073P Cincinnati, OH | 2.0 | 1.0 | 1431 | $4,609 | $3.22 | 1d | 1 | 0.43mi |
| 3578 Burch Ave Cincinnati, OH | 2.0 | 2.0 | 1250 | $2,595 | $2.08 | 1d | 1 | 0.45mi |
| 3921 Spencer Ave Apt 2 Norwood, OH | 4.0 | 1.0 | 1636 | $2,400 | $1.47 | 17d | 1 | 0.45mi |
| 3538 Burch Ave #2 Cincinnati, OH | 3.0 | 1.0 | 1485 | $2,250 | $1.52 | 1d | 1 | 0.53mi |
| 2733 Willard Ave Cincinnati, OH | 2.0 | 1.0 | 1242 | $3,000 | $2.42 | 19d | 1 | 0.58mi |
| 2123 Cameron Ave Cincinnati, OH | 4.0 | 2.5 | 2165 | $4,500 | $2.08 | 44d | 1 | 0.59mi |
| 3915 Lindley Ave Unit 2 Norwood, OH | 4.0 | 2.0 | 1500 | $1,950 | $1.30 | 44d | 1 | 0.59mi |
| 2607 Robertson Ave Unit 2 ROBERTSON 2607 Cincinnati, OH | 3.0 | 1.0 | 1399 | $1,895 | $1.35 | 44d | 1 | 0.72mi |
| 1931 Delaware Ave Unit 2 Norwood, OH | 3.0 | 2.0 | 1650 | $1,810 | $1.10 | 44d | 1 | 0.74mi |
| 2320 Kenilworth Ave Cincinnati, OH | 3.0 | 2.5 | 1660 | $2,300 | $1.39 | 20d | 1 | 0.75mi |
| 2365 Madison Rd Cincinnati, OH | 1.0–3.0 | 1.0–2.0 | 1100 | $1,600 | $1.45 | 23d | 1 | 0.77mi |
| 4303 Allison St Cincinnati, OH | 2.0 | 1.0 | 1070 | $1,495 | $1.40 | 4d | 1 | 0.82mi |
| 4539 Montgomery Rd Unit 3 Cincinnati, OH | 2.0 | 1.0 | 1200 | $1,375 | $1.15 | 10d | 1 | 0.86mi |
| 4539 Montgomery Rd Unit 3 Cincinnati, OH | 2.0 | 1.0 | 1200 | $1,375 | $1.15 | 23d | 1 | 0.86mi |
| 1725 Cleneay Ave Norwood, OH | 1.0–5.0 | 1.0–5.0 | 1060 | $2,147 | $2.02 | 1d | 46 | 0.90mi |
| 3774 Drake Ave Cincinnati, OH | 3.0 | 2.0 | 1784 | $3,000 | $1.68 | 17d | 1 | 0.91mi |
| 4133 Huston Ave Cincinnati, OH | 3.0 | 1.0 | 1210 | $1,725 | $1.43 | 44d | 1 | 0.99mi |
| 4133 Huston Ave Cincinnati, OH | 3.0 | 1.0 | 1210 | $1,725 | $1.43 | 12d | 1 | 0.99mi |
| 3439 Duncan Ave Cincinnati, OH | 4.0 | 1.5 | 1809 | $3,500 | $1.93 | 23d | 1 | 1.09mi |
| 2846 Observatory Ave Cincinnati, OH | 4.0 | 1.0 | 1357 | $3,000 | $2.21 | 23d | 1 | 1.11mi |
| 2881 Observatory Ave Unit 2 Cincinnati, OH | 2.0 | 3.0 | 1800 | $2,400 | $1.33 | 4d | 1 | 1.18mi |
| 3827 Paxton Ave Cincinnati, OH | 1.0–3.0 | 1.0–2.0 | 1031 | $2,995 | $2.90 | 1d | 13 | 1.21mi |
| 2101 Grandin Rd Cincinnati, OH | 1.0–2.0 | 1.0–2.0 | 1042 | $2,099 | $2.01 | 2d | 12 | 1.22mi |
| 3550 Woodburn Ave Cincinnati, OH | 3.0 | 1.0 | 1308 | $2,000 | $1.53 | 14d | 1 | 1.22mi |
| 3108 Markbreit Ave Unit 2 Cincinnati, OH | 3.0 | 1.0 | 1400 | $2,100 | $1.50 | 23d | 1 | 1.22mi |
| 1709 Sherman Ave Unit 2 Cincinnati, OH | 4.0 | 2.0 | 1500 | $2,300 | $1.53 | 2d | 1 | 1.25mi |
| 3326 Fairfield Ave Cincinnati, OH | 3.0 | 2.0 | 1566 | $1,600 | $1.02 | 10d | 1 | 1.25mi |
| 2940 Disney St Cincinnati, OH | 1.0–2.0 | 1.0–2.5 | 1072 | $2,270 | $2.12 | 1d | 1 | 1.32mi |
| 1607 Asmann Ave Cincinnati, OH | 1.0–4.0 | 1.0–1.5 | 1069 | $1,428 | $1.34 | 12d | 6 | 1.42mi |
| 5121 Silver St Cincinnati, OH | 3.0 | 2.0 | 1600 | $1,695 | $1.06 | 23d | 1 | 1.43mi |
| 5111 Warren Ave Cincinnati, OH | 2.0 | 1.0 | 1326 | $1,525 | $1.15 | 23d | 1 | 1.46mi |
| 961 Avondale Ave Cincinnati, OH | 2.0 | 1.0 | 1800 | $2,200 | $1.22 | 3d | 1 | 1.47mi |
| 5135 Globe Ave Cincinnati, OH | 3.0 | 2.0 | 1697 | $1,895 | $1.12 | 7d | 1 | 1.47mi |
| 1512 Blair Ave Apt B Cincinnati, OH | 3.0 | 1.5 | 1100 | $1,795 | $1.63 | 23d | 1 | 1.50mi |
Listing history 35 events
-
2026-06-18days on market $180,000 Active 63 DOM
-
2026-06-17days on market $180,000 Active 62 DOM
-
2026-06-16days on market $180,000 Active 61 DOM
-
2026-06-15days on market $180,000 Active 60 DOM
-
2026-06-13days on market $180,000 Active 58 DOM
-
2026-06-09days on market $180,000 Active 54 DOM
-
2026-06-08days on market $180,000 Active 53 DOM
-
2026-06-07days on market $180,000 Active 52 DOM
-
2026-06-03days on market $180,000 Active 48 DOM
-
2026-06-02days on market $180,000 Active 47 DOM
-
2026-06-01days on market $180,000 Active 46 DOM
-
2026-05-31days on market $180,000 Active 45 DOM
-
2026-04-15$180,000 Active 437-char remark
Show marketing remark (437 chars)
Attention investors! Opportunity awaits with this 2-family property in Norwood. Being sold as-is, a little TLC will go a long way. This property offers tremendous potential for strong rental income, or a quick rehab. Both units are 2 bedrooms, 1 bath. Features include garage, separate utilities, separate entrances, and a desirable corner lot. Great chance to build equity and/or maximize returns in a convenient location. Easy to show!
-
2019-07-03soldstatus $145,000
-
2018-07-30historical
-
2018-06-25$209,000 Active
-
2018-05-01historical
-
2018-04-30$220,000 Active
-
2017-05-16soldstatus $64,900
-
2017-05-09soldstatus $60,123 Sold
-
2017-03-22historical Accept Backup Offers
-
2017-03-20status Active
-
2017-03-16historical Accept Backup Offers
-
2017-03-10status Active
-
2017-01-18historical Accept Backup Offers
-
2017-01-06$62,100 Active
-
2011-02-16historical
-
2010-12-17$22,000
-
2006-07-31soldstatus $106,000
-
2003-08-14soldstatus $64,000
-
1998-10-14soldstatus $61,000
-
1997-01-06soldstatus $38,500
-
1995-03-13soldstatus $53,850
-
1990-09-20soldstatus $48,500
-
1986-05-02soldstatus $35,000
ⓘ Source: listings_history table (triggers on properties + properties_extension) + one-shot
backfill from property_details.listing_events for pre-trigger history.
Tax reassessment forecast OH · Partial reset (capped growth)
- Current annual tax
- $3,466 · $289/mo
- Projected year-2 tax
- $3,466 · $289/mo
- Expected delta
- $0/yr ($0/mo · 0.0%)
ⓘ Screening estimate from a state-policy table — verify with the county assessor before closing.
Climate risk First Street
- Flood 9/10 Extreme FEMA zone X (unshaded) · 99% chance over 30 yrs
- Wildfire 1/10 Low
- Heat 5/10 Major 7 d/yr ≥103°F today · 19 d/yr by 30 yrs out
- Wind 2/10 Low 100% chance of damaging wind over 30 yrs
- Air quality 3/10 Moderate 2 unhealthy d/yr today · 3 by 30 yrs out
Nearby sold comps map
Loading sold comps map…
Walkable amenities ~0.75 mi
Loading nearby amenities…
Taxation est. · year 1
- Rental income
- $29,640
- − Mortgage interest
- −$10,083
- − Property taxes
- −$3,466
- − Insurance
- −$1,566
- − Repairs & maintenance
- −$2,371
- − Management
- −$2,371
- − Depreciation
- −$5,236
- Taxable income
- $4,546
- Est. tax owed @ 24.0%
- −$1,091
- After-tax cash flow
- $5,965/yr
For passive investors: Depreciation is non-cash, so a rental often shows a tax loss while cash-flowing — sheltering income. Rental losses are passive: they offset passive income freely, and up to $25,000/yr can offset ordinary (W-2) income if you actively participate and your MAGI is under $100k (phasing out to $0 by $150k); unused losses carry forward. On sale, claimed depreciation is recaptured at up to 25%, and gains may owe capital-gains tax (a 1031 exchange can defer both). Figures are a year-1 estimate at your 24.0% rate — not tax advice; consult a CPA.
Schools (NCES district)
- District
- Norwood City
- NCES district ID
- 3904457
- Math proficiency
- 35% ▼ -24.00%
- Reading proficiency
- 53% ▼ -11.00%
- Median HH income
- $38,750
- Composite
- 36.66/100
- National rank
- #4614
- State rank
- #513 of 656 in OH
Livability — Norwood
- Score
- 79/100
- State rank
- #154
- US rank
- #2322
Category grades
Schools grade is shown separately in the Schools card above.
Census & demographics
- Census place
- Norwood, OH
- County
- Hamilton County · 701,295 people
- City population
- 21,526
- Metro
- Cincinnati, OH-KY-IN
- Population (ZIP)
- 21,526
- Household income
- $72,422
- Rent vs Own
- Severe rent burden
- 1192.0
Population outlook (Hamilton County) Hauer SSP2
- Today (2025)
- 826,054 people
- By 2030
- 830,947 · +0.6%
- By 2040
- 832,319 · +0.8%
- By 2050
- 822,428 · -0.4%
- By 2075
- 788,688 · -4.5%
- By 2100
- 710,674 · -14.0%
Race, ethnicity, and origin ACS 2023
- Neighborhood character
- Predominantly White (73%)
- Race & ethnicity
- White 73% Black 15% Hispanic / Latino 8% Two or more races 5% Asian 1%
- Hispanic origin (detail)
- Mexican 3%
- Common ancestry
- Romanian 2% Lithuanian 1% Slovak 1%
- Foreign-born
- 5% · Canada, China
- Languages at home
- 92% English-only · Spanish 6% Arabic 1% Russian/Polish/Slavic 1%
Political lean MEDSL · Hamilton
- 2024 margin
- D (+14.9) · D 57.0% · R 42.1%
- 2008→2024 swing
- +7.9pp toward D · 2008: 7.0pp · 2024: 14.9pp
- All cycles
- 2024: D+14.9 2020: D+15.9 2016: D+9.5 2012: D+4.9 2008: D+7.0
Not yet ingested
- Civics
- —
Market trends
- HPI YoY
- ▼ -209.95%
- Current HPI
- 295.7088
- Rent YoY
- ▲ 0.21%
- Metro
- Cincinnati, OH-KY-IN
- State GDP YoY
- ▲ 1.98%
- F500 in state
- 48
Industry mix (Fortune 500 HQ in OH)
| Industry | F500 HQs | Revenue |
|---|---|---|
| Insurance | 3 | $145B |
|
||
| Industrial Machinery | 3 | $49B |
|
||
| Financial Services | 3 | $24B |
|
||
| Consumer Goods | 2 | $93B |
|
||
| Aerospace / Defense | 2 | $47B |
|
||
| Utilities | 2 | $33B |
|
||
Price history
+414.3% since first listed23 events — show timeline
- 2026-04-15 Listed $180,000 Cincy MLS
- 2019-07-03 Sold (Public Records) $145,000 Public Records
- 2018-07-30 Listing Removed — Cincy MLS
- 2018-06-25 Listed $209,000 Cincy MLS
- 2018-05-01 Listing Removed — Cincy MLS
- 2018-04-30 Listed $220,000 Cincy MLS
- 2017-05-16 Sold (Public Records) $64,900 Public Records
- 2017-05-09 Sold (MLS) $60,123 Cincy MLS
- 2017-03-22 Contingent — Cincy MLS
- 2017-03-20 Relisted — Cincy MLS
- 2017-03-16 Contingent — Cincy MLS
- 2017-03-10 Relisted — Cincy MLS
- 2017-01-18 Contingent — Cincy MLS
- 2017-01-06 Listed $62,100 Cincy MLS
- 2011-02-16 Listing Removed — Cincy MLS
- 2010-12-17 Listed $22,000 Cincy MLS
- 2006-07-31 Sold (Public Records) $106,000 Public Records
- 2003-08-14 Sold (Public Records) $64,000 Public Records
- 1998-10-14 Sold (Public Records) $61,000 Public Records
- 1997-01-06 Sold (Public Records) $38,500 Public Records
- 1995-03-13 Sold (Public Records) $53,850 Public Records
- 1990-09-20 Sold (Public Records) $48,500 Public Records
- 1986-05-02 Sold (Public Records) $35,000 Public Records
Property tax history
+3.1%/yrLatest (2025): $3,466 · -0.0% YoY. Source: county tax records.
Cash-flow waterfall
monthlySold comps — $/sqft
last 12 mo · ≤1 miLoading sold comps…