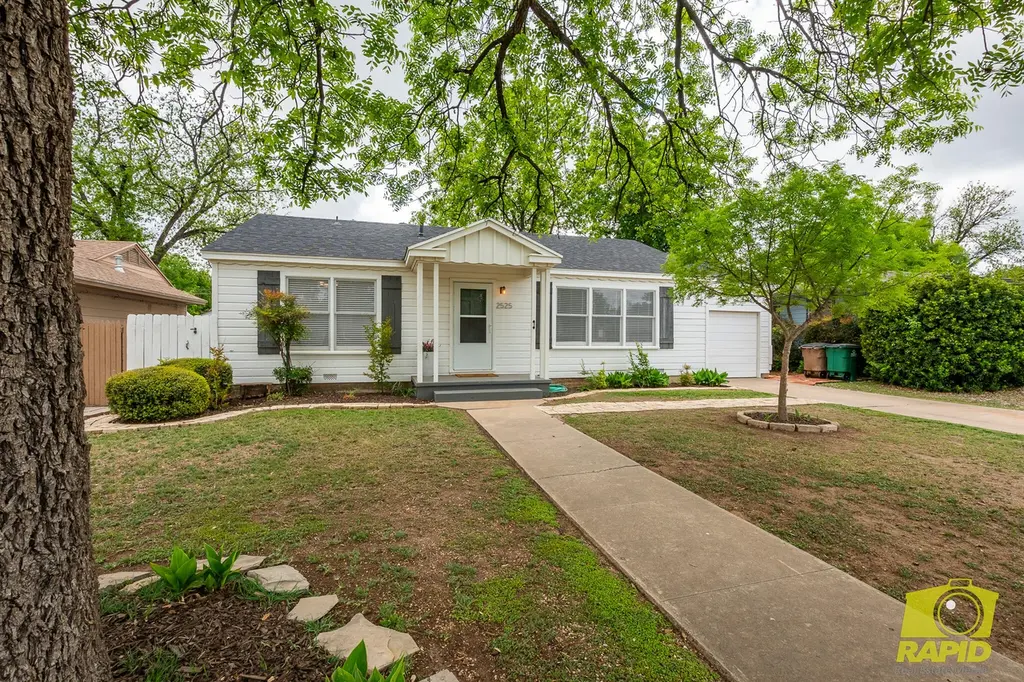
2525 Colorado Ave · San Angelo, TX
Flood risk 1/10 · Minimal
- FEMA flood zone
- X (unshaded)
- Chance of flooding over 30 yrs
- 0.0%
- Est. flood insurance / yr
- $507 – $1,088
Fire risk 3/10 · Minor
- Est. fire insurance / yr
- $1,222 – $2,270
Heat risk 7/10 · Major
- Hot days now (above 104°F)
- 7 days/yr
- Hot days in 30 yrs
- 23 days/yr
Wind risk 4/10 · Minor
- Chance of severe wind over 30 yrs
- 14.0%
Air-quality risk 2/10 · Minimal
- Unhealthy air days now
- 0 days/yr
- Unhealthy air days in 30 yrs
- 1 days/yr
Risk factors via First Street. Map © Google.
Why this score? — see what drove the D+ grade
The composite is a weighted blend of 9 inputs, each scored 0–100. Each bar is that input's sub-score; the figure is the points it added to the 100-point composite (weight × sub-score).
- ARV discount +12.0/15.0
- Appreciation +10.0/10.0
- Cash flow +7.8/30.0
- Rent growth +3.9/5.0
- Livability +3.7/5.0
- 1% rule +3.3/10.0
- Schools +2.6/10.0
- Condition / age +2.5/5.0
- DSCR +1.9/10.0
$170,000
🖨 Deal sheet (PDF) 📄 Offer letter ✓ Due diligence
Listing remarks MLS
WOW! GREAT REMODELING IN THIS TWO BEDROOM HOME WITH LOTS OF UPDATES. CARPET AND VINYL HAS BEEN REPLACED, NEW INTERIOR PAINT, NEW FAUCETS, DISHWASHER, WATER HEATER (2-08), SCREENS AND STORM DOORS. WASHER & DRYER CONNECTIONS AND SINK ARE LOCATED IN THE GARAGE AREA. THIS HOME IS LOCATED ON A LARGE LOT WITH FOUR PECAN TREES. EXTERIOR PAINT IS APPROX TWO YEARS OLD.
Key facts
- 9,016 sq ft lot
- Garage
- Built 1960
Neighborhood map
What this means for you Summary
Snapshot
- This is a 2-bed/1.0-bath single-family listed at $170k.
Deal economics
- At list price, monthly cash flow is $-190 ($-2k/yr) — negative.
- To cash-flow at today's rent, offer at most $136k (19.7% below list).
- To meet the 1% rule (rent ≥ 1% of price), the offer needs to be $141k (17.2% below list).
- Recommended offer: $136k (19.7% below list) — sets the bar for cash-flow.
- Cap rate 5.0% vs local median 3.8% in San Angelo — meaningfully above typical; check what's discounted (condition, days-on-market, listing class) to confirm the premium yield is real.
Location & tenants
- Location reads 73/100 on livability (#199 in TX) — a middle-class / working-renter tenant base. Strengths: cost of living A+, housing A+, health & safety A+; Watch: employment C-, amenities F, commute F.
- San Angelo ISD (urban): math 27% / reading 33% proficiency, ranked #627 of 826 in TX (top 76%) — families likely to look elsewhere, expect single-tenant / working-renter base with shorter leases.
- Zoned schools: Santa Rita El (math 67% / reading 57%, grade B, #321 of 4,322 statewide, top 8%, 371 students, 40% FRL); Lone Star Middle (math 28% / reading 32%, grade F, #1,056 of 1,662 statewide, top 65%, 903 students, 63% FRL); Central H S (math 22% / reading 43%, grade F, #1,029 of 1,632 statewide, top 64%, 3,065 students, 48% FRL) — zoned schools at 50% FRL track the district average.
- Market conditions: Rents rising fast (+5.8%/yr); 334 active listings in the ZIP; 27 comparable units currently listed for rent nearby; rentals lingering (median 46d on market — plan ~5-8 weeks vacancy on turnover, expect pricing pressure); 59% of comp listings sitting > 30 days — soft ceiling on asking rent; 233 units permitted in Tom Green County in 2024 (0 in 5+ unit buildings).
Forward outlook
- In year one you build about $18k of equity ($1k loan paydown + $17k appreciation (10.0% local appreciation)).
- Tom Green County population projected at +35% by 2050 — long-run rental-demand tailwind backs the buy-and-hold thesis.
- By year 3, paydown + projected appreciation supports a ~$46k cash-out refi (75% LTV) — recoverable capital for the next deal without selling this one.
Negotiation context
- Only 8 days on market — expect competitive offers; lowballing is unlikely to land.
- 2 sale attempts since 18y ago with the ask held roughly flat each time — persistent listings suggest the price (not the market) is what's stuck; bring a comps-based counter.
Risks & watch-outs
- Climate carrying-cost: extreme-heat days projected 7→23/yr by 2055 (HVAC capex compounding) — expect insurance premiums to compound above CPI over the hold.
Questions for the listing agent
- What do current leases actually rent for vs. the listed asking? Can we see a recent rent roll and the last 12 months of T-12 income?
- Built in 1960 — when were the roof, HVAC, electrical panel, plumbing, and water heater last replaced?
- Is there a deadline driving the sale (1031 exchange, divorce, estate, relocation)? That informs how much negotiation room exists.
- Schools are F-rated, which usually means shorter tenancies and higher turnover. Who's the typical renter profile here, and what's been the actual vacancy rate?
- The area grade is low — what's the realistic commute time and amenity access for the typical tenant pool here? Any planned neighborhood developments (good or bad) we should know about?
- What's the average days-on-market for RENTAL listings here right now (not sales)? A rising rental-DOM trend means longer vacancies and softer asking-rent achievability than the comps imply.
- What's the recent tenant-quality profile in this submarket — average credit score on applications, eviction rate, late-payment / NSF rate, and stable-employment percentage? A property-management company in the area should have these aggregated.
- How much new for-sale + rental construction is in the pipeline within 1–3 miles? Heavy new supply typically softens prices + rents 12–24 months out; constrained supply supports both.
Investment metrics
- 1% rule
- 0.83% ✗
- Cap rate
- 4.95%
- Cash-on-cash
- -4.78%
- DSCR
- 0.79
- GRM
- 10.1
CMA / ARV
- ARV (on-the-fly)
- $189,028
- Comps found
- 12
Show comp detail 12 sales within ~0.75 mi
| Address | Dist | Beds/Ba | Sqft | Sold | Price | $/sf | Match |
|---|---|---|---|---|---|---|---|
| 2525 Colorado Ave | 0.00mi | 2/1.0 | 1,204 (0%) | 1mo | $170,000 | $141 | 99 |
| 2319 Colorado St | 0.15mi | 3/2.0 (+1) | 1,109 (-8%) | 4mo | $205,000 | $185 | 68 |
| 1520 S Harrison St | 0.58mi | 3/2.0 (+1) | 1,224 (+2%) | 3mo | $130,000 | $106 | 58 |
| 121 S Tyler St | 0.49mi | 3/1.0 (+1) | 1,303 (+8%) | 1mo | $189,900 | $146 | 58 |
| 1951 W Twohig Ave | 0.49mi | 2/2.0 | 1,292 (+7%) | 4mo | $190,000 | $147 | 58 |
| 2623 W Harris Ave | 0.19mi | 3/2.0 (+1) | 1,030 (-14%) | 0mo | $185,400 | $180 | 58 |
| 2403 Freeland Ave | 0.55mi | 2/2.0 | 1,120 (-7%) | 2mo | $179,900 | $161 | 57 |
| 2409 W Ave L | 0.40mi | 2/1.5 | 1,367 (+14%) | 2mo | $215,000 | $157 | 55 |
| 2702 Houston St | 0.74mi | 3/2.0 (+1) | 1,176 (-2%) | 2mo | $199,900 | $170 | 51 |
| 425 N Garfield St | 0.62mi | 3/2.0 (+1) | 1,120 (-7%) | 4mo | $179,000 | $160 | 48 |
| 3101 Guadalupe St | 0.68mi | 2/1.0 | 1,080 (-10%) | 5mo | $153,975 | $143 | 47 |
| 1901 Dena Dr | 0.50mi | 3/2.0 (+1) | 1,380 (+15%) | 6mo | $215,000 | $156 | 39 |
Match score weights: distance 35% · size 25% · config 20% · recency 20%. Top-matched comps best support the ARV.
Projected returns pro-forma
10.0% appreciation · 5.78% rent growth · sell at horizon
- IRR
- 21.8%
- Equity multiple
- 2.78×
- Total profit
- $84,642
- Equity at exit
- $153,149
- IRR
- 20.4%
- Equity multiple
- 6.63×
- Total profit
- $268,141
- Equity at exit
- $330,273
Cash invested: $47,600 (down + closing). Projections, not guarantees.
Landlord ↔ Tenant lean methodology
- Overall (STATE)
- 87 Strongly Landlord-Friendly
- State Texas
- 87 Strongly Landlord-Friendly · R+5
- County
- — inherits STATE
- City
- — inherits STATE
ZIP-level market 76901
- Home prices YoY
- 6.4%
- Rents YoY
- 5.8%
- Active inventory
- 334
- Price-to-rent
- 10.1×
Monthly cashflow live
- Estimated rent
- $1,407 high interval (Pro) →
- Mortgage (P&I)
- −$891
- Tax from tax record
- −$339 /mo · $4,065/yr
- Insurance
- −$71
- HOA
- −$0
- Vacancy / Maint / Mgmt
- −$295
- Net cashflow
- $-190
Break-even live
Sensitivity live
| Price | -10% $-94 | -5% $-142 | +0% $-190 | +5% $-238 | +10% $-286 |
|---|---|---|---|---|---|
| Rent | -10% $-301 | -5% $-245 | +0% $-190 | +5% $-134 | +10% $-79 |
| Rate | -1.0pp $-104 | -0.5pp $-147 | base $-190 | +0.5pp $-234 | +1.0pp $-279 |
UW: 25.0% down · 7.5% · 30yr · 1.5% tax · 5.0% vac · 8.0% maint · 8.0% mgmt
Financing live
Cash to close
- Down payment
- $42,500
- Closing costs
- $5,100
- Reserves months
- —
- Total cash needed
- —
Loan-product check · same deal, 3 products live
Conventional
25% down · 7.5% · 30yr
- Down + closing
- —
- Monthly P&I
- —
- Monthly cashflow
- —
- DSCR
- —
- Eligible?
- —
Personal DTI + credit; lowest rate.
DSCR
20% down · 8.5% · 30yr
- Down + closing
- —
- Monthly P&I
- —
- Monthly cashflow
- —
- DSCR
- —
- Eligible?
- —
No personal income docs; deal must DSCR.
Hard money
10% down · 12.0% · 12mo
- Down + closing
- —
- Monthly P&I
- —
- Monthly cashflow
- —
- DSCR
- —
- Eligible?
- —
Short-term bridge; refi at stabilization.
Rent comps 27 comps
| Address | Beds | Baths | Sqft | Rent | $/sqft | DOM | Units | Dist |
|---|---|---|---|---|---|---|---|---|
| 2430 Rio Grande St San Angelo, TX | 3.0 | 1.0 | 1200 | $1,395 | $1.16 | 45d | 1 | 0.28mi |
| 212 S Fillmore St Unit B San Angelo, TX | 2.0 | 1.0 | 800 | $999 | $1.25 | 45d | 1 | 0.29mi |
| 2065 Live Oak St San Angelo, TX | 2.0 | 1.0 | 720 | $950 | $1.32 | 45d | 1 | 0.39mi |
| 1818 S Lincoln St San Angelo, TX | 2.0 | 1.0–2.0 | 555 | $1,199 | $2.16 | 22d | 19 | 0.54mi |
| 2013 Rosemont Dr San Angelo, TX | 3.0 | 2.0 | 1400 | $2,100 | $1.50 | 22d | 1 | 0.58mi |
| 705 Childress St San Angelo, TX | 2.0 | 1.0 | 872 | $1,400 | $1.61 | 45d | 1 | 0.69mi |
| 1725 West Avenue M Unit M San Angelo, TX | 2.0 | 1.0 | 1202 | $1,350 | $1.12 | 22d | 1 | 0.71mi |
| 121 N Van Buren St Unit A San Angelo, TX | 2.0 | 1.0 | 715 | $1,095 | $1.53 | 22d | 1 | 0.72mi |
| 2756 Sac Ave San Angelo, TX | 3.0 | 1.0 | 1461 | $1,650 | $1.13 | 45d | 1 | 0.74mi |
| 2630 Waco St San Angelo, TX | 3.0 | 2.0 | 1024 | $1,600 | $1.56 | 22d | 1 | 0.78mi |
| 1835 Willow St San Angelo, TX | 3.0 | 1.0 | 1267 | $1,750 | $1.38 | 45d | 1 | 0.84mi |
| 2804 Abilene St San Angelo, TX | 3.0 | 2.0 | 1304 | $1,550 | $1.19 | 45d | 1 | 0.88mi |
| 711 N Monroe St San Angelo, TX | 3.0 | 1.0 | 1345 | $1,500 | $1.12 | 45d | 1 | 1.04mi |
| 2629 Forest Park Ave San Angelo, TX | 3.0 | 2.0 | 1336 | $1,895 | $1.42 | 45d | 1 | 1.05mi |
| 3755 Arden Rd San Angelo, TX | 2.0–3.0 | 1.0 | 875 | $925 | $1.06 | 22d | 1 | 1.07mi |
| 2102 Webster St San Angelo, TX | 3.0 | 1.0 | 1233 | $1,750 | $1.42 | 45d | 1 | 1.07mi |
| 2431 College Hills Blvd San Angelo, TX | 1.0–3.0 | 1.0–2.0 | 1025 | $1,254 | $1.22 | 22d | 17 | 1.10mi |
| 1210 Guthrie St San Angelo, TX | 3.0 | 2.0 | 1157 | $1,400 | $1.21 | 22d | 1 | 1.11mi |
| 1405 Hassell St San Angelo, TX | 3.0 | 2.0 | 1064 | $1,950 | $1.83 | 45d | 1 | 1.14mi |
| 3801 Arden Rd Apt 65 San Angelo, TX | 2.0 | 2.0 | 1025 | $1,199 | $1.17 | 22d | 1 | 1.30mi |
| 3801 Arden Rd Apt 108 San Angelo, TX | 2.0 | 2.0 | 1025 | $1,215 | $1.19 | 45d | 1 | 1.30mi |
| 2548 A and M Ave San Angelo, TX | 3.0 | 1.5 | 1092 | $1,500 | $1.37 | 22d | 1 | 1.37mi |
| 3426 Millbrook Dr San Angelo, TX | 1.0–2.0 | 1.0–2.0 | 845 | $1,459 | $1.73 | 45d | 13 | 1.39mi |
| 902 Shiloh St Unit RE-908-16 San Angelo, TX | 2.0 | 1.0 | 875 | $1,125 | $1.29 | 45d | 1 | 1.40mi |
| 902 Shiloh St Unit RE-908-20 San Angelo, TX | 1.0 | 1.0 | 800 | $1,025 | $1.28 | 45d | 1 | 1.40mi |
| 902 Shiloh St Unit RE-908-C San Angelo, TX | 2.0 | 1.5 | 925 | $1,175 | $1.27 | 45d | 1 | 1.40mi |
| 1929 Raney St San Angelo, TX | 1.0–2.0 | 1.0–2.0 | 765 | $1,000 | $1.31 | 22d | 4 | 1.49mi |
Listing history 5 events
-
2026-04-21status Pending
-
2026-04-13$170,000 Active
-
2008-06-27soldstatus 368-char remark
Show marketing remark (368 chars)
WOW! GREAT REMODELING IN THIS TWO BEDROOM HOME WITH LOTS OF UPDATES. CARPET AND VINYL HAS BEEN REPLACED, NEW INTERIOR PAINT, NEW FAUCETS, DISHWASHER, WATER HEATER (2-08), SCREENS AND STORM DOORS. WASHER & DRYER CONNECTIONS AND SINK ARE LOCATED IN THE GARAGE AREA. THIS HOME IS LOCATED ON A LARGE LOT WITH FOUR PECAN TREES. EXTERIOR PAINT IS APPROX TWO YEARS OLD.
-
2008-06-27soldstatus
Show marketing remark (368 chars)
WOW! GREAT REMODELING IN THIS TWO BEDROOM HOME WITH LOTS OF UPDATES. CARPET AND VINYL HAS BEEN REPLACED, NEW INTERIOR PAINT, NEW FAUCETS, DISHWASHER, WATER HEATER (2-08), SCREENS AND STORM DOORS. WASHER & DRYER CONNECTIONS AND SINK ARE LOCATED IN THE GARAGE AREA. THIS HOME IS LOCATED ON A LARGE LOT WITH FOUR PECAN TREES. EXTERIOR PAINT IS APPROX TWO YEARS OLD.
-
2008-06-03$82,500 368-char remark
Show marketing remark (368 chars)
WOW! GREAT REMODELING IN THIS TWO BEDROOM HOME WITH LOTS OF UPDATES. CARPET AND VINYL HAS BEEN REPLACED, NEW INTERIOR PAINT, NEW FAUCETS, DISHWASHER, WATER HEATER (2-08), SCREENS AND STORM DOORS. WASHER & DRYER CONNECTIONS AND SINK ARE LOCATED IN THE GARAGE AREA. THIS HOME IS LOCATED ON A LARGE LOT WITH FOUR PECAN TREES. EXTERIOR PAINT IS APPROX TWO YEARS OLD.
ⓘ Source: listings_history table (triggers on properties + properties_extension) + one-shot
backfill from property_details.listing_events for pre-trigger history.
Tax reassessment forecast TX · Resets to sale price
- Current annual tax
- $4,065 · $339/mo
- Projected year-2 tax
- $4,065 · $339/mo
- Expected delta
- $0/yr ($0/mo · 0.0%)
ⓘ Screening estimate from a state-policy table — verify with the county assessor before closing.
Climate risk First Street
- Flood 1/10 Low FEMA zone X (unshaded) · 0% chance over 30 yrs
- Wildfire 3/10 Moderate
- Heat 7/10 Severe 7 d/yr ≥104°F today · 23 d/yr by 30 yrs out
- Wind 4/10 Moderate 14% chance of damaging wind over 30 yrs
- Air quality 2/10 Low 0 unhealthy d/yr today · 1 by 30 yrs out
Nearby sold comps map
Loading sold comps map…
Walkable amenities ~0.75 mi
Loading nearby amenities…
Taxation est. · year 1
- Rental income
- $16,881
- − Mortgage interest
- −$9,523
- − Property taxes
- −$4,065
- − Insurance
- −$850
- − Repairs & maintenance
- −$1,350
- − Management
- −$1,350
- − Depreciation
- −$4,945
- Taxable loss
- −$5,203
- Est. tax savings @ 24.0%
- +$1,249
- After-tax cash flow
- $-1,029/yr
For passive investors: Depreciation is non-cash, so a rental often shows a tax loss while cash-flowing — sheltering income. Rental losses are passive: they offset passive income freely, and up to $25,000/yr can offset ordinary (W-2) income if you actively participate and your MAGI is under $100k (phasing out to $0 by $150k); unused losses carry forward. On sale, claimed depreciation is recaptured at up to 25%, and gains may owe capital-gains tax (a 1031 exchange can defer both). Figures are a year-1 estimate at your 24.0% rate — not tax advice; consult a CPA.
Schools (NCES district)
- District
- San Angelo ISD
- NCES district ID
- 4838700
- Math proficiency
- 27% ▼ -9.00%
- Reading proficiency
- 33% ▼ -3.00%
- Median HH income
- $43,501
- Composite
- 25.56/100
- National rank
- #7427
- State rank
- #627 of 826 in TX
Livability — San Angelo
- Score
- 73/100
- State rank
- #199
- US rank
- #5030
Category grades
Schools grade is shown separately in the Schools card above.
Census & demographics
- Census place
- San Angelo, TX
- County
- Tom Green County · 113,188 people
- City population
- 81,357
- Metro
- San Angelo, TX
- Population (ZIP)
- 31,831
- Household income
- $69,450
- Rent vs Own
- Severe rent burden
- 1034.0
Population outlook (Tom Green County) Hauer SSP2
- Today (2025)
- 135,110 people
- By 2030
- 144,090 · +6.6%
- By 2040
- 162,561 · +20.3%
- By 2050
- 182,158 · +34.8%
- By 2075
- 232,274 · +71.9%
- By 2100
- 268,218 · +98.5%
Race, ethnicity, and origin ACS 2023
- Neighborhood character
- Majority White (55%)
- Race & ethnicity
- White 55% Hispanic / Latino 41% Two or more races 17% Black 2%
- Hispanic origin (detail)
- Mexican 38%
- Common ancestry
- Lithuanian 3% Slovak 3% Iranian 1%
- Foreign-born
- 5% · Canada
- Languages at home
- 77% English-only · Spanish 21% German/W. Germanic 1%
Political lean MEDSL · Tom Green
- 2024 margin
- Solid R (+48.0) · D 25.5% · R 73.5% · Other 1.0%
- 2008→2024 swing
- -6.3pp toward R · 2008: -41.7pp · 2024: -48.0pp
- All cycles
- 2024: R+48.0 2020: R+44.4 2016: R+47.9 2012: R+47.9 2008: R+41.7
Not yet ingested
- Civics
- —
Market trends
- HPI YoY
- ▲ 47.96%
- Current HPI
- 798.58
- Rent YoY
- ▲ 5.78%
- Metro
- San Angelo, TX
- State GDP YoY
- ▲ 3.95%
- F500 in state
- 110
Industry mix (Fortune 500 HQ in TX)
| Industry | F500 HQs | Revenue |
|---|---|---|
| Energy | 16 | $1,198B |
|
||
| Technology | 5 | $198B |
|
||
| Engineering / Construction | 4 | $72B |
|
||
| Energy Services | 3 | $60B |
|
||
| Utilities | 3 | $41B |
|
||
| Healthcare | 2 | $330B |
|
||
Price history
+106.1% since first listed5 events — show timeline
- 2026-04-21 Pending — SAAR TX
- 2026-04-13 Listed $170,000 SAAR TX
- 2008-06-27 Sold (Public Records) — Public Records
- 2008-06-27 Sold (MLS) — SAAR TX
- 2008-06-03 Listed $82,500 SAAR TX
Property tax history
+5.2%/yrLatest (2025): $4,065 · +17.2% YoY. Source: county tax records.
Cash-flow waterfall
monthlySold comps — $/sqft
last 12 mo · ≤1 miLoading sold comps…