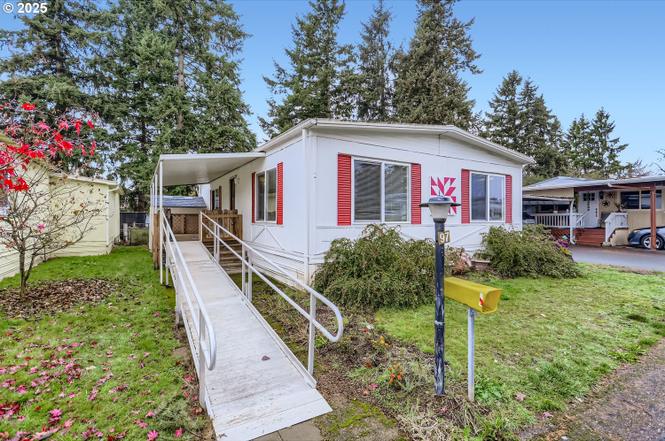
13531 Clairmont Way #97 · Oregon City, OR
Flood risk 1/10 · Minimal
- FEMA flood zone
- X (unshaded)
- Chance of flooding over 30 yrs
- 0.0%
- Est. flood insurance / yr
- $507 – $1,088
Fire risk 4/10 · Minor
- Est. fire insurance / yr
- $498 – $926
Heat risk 3/10 · Minor
- Hot days now (above 92°F)
- 7 days/yr
- Hot days in 30 yrs
- 15 days/yr
Wind risk 1/10 · Minimal
- Chance of severe wind over 30 yrs
- —
Air-quality risk 9/10 · Severe
- Unhealthy air days now
- 13 days/yr
- Unhealthy air days in 30 yrs
- 16 days/yr
Risk factors via First Street. Map © Google.
Why this score? — see what drove the B- grade
The composite is a weighted blend of 9 inputs, each scored 0–100. Each bar is that input's sub-score; the figure is the points it added to the 100-point composite (weight × sub-score).
- Cash flow +30.0/30.0
- 1% rule +10.0/10.0
- DSCR +10.0/10.0
- ARV discount +7.5/15.0
- Livability +4.4/5.0
- Rent growth +2.8/5.0
- Schools +2.7/10.0
- Condition / age +2.5/5.0
- Appreciation +0.0/10.0
$80,000
🖨 Deal sheet 📄 Offer letter ✓ Due diligence
Listing remarks
Discover comfort and convenience in this move-in-ready 2-bedroom mobile home featuring a fully fenced yard, ideal for pets or outdoor enjoyment. The property includes a covered carport and storage shed for added functionality. Enjoy enhanced privacy with the home backing up to a peaceful green space. Inside, you'll find spacious closets and thoughtful accessibility features, including a ramp to enter and grab bars in the bathroom for added safety. This home offers a rare blend of practicality and tranquility—perfect for those seeking an easy-living lifestyle in a private setting.
Key facts
- Covered carport
- Storage shed
- Peaceful green space
Tags
Neighborhood map
What this means for you Summary
Snapshot
- This is a 2-bed/1.0-bath other listed at $80k.
Deal economics
- At list price, monthly cash flow is $884 ($11k/yr) — positive.
- The deal already cash-flows at list — no discount required.
- Meets the 1% rule at list price ($2k rent vs $80k).
- Recommended offer: $70k (12.0% below list) — sets the bar for market timing.
- Cap rate 19.6% vs local median 2.6% in Oregon City — top-decile yield for the area; either an underpriced asset or a hidden risk that comps aren't pricing in. Stress-test before assuming the spread holds.
Location & tenants
- Location reads 87/100 on livability (#12 in OR, #271 nationally) — a professional / high-income tenant draw. Strengths: amenities A+, commute A+, employment A+; Watch: cost of living F.
- Oregon City SD 62 (suburban): math 18% / reading 40% proficiency, ranked #40 of 58 in OR (top 69%) — low school quality limits family demand, transient renter base, plan for 1-2y turnover.
- Zoned schools: Gaffney Lane Elementary School (math 15% / reading 50%, grade F, #242 of 412 statewide, top 59%, 445 students, 35% FRL); Gardiner Middle School (math 20% / reading 39%, grade F, #86 of 128 statewide, top 72%, 671 students, 30% FRL); Oregon City Senior High School (math 17% / reading 52%, grade F, #94 of 143 statewide, top 70%, 1,931 students, 25% FRL) — zoned schools at 30% FRL track the district average.
- Market conditions: Rents rising (+1.1%/yr); 408 active listings in the ZIP; 22 comparable units currently listed for rent nearby; rentals at typical pace (median 24d on market — plan ~3-4 weeks tenant-placement turnaround); solid renter incomes; 946 units permitted in Clackamas County in 2024 (188 in 5+ unit buildings).
Forward outlook
- Local home prices are declining (-3.0%/yr); year-one equity from $553 of loan paydown is wiped out by about $2k of value loss. Plan a longer hold.
- Clackamas County population projected at +25% by 2050 — long-run rental-demand tailwind backs the buy-and-hold thesis.
- At projected returns (-3.0% appreciation + 1.1% rent growth), your $22k cash investment doubles in ~3 years — after that, you're playing with house money.
Negotiation context
- It's been on market 151 days — a 12% lower offer ($70k) is reasonable based on typical stale-listing flexibility.
- 2 sale attempts; this cycle's ask has dropped $5k (6%) from the opening price — seller is motivated, your offer sets the floor, not the list.
Questions for the listing agent
- It's been on market 151 days. Have you received any prior offers? Is the seller open to a 12% concession, seller financing, or rate buy-down credit?
- Built in 1973 — when were the roof, HVAC, electrical panel, plumbing, and water heater last replaced?
- Why hasn't it sold? Are there any deal-killer items the seller is aware of (foundation, flood, title, zoning, code violations)?
- Is there a deadline driving the sale (1031 exchange, divorce, estate, relocation)? That informs how much negotiation room exists.
- What's the average days-on-market for RENTAL listings here right now (not sales)? A rising rental-DOM trend means longer vacancies and softer asking-rent achievability than the comps imply.
- What's the recent tenant-quality profile in this submarket — average credit score on applications, eviction rate, late-payment / NSF rate, and stable-employment percentage? A property-management company in the area should have these aggregated.
- How much new for-sale + rental construction is in the pipeline within 1–3 miles? Heavy new supply typically softens prices + rents 12–24 months out; constrained supply supports both.
Investment metrics
- 1% rule
- 2.14% ✓
- Cap rate
- 19.55%
- Cash-on-cash
- 47.36%
- DSCR
- 3.11
- GRM
- 3.9
CMA / ARV
No comps found within radius.
Projected returns pro-forma
-3.0% appreciation · 1.12% rent growth · sell at horizon
- IRR
- 42.7%
- Equity multiple
- 2.79×
- Total profit
- $40,136
- Equity at exit
- $11,928
- IRR
- 48.0%
- Equity multiple
- 5.23×
- Total profit
- $94,786
- Equity at exit
- $6,917
Cash invested: $22,400 (down + closing). Projections, not guarantees.
Landlord ↔ Tenant lean methodology
- Overall (STATE)
- 28 Tenant-Leaning
- State Oregon
- 28 Tenant-Leaning · D+6
- County
- — inherits STATE
- City
- — inherits STATE
ZIP-level market 97045
- Rents YoY
- 1.1%
- Active inventory
- 408
- Price-to-rent
- 3.9×
Monthly cashflow live
- Estimated rent
- $1,711 high interval (Pro) →
- Mortgage (P&I)
- −$420
- Tax from tax record
- −$15 /mo · $181/yr
- Insurance
- −$33
- HOA
- −$0
- Vacancy / Maint / Mgmt
- −$359
- Net cashflow
- $884
Break-even live
UW: 25.0% down · 7.5% · 30yr · 1.5% tax · 5.0% vac · 8.0% maint · 8.0% mgmt
Financing live
Cash to close
- Down payment
- $20,000
- Closing costs
- $2,400
- Reserves months
- —
- Total cash needed
- —
Loan-product check · same deal, 3 products live
Conventional
25% down · 7.5% · 30yr
- Down + closing
- —
- Monthly P&I
- —
- Monthly cashflow
- —
- DSCR
- —
- Eligible?
- —
Personal DTI + credit; lowest rate.
DSCR
20% down · 8.5% · 30yr
- Down + closing
- —
- Monthly P&I
- —
- Monthly cashflow
- —
- DSCR
- —
- Eligible?
- —
No personal income docs; deal must DSCR.
Hard money
10% down · 12.0% · 12mo
- Down + closing
- —
- Monthly P&I
- —
- Monthly cashflow
- —
- DSCR
- —
- Eligible?
- —
Short-term bridge; refi at stabilization.
Rent comps 22 comps
| Address | Beds | Baths | Sqft | Rent | $/sqft | DOM | Units | Dist |
|---|---|---|---|---|---|---|---|---|
| 469 Hilltop Ave Oregon City, OR | 1.0 | 1.0 | 600 | $1,245 | $2.08 | 43d | 2 | 0.48mi |
| 158 Warner Milne Rd Apt 1024 Oregon City, OR | 2.0 | 1.5 | 1046 | $1,770 | $1.69 | 24d | 1 | 0.66mi |
| 1026 Prospect St Oregon City, OR | 2.0 | 2.0 | 1074 | $2,450 | $2.28 | 11d | 1 | 0.69mi |
| 14155 S Beavercreek Rd Unit 243 Oregon City, OR | 2.0 | 2.0 | 916 | $1,575 | $1.72 | 24d | 1 | 0.76mi |
| 14155 S Beavercreek Rd Unit 222 Oregon City, OR | 2.0 | 2.0 | 916 | $1,700 | $1.86 | 24d | 1 | 0.77mi |
| 14155 S Beavercreek Rd Unit 204 Oregon City, OR | 1.0 | 1.0 | 612 | $1,275 | $2.08 | 24d | 1 | 0.77mi |
| 14155 Beavercreek Rd Oregon City, OR | 1.0–3.0 | 1.0–2.0 | 878 | $1,638 | $1.86 | 1d | 4 | 0.78mi |
| 18713 S Central Point Rd Oregon City, OR | 1.0–2.0 | 1.0 | 815 | $1,695 | $2.08 | 3d | 3 | 0.83mi |
| 418 Hilda St Oregon City, OR | 2.0 | 1.5 | 1000 | $1,645 | $1.65 | 3d | 2 | 0.88mi |
| 581 Holmes Ln Unit 15 Oregon City, OR | 1.0 | 1.0 | 768 | $1,295 | $1.69 | 24d | 1 | 0.95mi |
| 581 Holmes Ln Unit 22 Oregon City, OR | 2.0 | 1.5 | 1120 | $1,545 | $1.38 | 24d | 1 | 0.96mi |
| 14378 Walnut Grove Way Oregon City, OR | 1.0 | 1.0 | 684 | $1,869 | $2.73 | 24d | 1 | 1.00mi |
| 14378 Walnut Grove Way Oregon City, OR | 1.0–3.0 | 1.0–2.0 | 1015 | $2,152 | $2.12 | 1d | 24 | 1.00mi |
| 19839 Highway 213 Oregon City, OR | 1.0–3.0 | 1.0–2.0 | 862 | $1,674 | $1.94 | 1d | 13 | 1.02mi |
| 14338 S Maple Lane Ct Oregon City, OR | 2.0–4.0 | 1.0–2.0 | 993 | $1,499 | $1.51 | 1d | 14 | 1.03mi |
| 788 Pleasant Ave Oregon City, OR | 2.0 | 1.0 | 850 | $1,625 | $1.91 | 1d | 1 | 1.06mi |
| 701 Molalla Ave Oregon City, OR | 2.0 | 2.0 | 700 | $1,695 | $2.42 | 43d | 1 | 1.10mi |
| 691 Molalla Ave Unit 18 Oregon City, OR | 2.0 | 1.0 | 900 | $1,149 | $1.28 | 43d | 1 | 1.11mi |
| 691 Molalla Ave Unit 15 Oregon City, OR | 2.0 | 1.0 | 875 | $1,139 | $1.30 | 7d | 1 | 1.12mi |
| 630 Pleasant Ave Oregon City, OR | 2.0 | 1.0–1.5 | 724 | $1,749 | $2.42 | 3d | 4 | 1.13mi |
| 775 Cascade St Oregon City, OR | 2.0 | 2.0 | 1007 | $1,670 | $1.66 | 2d | 13 | 1.16mi |
| 134 East St Oregon City, OR | 2.0 | 1.0 | 820 | $1,540 | $1.88 | 43d | 1 | 1.35mi |
Listing history 3 events
-
2026-04-23status Pending
-
2026-01-23status Active
-
2025-11-21$85,000 Active
ⓘ Source: listings_history table (triggers on properties + properties_extension) + one-shot
backfill from property_details.listing_events for pre-trigger history.
Tax reassessment forecast OR · Resets to sale price
- Current annual tax
- $181 · $15/mo
- Projected year-2 tax
- $776 · $65/mo
- Expected delta
- +$595/yr (+$50/mo · 329.8%)
ⓘ Screening estimate from a state-policy table — verify with the county assessor before closing.
Climate risk First Street
- Flood 1/10 Low FEMA zone X (unshaded) · 0% chance over 30 yrs
- Wildfire 4/10 Moderate
- Heat 3/10 Moderate 7 d/yr ≥92°F today · 15 d/yr by 30 yrs out
- Wind 1/10 Low
- Air quality 9/10 Extreme 13 unhealthy d/yr today · 16 by 30 yrs out
Nearby sold comps map
Loading sold comps map…
Walkable amenities ~0.75 mi
Loading nearby amenities…
Taxation est. · year 1
- Rental income
- $20,535
- − Mortgage interest
- −$4,481
- − Property taxes
- −$181
- − Insurance
- −$400
- − Repairs & maintenance
- −$1,643
- − Management
- −$1,643
- − Depreciation
- −$2,327
- Taxable income
- $9,861
- Est. tax owed @ 24.0%
- −$2,367
- After-tax cash flow
- $8,242/yr
For passive investors: Depreciation is non-cash, so a rental often shows a tax loss while cash-flowing — sheltering income. Rental losses are passive: they offset passive income freely, and up to $25,000/yr can offset ordinary (W-2) income if you actively participate and your MAGI is under $100k (phasing out to $0 by $150k); unused losses carry forward. On sale, claimed depreciation is recaptured at up to 25%, and gains may owe capital-gains tax (a 1031 exchange can defer both). Figures are a year-1 estimate at your 24.0% rate — not tax advice; consult a CPA.
Schools (NCES district)
- District
- Oregon City SD 62
- NCES district ID
- 4109330
- Math proficiency
- 18% ▼ -21.00%
- Reading proficiency
- 40% ▼ -18.00%
- Median HH income
- $64,272
- Composite
- 26.65/100
- National rank
- #7169
- State rank
- #40 of 58 in OR
Livability — Oregon City
- Score
- 87/100
- State rank
- #12
- US rank
- #271
Category grades
Schools grade is shown separately in the Schools card above.
Census & demographics
- Census place
- Oregon City, OR
- County
- Clackamas County · 361,406 people
- City population
- 57,526
- Metro
- Portland-Vancouver-Hillsboro, OR-WA
- Population (ZIP)
- 57,526
- Household income
- $103,573
- Rent vs Own
- Severe rent burden
- 1045.0
Population outlook (Clackamas County) Hauer SSP2
- Today (2025)
- 458,456 people
- By 2030
- 485,185 · +5.8%
- By 2040
- 532,932 · +16.2%
- By 2050
- 574,445 · +25.3%
- By 2075
- 665,497 · +45.2%
- By 2100
- 697,488 · +52.1%
Race, ethnicity, and origin ACS 2023
- Neighborhood character
- Predominantly White (85%)
- Race & ethnicity
- White 85% Two or more races 8% Hispanic / Latino 6% Asian 1% Black 1%
- Hispanic origin (detail)
- Mexican 5%
- Common ancestry
- Portuguese 4% Italian 3% Slovak 3%
- Foreign-born
- 5% · Canada
- Languages at home
- 91% English-only · Spanish 4% Russian/Polish/Slavic 2% Other Indo-European 1%
Political lean MEDSL · Clackamas
- 2024 margin
- Lean D (+9.7) · D 53.4% · R 43.6% · Other 3.0%
- 2008→2024 swing
- -0.6pp no change · 2008: 10.4pp · 2024: 9.7pp
- All cycles
- 2024: D+9.7 2020: D+11.1 2016: D+6.1 2012: D+3.5 2008: D+10.4
Not yet ingested
- Civics
- —
Market trends
- HPI YoY
- ▼ -624.55%
- Current HPI
- 301.9661
- Rent YoY
- ▲ 1.12%
- Metro
- Portland-Vancouver-Hillsboro, OR-WA
- State GDP YoY
- ▲ 2.05%
- F500 in state
- 2
Industry mix (Fortune 500 HQ in OR)
| Industry | F500 HQs | Revenue |
|---|---|---|
| Consumer Goods | 1 | $51B |
|
||
Price history
3 events — show timeline
- 2026-04-23 Pending — RMLS
- 2026-01-23 Relisted — RMLS
- 2025-11-21 Listed $85,000 RMLS
Property tax history
+1.2%/yrLatest (2018): $181 · +0.1% YoY. Source: county tax records.
Cash-flow waterfall
monthlySold comps — $/sqft
last 12 mo · ≤1 miLoading sold comps…