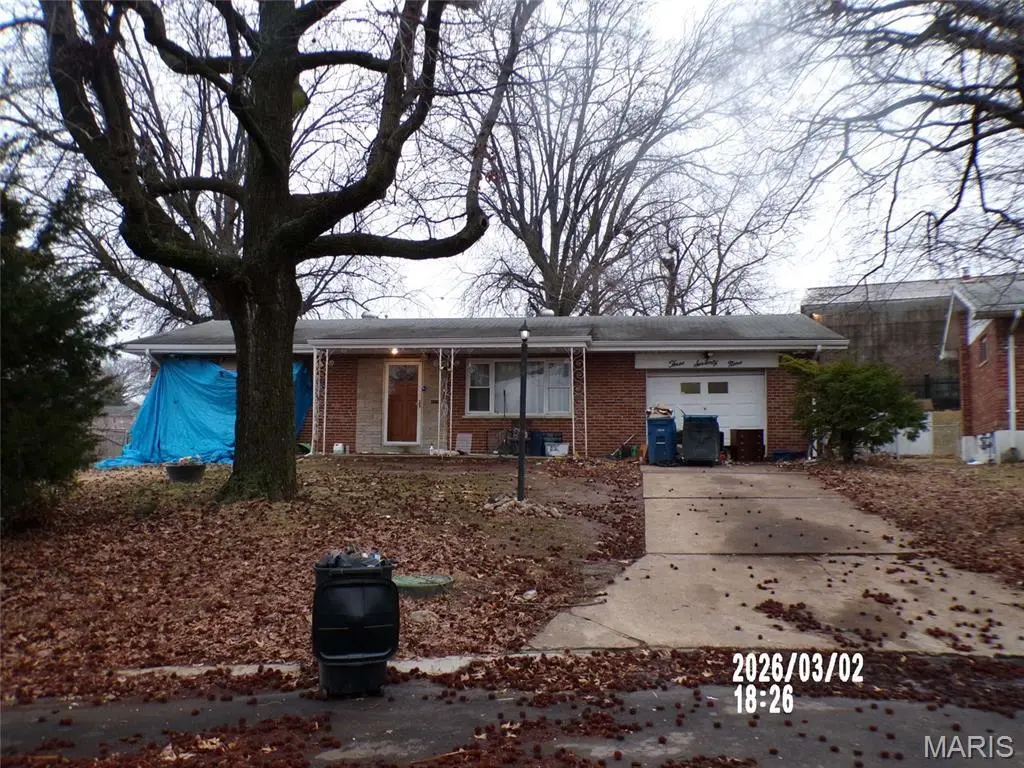
379 Porchester Dr · Lemay, MO
Flood risk 1/10 · Minimal
- FEMA flood zone
- X (unshaded)
- Chance of flooding over 30 yrs
- 0.0%
- Est. flood insurance / yr
- $473 – $860
Fire risk 1/10 · Minimal
- Est. fire insurance / yr
- $1,054 – $1,958
Heat risk 5/10 · Moderate
- Hot days now (above 108°F)
- 7 days/yr
- Hot days in 30 yrs
- 21 days/yr
Wind risk 2/10 · Minimal
- Chance of severe wind over 30 yrs
- 1.0%
Air-quality risk 3/10 · Minor
- Unhealthy air days now
- 2 days/yr
- Unhealthy air days in 30 yrs
- 3 days/yr
Risk factors via First Street. Map © Google.
Why this score? — see what drove the C+ grade
The composite is a weighted blend of 9 inputs, each scored 0–100. Each bar is that input's sub-score; the figure is the points it added to the 100-point composite (weight × sub-score).
- Cash flow +26.7/30.0
- DSCR +9.2/10.0
- 1% rule +7.8/10.0
- ARV discount +7.5/15.0
- Schools +3.5/10.0
- Livability +3.4/5.0
- Rent growth +2.5/5.0
- Condition / age +2.5/5.0
- Appreciation +0.0/10.0
$89,900
🖨 Deal sheet 📄 Offer letter ✓ Due diligence
Listing remarks
CORPORATE OWNED PROPERTY BEING OFFERED IN "AS IS" CONDITION. SELLER TO MAKE NO REPAIRS NOR PROVIDE ANY INSPECTION. SELLER HAS NEVER OCCUPIED THIS PROPERTY AND HAS NO KNOWLEDGE OF THE CONDITION. EARNEST MONEY TO $1000.00 WITH PROOF OF FUNDS OR PRE-APPROVAL TO BE SUBMITTED WITH ALL OFFERS.
Key facts
- Garage
- Built 1952
- Listed 12 days
Property features AI
Finance
- Financial info: Lease not considered
Exterior
- Parking: Attached 1-car garage
- Utilities: Public water; Public sewer; Electric service by Ameren; Cable available; Electricity connected; Natural gas available; Sewer connected; Water connected
- Home design: Single-family residence; One level
- Construction: Brick and vinyl siding exterior
- Exterior features: Partial backyard fencing; Near public transit
Interior
- Bedrooms: Three bedrooms total; Two bedrooms on the main level; One bedroom on the lower level
- Bathrooms: Two full bathrooms; One full bathroom on the main level; One full bathroom on the lower level
- Heating & cooling: Forced air heating (natural gas); Central air conditioning
- Interior features: Partially finished basement; Five total rooms
Neighborhood map
What this means for you Summary
Snapshot
- This is a 2-bed/1.0-bath single-family listed at $90k.
Deal economics
- At list price, monthly cash flow is $244 ($3k/yr) — positive.
- The deal already cash-flows at list — no discount required.
- Meets the 1% rule at list price ($1k rent vs $90k).
- Cap rate 9.5% vs local median 5.3% in Lemay — top-decile yield for the area; either an underpriced asset or a hidden risk that comps aren't pricing in. Stress-test before assuming the spread holds.
Location & tenants
- Location reads 67/100 on livability (#213 in MO) — a middle-class / working-renter tenant base. Strengths: cost of living A+, housing A+; Watch: employment C-, health & safety C-, crime F.
- Mehlville R-IX (suburban): math 31% / reading 48% proficiency, ranked #126 of 324 in MO (top 39%) — families likely to look elsewhere, expect single-tenant / working-renter base with shorter leases.
- Zoned schools: Forder Elem. (math 22% / reading 27%, grade F, #879 of 1,115 statewide, top 81%, 363 students, 52% FRL); Mehlville High School (math 26% / reading 54%, grade F, #243 of 521 statewide, top 47%, 1,440 students, 43% FRL) — zoned schools average 47% FRL vs 22% district-wide (25 pts higher); higher-poverty schools than district average — tighter screening recommended.
- Market conditions: 146 active listings in the ZIP; 10 comparable units currently listed for rent nearby; rentals at typical pace (median 18d on market — plan ~3-4 weeks tenant-placement turnaround); 920 units permitted in St. Louis County in 2024 (250 in 5+ unit buildings).
Forward outlook
- Local home prices are declining (-3.0%/yr); year-one equity from $622 of loan paydown is wiped out by about $3k of value loss. Plan a longer hold.
- At projected returns (-3.0% appreciation + 3.0% rent growth), your $25k cash investment doubles in ~10 years — after that, you're playing with house money.
Negotiation context
- Only 12 days on market — expect competitive offers; lowballing is unlikely to land.
- Current owner paid $78k; 15% above their basis — modest negotiation headroom, anchor on the comps not their cost.
Risks & watch-outs
- Watch-outs: built in 1952 — expect roof / HVAC / electrical / plumbing capex.
- Climate carrying-cost: extreme-heat days projected 7→21/yr by 2055 (HVAC capex compounding) — expect insurance premiums to compound above CPI over the hold.
Questions for the listing agent
- Built in 1952 — when were the roof, HVAC, electrical panel, plumbing, and water heater last replaced?
- Is there a deadline driving the sale (1031 exchange, divorce, estate, relocation)? That informs how much negotiation room exists.
- Schools are D-rated, which usually means shorter tenancies and higher turnover. Who's the typical renter profile here, and what's been the actual vacancy rate?
- Crime grade is F in this area — have there been break-ins, vandalism, or insurance claims at this property in the last 3 years? What carrier currently insures it and at what premium?
- What's the average days-on-market for RENTAL listings here right now (not sales)? A rising rental-DOM trend means longer vacancies and softer asking-rent achievability than the comps imply.
- What's the recent tenant-quality profile in this submarket — average credit score on applications, eviction rate, late-payment / NSF rate, and stable-employment percentage? A property-management company in the area should have these aggregated.
- How much new for-sale + rental construction is in the pipeline within 1–3 miles? Heavy new supply typically softens prices + rents 12–24 months out; constrained supply supports both.
Investment metrics
- 1% rule
- 1.28% ✓
- Cap rate
- 9.55%
- Cash-on-cash
- 11.63%
- DSCR
- 1.52
- GRM
- 6.5
CMA / ARV
- ARV (on-the-fly)
- $203,193
- Comps found
- 12
Show comp detail 12 sales within ~0.75 mi
| Address | Dist | Beds/Ba | Sqft | Sold | Price | $/sf | Match |
|---|---|---|---|---|---|---|---|
| 520 Ruthland Dr | 0.18mi | 2/1.0 | 972 (+1%) | 2mo | $200,000 | $206 | 89 |
| 2411 Telegraph Rd | 0.13mi | 1/1.5 (-1) | 960 (-0%) | 2mo | $179,900 | $187 | 85 |
| 307 Pentonville Dr | 0.23mi | 2/1.0 | 1,015 (+5%) | 0mo | $214,900 | $212 | 80 |
| 215 Walworth Dr | 0.30mi | 2/1.0 | 1,008 (+5%) | 0mo | $195,000 | $193 | 78 |
| 223 Southampton Dr | 0.16mi | 3/1.5 (+1) | 988 (+3%) | 4mo | $199,900 | $202 | 78 |
| 515 Kingston Dr | 0.21mi | 3/2.0 (+1) | 896 (-7%) | 1mo | $189,900 | $212 | 69 |
| 411 Lambeth Ln | 0.31mi | 2/1.5 | 890 (-8%) | 6mo | $199,900 | $225 | 66 |
| 1080 Rainbow Dr | 0.67mi | 2/1.0 | 945 (-2%) | 3mo | $199,000 | $211 | 63 |
| 2745 Granda Dr | 0.63mi | 2/1.0 | 918 (-5%) | 5mo | $212,000 | $231 | 58 |
| 312 Carthage Ave | 0.58mi | 1/1.0 (-1) | 910 (-6%) | 5mo | $164,900 | $181 | 54 |
| 2700 Corliss Dr | 0.51mi | 2/2.0 | 864 (-10%) | 2mo | $220,000 | $255 | 53 |
| 323 Carthage Ave | 0.59mi | 1/1.5 (-1) | 825 (-14%) | 1mo | $109,900 | $133 | 41 |
Match score weights: distance 35% · size 25% · config 20% · recency 20%. Top-matched comps best support the ARV.
Projected returns pro-forma
-3.0% appreciation · 3.0% rent growth · sell at horizon
- IRR
- 1.1%
- Equity multiple
- 1.04×
- Total profit
- $1,018
- Equity at exit
- $13,404
- IRR
- 10.7%
- Equity multiple
- 1.84×
- Total profit
- $21,085
- Equity at exit
- $7,773
Cash invested: $25,172 (down + closing). Projections, not guarantees.
Landlord ↔ Tenant lean methodology
- Overall (STATE)
- 81 Strongly Landlord-Friendly
- State Missouri
- 81 Strongly Landlord-Friendly · R+10
- County
- — inherits STATE
- City
- — inherits STATE
ZIP-level market 63125
- Active inventory
- 146
- Price-to-rent
- 6.5×
Monthly cashflow live
- Estimated rent
- $1,155 high interval (Pro) →
- Mortgage (P&I)
- −$471
- Tax from tax record
- −$159 /mo · $1,912/yr
- Insurance
- −$37
- HOA
- −$0
- Vacancy / Maint / Mgmt
- −$242
- Net cashflow
- $244
Break-even live
UW: 25.0% down · 7.5% · 30yr · 1.5% tax · 5.0% vac · 8.0% maint · 8.0% mgmt
Financing live
Cash to close
- Down payment
- $22,475
- Closing costs
- $2,697
- Reserves months
- —
- Total cash needed
- —
Loan-product check · same deal, 3 products live
Conventional
25% down · 7.5% · 30yr
- Down + closing
- —
- Monthly P&I
- —
- Monthly cashflow
- —
- DSCR
- —
- Eligible?
- —
Personal DTI + credit; lowest rate.
DSCR
20% down · 8.5% · 30yr
- Down + closing
- —
- Monthly P&I
- —
- Monthly cashflow
- —
- DSCR
- —
- Eligible?
- —
No personal income docs; deal must DSCR.
Hard money
10% down · 12.0% · 12mo
- Down + closing
- —
- Monthly P&I
- —
- Monthly cashflow
- —
- DSCR
- —
- Eligible?
- —
Short-term bridge; refi at stabilization.
Rent comps 10 comps
| Address | Beds | Baths | Sqft | Rent | $/sqft | DOM | Units | Dist |
|---|---|---|---|---|---|---|---|---|
| 274 Kingston Dr St. Louis, MO | 2.0 | 1.0 | 522 | $1,149 | $2.20 | 1d | 4 | 0.27mi |
| 315 Sigsbee Ave Saint Louis, MO | 2.0 | 1.0 | 700 | $850 | $1.21 | 21d | 1 | 0.29mi |
| 9964 Meadow Ave Saint Louis, MO | 1.0 | 1.0 | 950 | $775 | $0.82 | 7d | 1 | 0.45mi |
| 9954 Meadow Ave Saint Louis, MO | 2.0 | 1.0 | 1100 | $1,050 | $0.95 | 4d | 1 | 0.49mi |
| 152 W Etta Ave Saint Louis, MO | 2.0 | 1.0 | 936 | $1,274 | $1.36 | 7d | 1 | 1.02mi |
| 127 E Holden Ave Saint Louis, MO | 2.0 | 1.0 | 1044 | $1,200 | $1.15 | 43d | 1 | 1.04mi |
| 3605 Traceyrich Rd St. Louis, MO | 2.0 | 2.0 | 972 | $1,650 | $1.70 | 43d | 1 | 1.23mi |
| 2819 Lemay Ferry Rd Unit B St. Louis, MO | 1.0 | 1.0 | 650 | $950 | $1.46 | 17d | 1 | 1.28mi |
| 2819 Lemay Ferry Rd Apt E St. Louis, MO | 1.0 | 1.0 | 700 | $925 | $1.32 | 17d | 1 | 1.28mi |
| 3633 Shores Dr Saint Louis, MO | 3.0 | 2.0 | 884 | $1,920 | $2.17 | 14d | 1 | 1.33mi |
Listing history 7 events
-
2026-06-02status $89,900 Pending 12 DOM
-
2026-06-01days on market $89,900 Active 12 DOM
-
2026-05-31days on market $89,900 Active 11 DOM
-
2026-05-20$89,900 Active
-
2009-12-10soldstatus
-
1999-11-30soldstatus $78,000
-
1960-11-07soldstatus
ⓘ Source: listings_history table (triggers on properties + properties_extension) + one-shot
backfill from property_details.listing_events for pre-trigger history.
Tax reassessment forecast MO · Resets to sale price
- Current annual tax
- $1,912 · $159/mo
- Projected year-2 tax
- $1,912 · $159/mo
- Expected delta
- $0/yr ($0/mo · -0.0%)
ⓘ Screening estimate from a state-policy table — verify with the county assessor before closing.
Climate risk First Street
- Flood 1/10 Low FEMA zone X (unshaded) · 0% chance over 30 yrs
- Wildfire 1/10 Low
- Heat 5/10 Major 7 d/yr ≥108°F today · 21 d/yr by 30 yrs out
- Wind 2/10 Low 100% chance of damaging wind over 30 yrs
- Air quality 3/10 Moderate 2 unhealthy d/yr today · 3 by 30 yrs out
Nearby sold comps map
Loading sold comps map…
Walkable amenities ~0.75 mi
Loading nearby amenities…
Taxation est. · year 1
- Rental income
- $13,856
- − Mortgage interest
- −$5,036
- − Property taxes
- −$1,912
- − Insurance
- −$450
- − Repairs & maintenance
- −$1,108
- − Management
- −$1,108
- − Depreciation
- −$2,615
- Taxable income
- $1,627
- Est. tax owed @ 24.0%
- −$390
- After-tax cash flow
- $2,537/yr
For passive investors: Depreciation is non-cash, so a rental often shows a tax loss while cash-flowing — sheltering income. Rental losses are passive: they offset passive income freely, and up to $25,000/yr can offset ordinary (W-2) income if you actively participate and your MAGI is under $100k (phasing out to $0 by $150k); unused losses carry forward. On sale, claimed depreciation is recaptured at up to 25%, and gains may owe capital-gains tax (a 1031 exchange can defer both). Figures are a year-1 estimate at your 24.0% rate — not tax advice; consult a CPA.
Schools (NCES district)
- District
- Mehlville R-IX
- NCES district ID
- 2920670
- Math proficiency
- 31% ▼ -14.00%
- Reading proficiency
- 48% ▼ -5.00%
- Median HH income
- $62,254
- Composite
- 35.19/100
- National rank
- #4995
- State rank
- #126 of 324 in MO
Livability — Lemay
- Score
- 67/100
- State rank
- #213
- US rank
- #10652
Category grades
Schools grade is shown separately in the Schools card above.
Census & demographics
- Census place
- Lemay, MO
- County
- Saint Louis County · 888,823 people
- City population
- 33,294
- Metro
- St. Louis, MO-IL
- Population (ZIP)
- 33,294
- Household income
- $61,624
- Rent vs Own
- Severe rent burden
- 631.0
Population outlook (St. Louis County) Hauer SSP2
- Today (2025)
- 1,025,227 people
- By 2030
- 1,028,023 · +0.3%
- By 2040
- 1,020,940 · -0.4%
- By 2050
- 1,007,280 · -1.8%
- By 2075
- 987,277 · -3.7%
- By 2100
- 921,984 · -10.1%
Race, ethnicity, and origin ACS 2023
- Neighborhood character
- Predominantly White (86%)
- Race & ethnicity
- White 86% Two or more races 5% Black 4% Hispanic / Latino 4% Asian 2%
- Common ancestry
- American 9% Romanian 3% Lithuanian 3%
- Foreign-born
- 14% · Canada, Vietnam
- Languages at home
- 83% English-only · Russian/Polish/Slavic 11% Spanish 3% Vietnamese 1%
Political lean MEDSL · St. Louis
- 2024 margin
- Strong D (+23.4) · D 60.8% · R 37.4% · Other 1.7%
- 2008→2024 swing
- +3.5pp toward D · 2008: 19.9pp · 2024: 23.4pp
- All cycles
- 2024: D+23.4 2020: D+24.0 2016: D+16.2 2012: D+13.7 2008: D+19.9
Not yet ingested
- Civics
- —
Market trends
- HPI YoY
- ▼ -173.27%
- Current HPI
- 234.3792
- Rent YoY
- —
- Metro
- St. Louis, MO-IL
- State GDP YoY
- ▲ 1.84%
- F500 in state
- 20
Industry mix (Fortune 500 HQ in MO)
| Industry | F500 HQs | Revenue |
|---|---|---|
| Healthcare | 1 | $163B |
|
||
| Insurance | 1 | $21B |
|
||
| Industrial Technology | 1 | $17B |
|
||
| Retail | 1 | $16B |
|
||
| Industrial Distribution | 1 | $10B |
|
||
| Utilities | 1 | $9B |
|
||
Price history
+15.3% since first listed4 events — show timeline
- 2026-05-20 Listed $89,900 MARIS as Distributed by MLS Grid
- 2009-12-10 Sold (Public Records) — Public Records
- 1999-11-30 Sold (Public Records) $78,000 Public Records
- 1960-11-07 Sold (Public Records) — Public Records
Property tax history
+4.1%/yrLatest (2022): $1,912 · +0.2% YoY. Source: county tax records.
Cash-flow waterfall
monthlySold comps — $/sqft
last 12 mo · ≤1 miLoading sold comps…