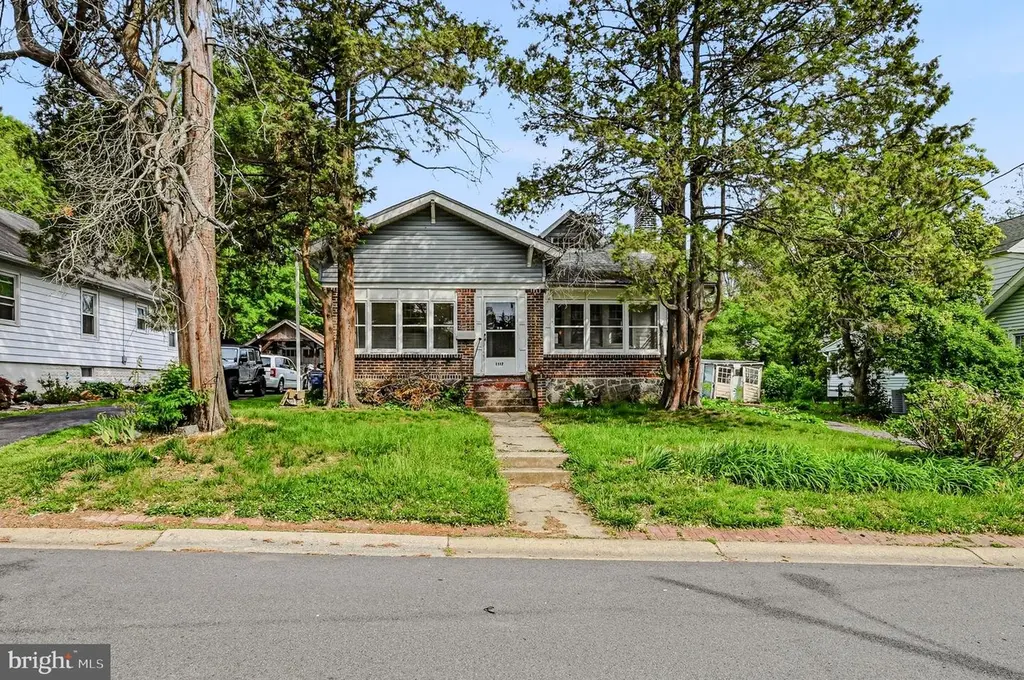
1117 Talley Rd · Bellefonte, DE
Flood risk 1/10 · Minimal
- FEMA flood zone
- X (unshaded)
- Chance of flooding over 30 yrs
- 0.0%
- Est. flood insurance / yr
- $473 – $860
Fire risk 1/10 · Minimal
- Est. fire insurance / yr
- $476 – $884
Heat risk 7/10 · Major
- Hot days now (above 104°F)
- 7 days/yr
- Hot days in 30 yrs
- 15 days/yr
Wind risk 6/10 · Moderate
- Chance of severe wind over 30 yrs
- 27.0%
Air-quality risk 3/10 · Minor
- Unhealthy air days now
- 2 days/yr
- Unhealthy air days in 30 yrs
- 3 days/yr
Risk factors via First Street. Map © Google.
Why this score? — see what drove the C grade
The composite is a weighted blend of 9 inputs, each scored 0–100. Each bar is that input's sub-score; the figure is the points it added to the 100-point composite (weight × sub-score).
- Cash flow +19.7/30.0
- ARV discount +15.0/15.0
- DSCR +6.2/10.0
- 1% rule +4.2/10.0
- Rent growth +4.0/5.0
- Livability +3.8/5.0
- Schools +3.1/10.0
- Condition / age +2.5/5.0
- Appreciation +0.0/10.0
$249,000
🖨 Deal sheet 📄 Offer letter ✓ Due diligence
Listing remarks
Welcome to 1117 Talley Rd — a charming and well-lived home in North Wilmington’s Bellefonte community. This capecod home features a functional layout with bright living areas, high ceilings with exposed beams, and plenty of space for a family. In need of some TLC but great bones. Enjoy the ease of a private driveway and a yard perfect for outdoor living. Located just minutes from shopping, dining, and major roadways, this home makes everyday living convenient while still offering a quiet, established neighborhood feel. —schedule your tour today!
Key facts
- Private driveway
- Quiet neighborhood
- Outdoor living
Tags
Property features AI
Exterior
- Parking: Driveway parking for three vehicles; Three total garage/parking spaces
- Utilities: Public water; Public sewer; Electric service
- Home design: Detached property; Ownership: Fee simple
- Construction: Mixed construction materials; Permanent foundation; Above-grade and below-grade structures
- Exterior features: Lot dimensions approximately 80 x 105
Interior
- Bedrooms: Two bedrooms on the main level; Two bedrooms on the upper level
- Bathrooms: Two full bathrooms (one on main level, one on upper level)
- Heating & cooling: Forced air heating (natural gas); Central air conditioning (electric); Natural gas hot water
- Interior features: Full, unfinished basement; Living area per assessor
Neighborhood map
What this means for you Summary
Snapshot
- This is a 4-bed/2.5-bath single-family listed at $249k.
Deal economics
- At list price, monthly cash flow is $290 ($3k/yr) — positive.
- The deal already cash-flows at list — no discount required.
- To meet the 1% rule (rent ≥ 1% of price), the offer needs to be $230k (7.7% below list).
- Recommended offer: $230k (7.7% below list) — sets the bar for 1% rule.
Location & tenants
- Location reads 75/100 on livability (#6 in DE, #4,252 nationally) — a middle-class / working-renter tenant base. Strengths: crime A+, housing A+, employment A; Watch: amenities F, commute F, health & safety D-.
- Brandywine School District (suburban): math 28% / reading 40% proficiency, ranked #11 of 26 in DE (top 42%) — families likely to look elsewhere, expect single-tenant / working-renter base with shorter leases.
- Market conditions: Rents rising fast (+6.2%/yr); 48 active listings in the ZIP; 1 comparable units currently listed for rent nearby; solid renter incomes; 1,367 units permitted in New Castle County in 2024 (201 in 5+ unit buildings).
- This rent runs 34% of the median local income ($81k/yr) — at the standard rent-burdened threshold; future hikes will face affordability resistance.
Forward outlook
- Local home prices are declining (-3.0%/yr); year-one equity from $2k of loan paydown is wiped out by about $7k of value loss. Plan a longer hold.
- New Castle County population projected at +9% by 2050 — modest demand growth; plan on rents tracking national, not racing it.
Negotiation context
- Only 8 days on market — expect competitive offers; lowballing is unlikely to land.
- Current owner paid $101k; list at $249k implies a 146% gain — meaningful room to come down on a strong offer.
Risks & watch-outs
- Watch-outs: built in 1930 — expect roof / HVAC / electrical / plumbing capex.
- Climate carrying-cost: major wind risk, 27% chance of damaging wind over 30y; extreme-heat days projected 7→15/yr by 2055 (HVAC capex compounding) — expect insurance premiums to compound above CPI over the hold.
Questions for the listing agent
- Built in 1930 — when were the roof, HVAC, electrical panel, plumbing, and water heater last replaced?
- Is there a deadline driving the sale (1031 exchange, divorce, estate, relocation)? That informs how much negotiation room exists.
- What's the average days-on-market for RENTAL listings here right now (not sales)? A rising rental-DOM trend means longer vacancies and softer asking-rent achievability than the comps imply.
- What's the recent tenant-quality profile in this submarket — average credit score on applications, eviction rate, late-payment / NSF rate, and stable-employment percentage? A property-management company in the area should have these aggregated.
- How much new for-sale + rental construction is in the pipeline within 1–3 miles? Heavy new supply typically softens prices + rents 12–24 months out; constrained supply supports both.
Investment metrics
- 1% rule
- 0.92% ✗
- Cap rate
- 7.69%
- Cash-on-cash
- 5.00%
- DSCR
- 1.22
- GRM
- 9.0
CMA / ARV
- ARV (on-the-fly)
- $448,525
- Comps found
- 12
Show comp detail 12 sales within ~0.75 mi
| Address | Dist | Beds/Ba | Sqft | Sold | Price | $/sf | Match |
|---|---|---|---|---|---|---|---|
| 1117 Talley Rd | 0.00mi | 4/2.0 | 1,925 (0%) | 0mo | $255,000 | $132 | 98 |
| 910 Marion Ave | 0.29mi | 4/2.0 | 2,000 (+4%) | 1mo | $360,000 | $180 | 77 |
| 402 Grove Ave | 0.20mi | 4/2.5 | 1,750 (-9%) | 1mo | $440,000 | $251 | 75 |
| 902 Grandview Ave | 0.20mi | 3/2.5 (-1) | 2,075 (+8%) | 1mo | $440,000 | $212 | 72 |
| 512 Lennox Rd | 0.47mi | 3/2.5 (-1) | 1,975 (+3%) | 1mo | $460,000 | $233 | 68 |
| 32 Riverside Dr | 0.40mi | 4/2.5 | 1,750 (-9%) | 3mo | $475,000 | $271 | 64 |
| 404 N Lynn Dr | 0.64mi | 4/2.5 | 2,002 (+4%) | 3mo | $455,000 | $227 | 61 |
| 206 School House Ln | 0.12mi | 3/2.0 (-1) | 1,675 (-13%) | 7mo | $397,703 | $237 | 60 |
| 705 Phillips Ave | 0.23mi | 5/3.0 (+1) | 2,175 (+13%) | 5mo | $514,000 | $236 | 57 |
| 518 Lennox Rd | 0.47mi | 4/3.0 | 2,175 (+13%) | 2mo | $460,000 | $211 | 53 |
| 526 Brighton Rd | 0.58mi | 3/1.5 (-1) | 2,075 (+8%) | 3mo | $410,000 | $198 | 48 |
| 607 Brighton Rd | 0.61mi | 3/1.5 (-1) | 2,030 (+6%) | 6mo | $480,000 | $236 | 48 |
Match score weights: distance 35% · size 25% · config 20% · recency 20%. Top-matched comps best support the ARV.
Projected returns pro-forma
-3.0% appreciation · 6.18% rent growth · sell at horizon
- IRR
- -5.4%
- Equity multiple
- 0.79×
- Total profit
- $-14,355
- Equity at exit
- $37,127
- IRR
- 7.4%
- Equity multiple
- 1.63×
- Total profit
- $44,201
- Equity at exit
- $21,529
Cash invested: $69,720 (down + closing). Projections, not guarantees.
Landlord ↔ Tenant lean methodology
- Overall (STATE)
- 70 Landlord-Friendly
- State Delaware
- 70 Landlord-Friendly · D+7
- County
- — inherits STATE
- City
- — inherits STATE
ZIP-level market 19809
- Rents YoY
- 6.2%
- Active inventory
- 48
- Price-to-rent
- 9.0×
Monthly cashflow live
- Estimated rent
- $2,298 medium interval (Pro) →
- Mortgage (P&I)
- −$1,306
- Tax from tax record
- −$116 /mo · $1,387/yr
- Insurance
- −$104
- HOA
- −$0
- Vacancy / Maint / Mgmt
- −$483
- Net cashflow
- $290
Break-even live
UW: 25.0% down · 7.5% · 30yr · 1.5% tax · 5.0% vac · 8.0% maint · 8.0% mgmt
Financing live
Cash to close
- Down payment
- $62,250
- Closing costs
- $7,470
- Reserves months
- —
- Total cash needed
- —
Loan-product check · same deal, 3 products live
Conventional
25% down · 7.5% · 30yr
- Down + closing
- —
- Monthly P&I
- —
- Monthly cashflow
- —
- DSCR
- —
- Eligible?
- —
Personal DTI + credit; lowest rate.
DSCR
20% down · 8.5% · 30yr
- Down + closing
- —
- Monthly P&I
- —
- Monthly cashflow
- —
- DSCR
- —
- Eligible?
- —
No personal income docs; deal must DSCR.
Hard money
10% down · 12.0% · 12mo
- Down + closing
- —
- Monthly P&I
- —
- Monthly cashflow
- —
- DSCR
- —
- Eligible?
- —
Short-term bridge; refi at stabilization.
Rent comps 1 comps
| Address | Beds | Baths | Sqft | Rent | $/sqft | DOM | Units | Dist |
|---|---|---|---|---|---|---|---|---|
| 240 Philadelphia Pike Wilmington, DE | 3.0 | 2.0 | 1400 | $2,100 | $1.50 | 2d | 1 | 0.64mi |
Listing history 3 events
-
2026-05-15status Pending
-
2026-05-07$249,000 Active
-
2004-04-29soldstatus $101,101
ⓘ Source: listings_history table (triggers on properties + properties_extension) + one-shot
backfill from property_details.listing_events for pre-trigger history.
Tax reassessment forecast DE · Partial reset (capped growth)
- Current annual tax
- $1,387 · $116/mo
- Projected year-2 tax
- $1,416 · $118/mo
- Expected delta
- +$28/yr (+$2/mo · 2.0%)
ⓘ Screening estimate from a state-policy table — verify with the county assessor before closing.
Climate risk First Street
- Flood 1/10 Low FEMA zone X (unshaded) · 0% chance over 30 yrs
- Wildfire 1/10 Low
- Heat 7/10 Severe 7 d/yr ≥104°F today · 15 d/yr by 30 yrs out
- Wind 6/10 Major 27% chance of damaging wind over 30 yrs
- Air quality 3/10 Moderate 2 unhealthy d/yr today · 3 by 30 yrs out
Nearby sold comps map
Loading sold comps map…
Walkable amenities ~0.75 mi
Loading nearby amenities…
Taxation est. · year 1
- Rental income
- $27,577
- − Mortgage interest
- −$13,948
- − Property taxes
- −$1,387
- − Insurance
- −$1,245
- − Repairs & maintenance
- −$2,206
- − Management
- −$2,206
- − Depreciation
- −$7,244
- Taxable loss
- −$659
- Est. tax savings @ 24.0%
- +$158
- After-tax cash flow
- $3,642/yr
For passive investors: Depreciation is non-cash, so a rental often shows a tax loss while cash-flowing — sheltering income. Rental losses are passive: they offset passive income freely, and up to $25,000/yr can offset ordinary (W-2) income if you actively participate and your MAGI is under $100k (phasing out to $0 by $150k); unused losses carry forward. On sale, claimed depreciation is recaptured at up to 25%, and gains may owe capital-gains tax (a 1031 exchange can defer both). Figures are a year-1 estimate at your 24.0% rate — not tax advice; consult a CPA.
Schools (NCES district)
- District
- Brandywine School District
- NCES district ID
- 1001240
- Math proficiency
- 28% ▼ -13.00%
- Reading proficiency
- 40% ▼ -13.00%
- Median HH income
- $68,743
- Composite
- 31.27/100
- National rank
- #6019
- State rank
- #11 of 26 in DE
Livability — Bellefonte
- Score
- 75/100
- State rank
- #6
- US rank
- #4252
Category grades
Schools grade is shown separately in the Schools card above.
Census & demographics
- Census place
- Bellefonte, DE
- County
- New Castle County · 483,412 people
- Metro
- Philadelphia-Camden-Wilmington, PA-NJ-DE-MD
- Population (ZIP)
- 14,311
- Household income
- $81,288
- Rent vs Own
- Severe rent burden
- 468.0
Population outlook (New Castle County) Hauer SSP2
- Today (2025)
- 594,686 people
- By 2030
- 609,164 · +2.4%
- By 2040
- 632,154 · +6.3%
- By 2050
- 649,068 · +9.1%
- By 2075
- 687,771 · +15.7%
- By 2100
- 694,961 · +16.9%
Race, ethnicity, and origin ACS 2023
- Neighborhood character
- Majority White (64%)
- Race & ethnicity
- White 64% Black 24% Two or more races 6% Asian 4% Hispanic / Latino 4%
- Common ancestry
- Romanian 6% Lithuanian 2% Slovak 1%
- Foreign-born
- 6% · Canada, China
- Languages at home
- 93% English-only · Spanish 2% Tagalog/Filipino 1% Other Asian/Pacific 1%
Political lean MEDSL · New Castle
- 2024 margin
- Solid D (+32.6) · D 65.5% · R 32.9% · Other 1.6%
- 2008→2024 swing
- -8.1pp toward R · 2008: 40.6pp · 2024: 32.6pp
- All cycles
- 2024: D+32.6 2020: D+37.1 2016: D+29.6 2012: D+34.1 2008: D+40.6
Not yet ingested
- Civics
- —
Market trends
- HPI YoY
- ▼ -153.39%
- Current HPI
- 232.6107
- Rent YoY
- ▲ 6.18%
- Metro
- Philadelphia-Camden-Wilmington, PA-NJ-DE-MD
- State GDP YoY
- —
- F500 in state
- 0
Price history
+146.3% since first listed3 events — show timeline
- 2026-05-15 Pending — BRIGHT MLS
- 2026-05-07 Listed $249,000 BRIGHT MLS
- 2004-04-29 Sold (Public Records) $101,101 Public Records
Property tax history
+3.3%/yrLatest (2024): $1,387 · +14.6% YoY. Source: county tax records.
Cash-flow waterfall
monthlySold comps — $/sqft
last 12 mo · ≤1 miLoading sold comps…