661 Sides Cir · Canton, TX
Flood risk 1/10 · Minimal
- FEMA flood zone
- X (unshaded)
- Chance of flooding over 30 yrs
- 0.0%
- Est. flood insurance / yr
- $507 – $1,088
Fire risk 3/10 · Minor
- Est. fire insurance / yr
- $1,222 – $2,270
Heat risk 6/10 · Moderate
- Hot days now (above 110°F)
- 7 days/yr
- Hot days in 30 yrs
- 24 days/yr
Wind risk 6/10 · Moderate
- Chance of severe wind over 30 yrs
- 52.0%
Air-quality risk 2/10 · Minimal
- Unhealthy air days now
- 0 days/yr
- Unhealthy air days in 30 yrs
- 1 days/yr
Risk factors via First Street. Map © Google.
Why this score? — see what drove the C- grade
The composite is a weighted blend of 9 inputs, each scored 0–100. Each bar is that input's sub-score; the figure is the points it added to the 100-point composite (weight × sub-score).
- Cash flow +16.5/30.0
- ARV discount +12.0/15.0
- 1% rule +5.2/10.0
- DSCR +5.1/10.0
- Schools +4.4/10.0
- Livability +3.6/5.0
- Rent growth +2.5/5.0
- Condition / age +2.5/5.0
- Appreciation +0.0/10.0
$189,000
🖨 Deal sheet 📄 Offer letter ✓ Due diligence
Listing remarks
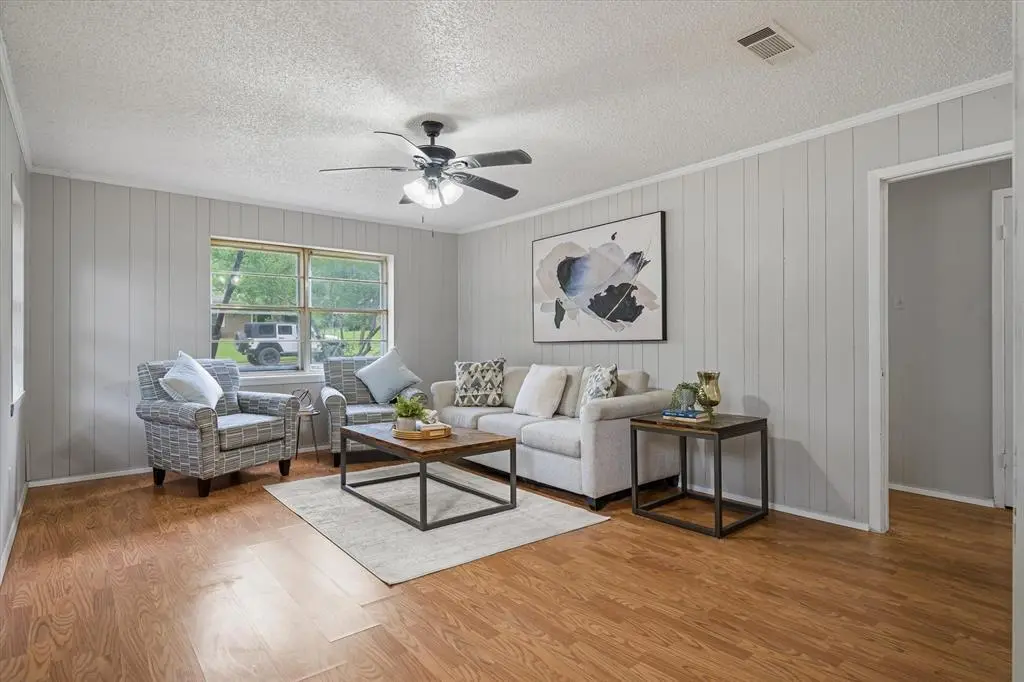
Seller offering Sellers Concessions! Welcome to this 3-bedroom, 2-bath home offering approximately 1,500 square feet, ideally situated on a corner lot in sought-after Canton ISD. Surrounded by mature trees, this property provides both shade and charm in an established neighborhood setting. Inside, you’ll find a functional layout with a mix of flooring and a sunroom that adds additional space—perfect for relaxing, entertaining, or enjoying natural light year-round. The kitchen and bathrooms have had some updates, offering a great starting point for buyers looking to add their own style and finishing touches. Additional features include an attached carport for convenient covered p
Key facts
- City utilities
- Attached carport
- Sunroom
Tags
Property features AI
Finance
- Financial info: Accepts Cash, Conventional, FHA, and Other financing; Second mortgage: No
- HOA & community: No association
Exterior
- Parking: Covered carport for 2 vehicles; Concrete driveway
- Utilities: City water; City sewer; Not in a municipal utility district
- Home design: Single family residence (residential); Attached property; Built in 1973; One story
- Construction: Shingle roof; Slab foundation; Construction materials not specified
- Exterior features: Screened patio/porch; Corner lot; Few trees; Utilities easement
Interior
- Kitchen: Dishwasher; Electric cooktop; Electric oven; Pantry; Eat-in kitchen
- Bedrooms: Primary bedroom on main level; Two additional bedrooms on main level
- Bathrooms: 2 full bathrooms
- Heating & cooling: Central heating (electric); Central air conditioning (electric)
- Interior features: Eat-in kitchen; Pantry; One living area; One dining area; 7 rooms total; One story
- Laundry & utility: Full-size washer/dryer area; Laundry located in garage; Electric water heater
Neighborhood map
What this means for you Summary
Snapshot
- This is a 3-bed/2.0-bath single-family listed at $189k.
Deal economics
- At list price, monthly cash flow is $111 ($1k/yr) — positive.
- The deal already cash-flows at list — no discount required.
- Meets the 1% rule at list price ($2k rent vs $189k).
- Recommended offer: $183k (3.0% below list) — sets the bar for market timing.
- Cap rate 7.0% vs local median 3.0% in Canton — top-decile yield for the area; either an underpriced asset or a hidden risk that comps aren't pricing in. Stress-test before assuming the spread holds.
Location & tenants
- Location reads 72/100 on livability (#239 in TX) — a middle-class / working-renter tenant base. Strengths: cost of living A+, housing A+, health & safety A+; Watch: employment C-, amenities F, commute F.
- Canton ISD (town): math 49% / reading 55% proficiency, ranked #151 of 826 in TX (top 18%) — acceptable for families but not a draw, mixed tenant base, ~2y average lease.
- Zoned schools: Canton El (571 students, 57% FRL) — zoned schools average 57% FRL vs 40% district-wide (17 pts higher); higher-poverty schools than district average — tighter screening recommended.
- Market conditions: 259 active listings in the ZIP; 10 comparable units currently listed for rent nearby; rentals leasing fast (median 7d on market — plan ~1-2 weeks tenant-placement turnaround); 54 units permitted in Van Zandt County in 2024 (0 in 5+ unit buildings).
Forward outlook
- Local home prices are declining (-3.0%/yr); year-one equity from $1k of loan paydown is wiped out by about $6k of value loss. Plan a longer hold.
- Van Zandt County population projected at +4% by 2050 — modest demand growth; plan on rents tracking national, not racing it.
Negotiation context
- It's been on market 56 days — a 3% lower offer ($183k) is reasonable based on typical stale-listing flexibility.
- 2 sale attempts with the ask held roughly flat each time — persistent listings suggest the price (not the market) is what's stuck; bring a comps-based counter.
Risks & watch-outs
- Climate carrying-cost: major wind risk, 52% chance of damaging wind over 30y; extreme-heat days projected 7→24/yr by 2055 (HVAC capex compounding) — expect insurance premiums to compound above CPI over the hold.
Questions for the listing agent
- It's been on market 56 days. Have you received any prior offers? Is the seller open to a 3% concession, seller financing, or rate buy-down credit?
- Built in 1973 — when were the roof, HVAC, electrical panel, plumbing, and water heater last replaced?
- Is there a deadline driving the sale (1031 exchange, divorce, estate, relocation)? That informs how much negotiation room exists.
- Schools are D-rated, which usually means shorter tenancies and higher turnover. Who's the typical renter profile here, and what's been the actual vacancy rate?
- What's the average days-on-market for RENTAL listings here right now (not sales)? A rising rental-DOM trend means longer vacancies and softer asking-rent achievability than the comps imply.
- What's the recent tenant-quality profile in this submarket — average credit score on applications, eviction rate, late-payment / NSF rate, and stable-employment percentage? A property-management company in the area should have these aggregated.
- How much new for-sale + rental construction is in the pipeline within 1–3 miles? Heavy new supply typically softens prices + rents 12–24 months out; constrained supply supports both.
Investment metrics
- 1% rule
- 1.02% ✓
- Cap rate
- 7.00%
- Cash-on-cash
- 2.53%
- DSCR
- 1.11
- GRM
- 8.2
CMA / ARV
- ARV (median comp)
- $209,751
- List price
- $189,000
- Delta
- -9.89%
- Verdict
- FAIR
- Comps
- 20 within 1.0 mi
Show comp detail 12 sales within ~0.75 mi
| Address | Dist | Beds/Ba | Sqft | Sold | Price | $/sf | Match |
|---|---|---|---|---|---|---|---|
| 685 Sides Cir | 0.21mi | 3/2.0 | 1,572 (+5%) | 0mo | $199,000 | $127 | 82 |
| 186 Buck Branch Ln | 0.54mi | 3/2.0 | 1,566 (+4%) | 0mo | $259,490 | $166 | 67 |
| 127 Buck Branch Ln | 0.58mi | 3/2.0 | 1,566 (+4%) | 3mo | $264,990 | $169 | 63 |
| 166 Buck Branch Ln | 0.55mi | 3/2.0 | 1,412 (-6%) | 1mo | $245,490 | $174 | 63 |
| 341 Dry Creek Ln | 0.64mi | 3/2.0 | 1,412 (-6%) | 1mo | $257,990 | $183 | 59 |
| 539 Burnett Trl | 0.66mi | 3/2.0 | 1,412 (-6%) | 0mo | $245,490 | $174 | 59 |
| 1785 Rollin Rd | 0.67mi | 2/1.0 (-1) | 1,459 (-3%) | 3mo | $174,900 | $120 | 53 |
| 1760 Lazy U Dr | 0.69mi | 3/2.0 | 1,367 (-9%) | 1mo | $219,000 | $160 | 52 |
| 1011 Athens St | 0.70mi | 3/2.0 | 1,648 (+10%) | 2mo | $265,000 | $161 | 50 |
| 147 Buck Branch Ln | 0.57mi | 3/2.0 | 1,294 (-14%) | 3mo | $239,990 | $185 | 48 |
| 519 Burnett Trl | 0.65mi | 3/2.0 | 1,294 (-14%) | 1mo | $236,045 | $182 | 46 |
| 1024 Tower St | 0.67mi | 3/2.0 | 1,724 (+15%) | 2mo | $289,900 | $168 | 43 |
Match score weights: distance 35% · size 25% · config 20% · recency 20%. Top-matched comps best support the ARV.
Projected returns pro-forma
-3.0% appreciation · 3.0% rent growth · sell at horizon
- IRR
- -12.2%
- Equity multiple
- 0.56×
- Total profit
- $-23,438
- Equity at exit
- $28,181
- IRR
- -3.1%
- Equity multiple
- 0.79×
- Total profit
- $-10,905
- Equity at exit
- $16,341
Cash invested: $52,920 (down + closing). Projections, not guarantees.
Landlord ↔ Tenant lean methodology
- Overall (STATE)
- 87 Strongly Landlord-Friendly
- State Texas
- 87 Strongly Landlord-Friendly · R+5
- County
- — inherits STATE
- City
- — inherits STATE
ZIP-level market 75103
- Home prices YoY
- -14.3%
- Active inventory
- 259
- Price-to-rent
- 8.2×
Monthly cashflow live
- Estimated rent
- $1,920 high interval (Pro) →
- Mortgage (P&I)
- −$991
- Tax from tax record
- −$335 /mo · $4,022/yr
- Insurance
- −$79
- HOA
- −$0
- Vacancy / Maint / Mgmt
- −$403
- Net cashflow
- $111
Break-even live
UW: 25.0% down · 7.5% · 30yr · 1.5% tax · 5.0% vac · 8.0% maint · 8.0% mgmt
Financing live
Cash to close
- Down payment
- $47,250
- Closing costs
- $5,670
- Reserves months
- —
- Total cash needed
- —
Loan-product check · same deal, 3 products live
Conventional
25% down · 7.5% · 30yr
- Down + closing
- —
- Monthly P&I
- —
- Monthly cashflow
- —
- DSCR
- —
- Eligible?
- —
Personal DTI + credit; lowest rate.
DSCR
20% down · 8.5% · 30yr
- Down + closing
- —
- Monthly P&I
- —
- Monthly cashflow
- —
- DSCR
- —
- Eligible?
- —
No personal income docs; deal must DSCR.
Hard money
10% down · 12.0% · 12mo
- Down + closing
- —
- Monthly P&I
- —
- Monthly cashflow
- —
- DSCR
- —
- Eligible?
- —
Short-term bridge; refi at stabilization.
Rent comps 10 comps
| Address | Beds | Baths | Sqft | Rent | $/sqft | DOM | Units | Dist |
|---|---|---|---|---|---|---|---|---|
| 108 Granada Sq Canton, TX | 3.0 | 2.0 | 2022 | $2,400 | $1.19 | 16d | 1 | 0.23mi |
| 1361 Shady Ln Canton, TX | 3.0 | 2.0 | 1262 | $1,600 | $1.27 | 1d | 1 | 0.56mi |
| 341 Dry Creek Ln Canton, TX | 3.0 | 2.0 | 1412 | $1,900 | $1.35 | 24d | 1 | 0.61mi |
| 519 Burnett Trl Canton, TX | 3.0 | 2.0 | 1294 | $1,900 | $1.47 | 22d | 1 | 0.62mi |
| 1107 Tower St Canton, TX | 3.0 | 1.5 | 1210 | $1,525 | $1.26 | 18d | 1 | 0.65mi |
| 900 W State Highway 243 Canton, TX | 3.0 | 2.0 | 1087 | $1,750 | $1.61 | 1d | 1 | 0.74mi |
| 175 E Elm St Canton, TX | 3.0 | 2.0 | 1904 | $2,100 | $1.10 | 1d | 1 | 0.75mi |
| 908 Texas 243 Canton, TX | 3.0 | 2.0 | 1148 | $1,750 | $1.52 | 1d | 1 | 0.76mi |
| 405 Beard St Canton, TX | 3.0 | 2.0 | 1147 | $1,675 | $1.46 | 7d | 1 | 0.82mi |
| 680 Cherry Creek Ln Canton, TX | 3.0 | 2.0 | 1244 | $1,700 | $1.37 | 1d | 1 | 1.35mi |
Listing history 19 events
-
2026-06-18days on market $189,000 Active 56 DOM
-
2026-06-17days on market $189,000 Active 55 DOM
-
2026-06-16days on market $189,000 Active 54 DOM
-
2026-06-15days on market $189,000 Active 53 DOM
-
2026-06-13days on market $189,000 Active 51 DOM
-
2026-06-13days on market $189,000 Active 50 DOM
-
2026-06-09days on market $189,000 Active 47 DOM
-
2026-06-08days on market $189,000 Active 46 DOM
-
2026-06-07days on market $189,000 Active 45 DOM
-
2026-06-04days on market $189,000 Active 42 DOM
-
2026-06-03days on market $189,000 Active 41 DOM
-
2026-06-02days on market $189,000 Active 40 DOM
-
2026-06-01days on market $189,000 Active 39 DOM
-
2026-05-31days on market $189,000 Active 38 DOM
-
2026-04-22$189,000 Active 965-char remark
-
2025-04-10soldstatus Closed
-
2025-04-07$115,000 Active
-
2025-04-04soldstatus
-
2025-04-04soldstatus
ⓘ Source: listings_history table (triggers on properties + properties_extension) + one-shot
backfill from property_details.listing_events for pre-trigger history.
Tax reassessment forecast TX · Resets to sale price
- Current annual tax
- $4,022 · $335/mo
- Projected year-2 tax
- $4,022 · $335/mo
- Expected delta
- $0/yr ($0/mo · 0.0%)
ⓘ Screening estimate from a state-policy table — verify with the county assessor before closing.
Climate risk First Street
- Flood 1/10 Low FEMA zone X (unshaded) · 0% chance over 30 yrs
- Wildfire 3/10 Moderate
- Heat 6/10 Major 7 d/yr ≥110°F today · 24 d/yr by 30 yrs out
- Wind 6/10 Major 52% chance of damaging wind over 30 yrs
- Air quality 2/10 Low 0 unhealthy d/yr today · 1 by 30 yrs out
Nearby sold comps map
Loading sold comps map…
Walkable amenities ~0.75 mi
Loading nearby amenities…
Taxation est. · year 1
- Rental income
- $23,036
- − Mortgage interest
- −$10,587
- − Property taxes
- −$4,022
- − Insurance
- −$945
- − Repairs & maintenance
- −$1,843
- − Management
- −$1,843
- − Depreciation
- −$5,498
- Taxable loss
- −$1,702
- Est. tax savings @ 24.0%
- +$409
- After-tax cash flow
- $1,746/yr
For passive investors: Depreciation is non-cash, so a rental often shows a tax loss while cash-flowing — sheltering income. Rental losses are passive: they offset passive income freely, and up to $25,000/yr can offset ordinary (W-2) income if you actively participate and your MAGI is under $100k (phasing out to $0 by $150k); unused losses carry forward. On sale, claimed depreciation is recaptured at up to 25%, and gains may owe capital-gains tax (a 1031 exchange can defer both). Figures are a year-1 estimate at your 24.0% rate — not tax advice; consult a CPA.
Schools (NCES district)
- District
- Canton ISD
- NCES district ID
- 4812750
- Math proficiency
- 49% ▼ -12.00%
- Reading proficiency
- 55% ▼ -1.00%
- Median HH income
- $46,385
- Composite
- 44.08/100
- National rank
- #2877
- State rank
- #151 of 826 in TX
Livability — Canton
- Score
- 72/100
- State rank
- #239
- US rank
- #5787
Category grades
Schools grade is shown separately in the Schools card above.
Census & demographics
- Census place
- Canton, TX
- Population (ZIP)
- 16,222
Population outlook (Van Zandt County) Hauer SSP2
- Today (2025)
- 55,634 people
- By 2030
- 56,479 · +1.5%
- By 2040
- 57,672 · +3.7%
- By 2050
- 57,913 · +4.1%
- By 2075
- 57,544 · +3.4%
- By 2100
- 52,659 · -5.3%
Race, ethnicity, and origin ACS 2023
- Neighborhood character
- Predominantly White (86%)
- Race & ethnicity
- White 86% Hispanic / Latino 7% Two or more races 5% Black 1%
- Hispanic origin (detail)
- Mexican 7%
- Common ancestry
- Lithuanian 2% Italian 1% Slovak 1%
- Foreign-born
- 2% · Canada
- Languages at home
- 95% English-only · Spanish 4%
Political lean MEDSL · Van Zandt
- 2024 margin
- Solid R (+74.8) · D 12.3% · R 87.2%
- 2008→2024 swing
- -19.8pp toward R · 2008: -55.1pp · 2024: -74.8pp
- All cycles
- 2024: R+74.8 2020: R+72.1 2016: R+72.1 2012: R+66.6 2008: R+55.1
Not yet ingested
- Civics
- —
Market trends
- HPI YoY
- ▼ -38.07%
- Current HPI
- 227.6156
- Rent YoY
- —
- Metro
- —
- State GDP YoY
- ▲ 3.95%
- F500 in state
- 110
Industry mix (Fortune 500 HQ in TX)
| Industry | F500 HQs | Revenue |
|---|---|---|
| Energy | 16 | $1,198B |
|
||
| Technology | 5 | $198B |
|
||
| Engineering / Construction | 4 | $72B |
|
||
| Energy Services | 3 | $60B |
|
||
| Utilities | 3 | $41B |
|
||
| Healthcare | 2 | $330B |
|
||
Price history
+64.3% since first listed5 events — show timeline
- 2026-04-22 Listed $189,000 NTREIS
- 2025-04-10 Sold (MLS) — NTREIS
- 2025-04-07 Listed $115,000 NTREIS
- 2025-04-04 Sold (Public Records) — Public Records
- 2025-04-04 Sold (Public Records) — Public Records
Property tax history
+5.7%/yrLatest (2025): $4,022 · -6.8% YoY. Source: county tax records.
Cash-flow waterfall
monthlySold comps — $/sqft
last 12 mo · ≤1 miLoading sold comps…