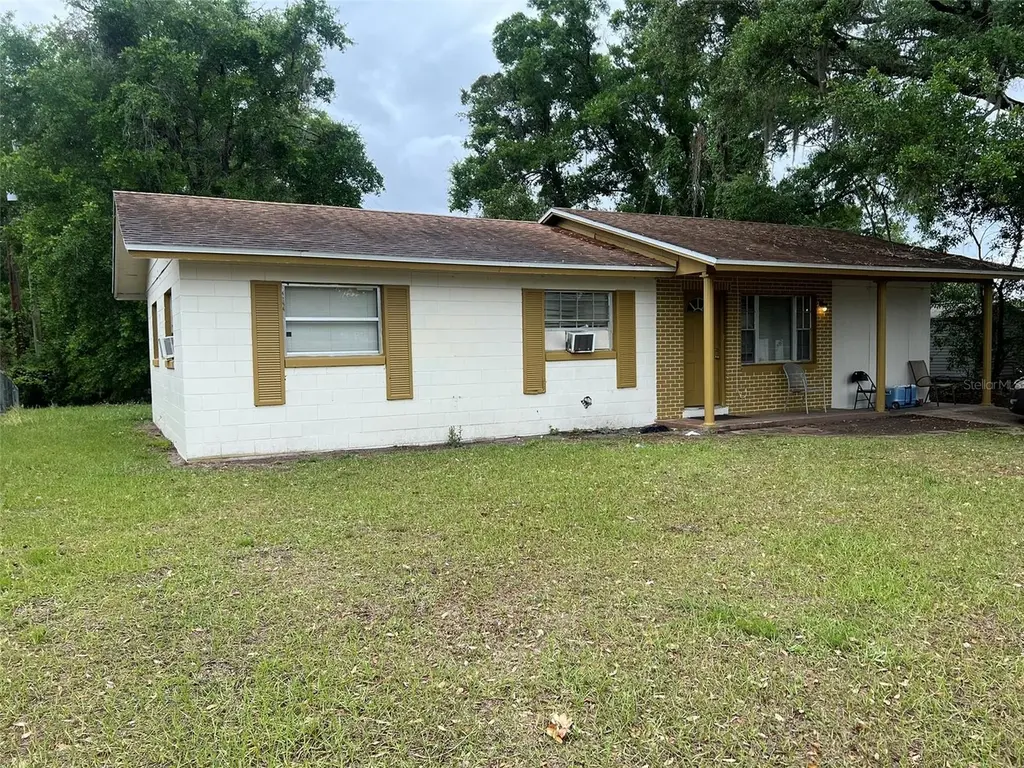
132 Argos Ave · Orlando, FL
Flood risk 1/10 · Minimal
- FEMA flood zone
- X (unshaded)
- Chance of flooding over 30 yrs
- 0.0%
- Est. flood insurance / yr
- $507 – $1,088
Fire risk 1/10 · Minimal
- Est. fire insurance / yr
- $947 – $1,759
Heat risk 9/10 · Severe
- Hot days now (above 108°F)
- 7 days/yr
- Hot days in 30 yrs
- 23 days/yr
Wind risk 9/10 · Severe
- Chance of severe wind over 30 yrs
- 99.0%
Air-quality risk 1/10 · Minimal
- Unhealthy air days now
- 0 days/yr
- Unhealthy air days in 30 yrs
- 0 days/yr
Risk factors via First Street. Map © Google.
Why this score? — see what drove the C+ grade
The composite is a weighted blend of 9 inputs, each scored 0–100. Each bar is that input's sub-score; the figure is the points it added to the 100-point composite (weight × sub-score).
- Cash flow +23.6/30.0
- ARV discount +13.9/15.0
- DSCR +7.6/10.0
- 1% rule +5.7/10.0
- Livability +4.3/5.0
- Schools +4.1/10.0
- Rent growth +2.5/5.0
- Condition / age +2.5/5.0
- Appreciation +0.0/10.0
$165,000
🖨 Deal sheet (PDF) 📄 Offer letter ✓ Due diligence
Listing remarks MLS
Short Sale; approval of the seller's lenders(s) may be conditioned upon the gross commission being reduced, any reduction of the gross commission will be apportioned (insert apportionment or split)between listing and cooperating brokers. "Short Sale; approval of the seller's lenders(s) may be conditioned upon the gross commission being reduced, any reduction of the gross commission will be apportioned Between listing and cooperating brokers. ACTIVE WITH CONTRACT WAITING LENDER APPROVAL
Key facts
- 8,721 sq ft lot
- Built 1967
- Listed 74 days
Property features AI
Finance
- Other: Zoned R-1
- Financial info: No lease restrictions; Unfurnished
- HOA & community: No HOA
Exterior
- Parking: No parking details listed
- Security: No security features listed
- Utilities: Public water; Public sewer; Water available
- Home design: Single-family residence; Residential property; One story; Faces east; Entry level: One
- Construction: Block construction; Shingle roof; Slab foundation; Built on lot of about 0.2 acres
- Exterior features: Private mailbox; Asphalt road
Interior
- Kitchen: Cooktop; Dishwasher; Microwave
- Bedrooms: 4 bedrooms
- Flooring: Tile
- Bathrooms: 1 full bathroom
- Heating & cooling: Ductless heating; Wall/window unit cooling
- Interior features: Thermostat; Ductless heating; Wall/window cooling units
- Laundry & utility: No laundry features listed
Neighborhood map
What this means for you Summary
Snapshot
- This is a 3-bed/1.0-bath single-family listed at $165k.
Deal economics
- At list price, monthly cash flow is $311 ($4k/yr) — positive.
- The deal already cash-flows at list — no discount required.
- Meets the 1% rule at list price ($2k rent vs $165k).
- Recommended offer: $155k (6.0% below list) — sets the bar for market timing.
- Cap rate 8.6% vs local median 3.0% in Orlando — top-decile yield for the area; either an underpriced asset or a hidden risk that comps aren't pricing in. Stress-test before assuming the spread holds.
Location & tenants
- Location reads 86/100 on livability (#12 in FL, #360 nationally) — a professional / high-income tenant draw. Strengths: amenities A+, commute A+, housing A+.
- Orange (suburban): math 46% / reading 51% proficiency, ranked #43 of 73 in FL (top 59%) — families likely to look elsewhere, expect single-tenant / working-renter base with shorter leases.
- Market conditions: Rents flat; 241 active listings in the ZIP; 18 comparable units currently listed for rent nearby; rentals at typical pace (median 25d on market — plan ~3-4 weeks tenant-placement turnaround); 8,053 units permitted in Orange County in 2024 (3,133 in 5+ unit buildings).
- This rent runs 39% of the median local income ($54k/yr) — at the standard rent-burdened threshold; future hikes will face affordability resistance.
Forward outlook
- Local home prices are declining (-3.0%/yr); year-one equity from $1k of loan paydown is wiped out by about $5k of value loss. Plan a longer hold.
- Orange County population projected at +52% by 2050 — long-run rental-demand tailwind backs the buy-and-hold thesis.
Negotiation context
- It's been on market 75 days — a 6% lower offer ($155k) is reasonable based on typical stale-listing flexibility.
- 7 sale attempts since 21y ago with the ask held roughly flat each time — persistent listings suggest the price (not the market) is what's stuck; bring a comps-based counter.
- Current owner paid $23k; list at $165k implies a 627% gain — meaningful room to come down on a strong offer.
Risks & watch-outs
- Climate carrying-cost: severe wind risk, 99% chance of damaging wind over 30y; extreme-heat days projected 7→23/yr by 2055 (HVAC capex compounding) — expect insurance premiums to compound above CPI over the hold.
Questions for the listing agent
- It's been on market 75 days. Have you received any prior offers? Is the seller open to a 6% concession, seller financing, or rate buy-down credit?
- Built in 1967 — when were the roof, HVAC, electrical panel, plumbing, and water heater last replaced?
- Why hasn't it sold? Are there any deal-killer items the seller is aware of (foundation, flood, title, zoning, code violations)?
- Is there a deadline driving the sale (1031 exchange, divorce, estate, relocation)? That informs how much negotiation room exists.
- Schools are B-rated — typically a magnet for longer-tenancy family renters. What's the average tenant stay here, and is there a school-zone premium baked into asking?
- What's the average days-on-market for RENTAL listings here right now (not sales)? A rising rental-DOM trend means longer vacancies and softer asking-rent achievability than the comps imply.
- What's the recent tenant-quality profile in this submarket — average credit score on applications, eviction rate, late-payment / NSF rate, and stable-employment percentage? A property-management company in the area should have these aggregated.
- How much new for-sale + rental construction is in the pipeline within 1–3 miles? Heavy new supply typically softens prices + rents 12–24 months out; constrained supply supports both.
Investment metrics
- 1% rule
- 1.07% ✓
- Cap rate
- 8.55%
- Cash-on-cash
- 8.07%
- DSCR
- 1.36
- GRM
- 7.8
CMA / ARV
- ARV (on-the-fly)
- $192,280
- Comps found
- 1
Show comp detail 1 sale within ~0.75 mi
| Address | Dist | Beds/Ba | Sqft | Sold | Price | $/sf | Match |
|---|---|---|---|---|---|---|---|
| 4548 Piedmont St | 0.72mi | 3/1.0 | 912 (+9%) | 8mo | $210,000 | $230 | 45 |
Match score weights: distance 35% · size 25% · config 20% · recency 20%. Top-matched comps best support the ARV.
Projected returns pro-forma
-3.0% appreciation · 0.15% rent growth · sell at horizon
- IRR
- -7.2%
- Equity multiple
- 0.74×
- Total profit
- $-11,899
- Equity at exit
- $24,602
- IRR
- -1.5%
- Equity multiple
- 0.91×
- Total profit
- $-4,065
- Equity at exit
- $14,266
Cash invested: $46,200 (down + closing). Projections, not guarantees.
Landlord ↔ Tenant lean methodology
- Overall (STATE)
- 87 Strongly Landlord-Friendly
- State Florida
- 87 Strongly Landlord-Friendly · R+3
- County
- — inherits STATE
- City
- — inherits STATE
ZIP-level market 32811
- Home prices YoY
- -33.8%
- Rents YoY
- 0.1%
- Active inventory
- 241
- Price-to-rent
- 7.8×
Monthly cashflow live
- Estimated rent
- $1,774 high interval (Pro) →
- Mortgage (P&I)
- −$865
- Tax from tax record
- −$156 /mo · $1,877/yr
- Insurance
- −$69
- HOA
- −$0
- Vacancy / Maint / Mgmt
- −$372
- Net cashflow
- $311
Break-even live
Sensitivity live
| Price | -10% $404 | -5% $357 | +0% $311 | +5% $264 | +10% $217 |
|---|---|---|---|---|---|
| Rent | -10% $171 | -5% $241 | +0% $311 | +5% $381 | +10% $451 |
| Rate | -1.0pp $394 | -0.5pp $353 | base $311 | +0.5pp $268 | +1.0pp $224 |
UW: 25.0% down · 7.5% · 30yr · 1.5% tax · 5.0% vac · 8.0% maint · 8.0% mgmt
Financing live
Cash to close
- Down payment
- $41,250
- Closing costs
- $4,950
- Reserves months
- —
- Total cash needed
- —
Loan-product check · same deal, 3 products live
Conventional
25% down · 7.5% · 30yr
- Down + closing
- —
- Monthly P&I
- —
- Monthly cashflow
- —
- DSCR
- —
- Eligible?
- —
Personal DTI + credit; lowest rate.
DSCR
20% down · 8.5% · 30yr
- Down + closing
- —
- Monthly P&I
- —
- Monthly cashflow
- —
- DSCR
- —
- Eligible?
- —
No personal income docs; deal must DSCR.
Hard money
10% down · 12.0% · 12mo
- Down + closing
- —
- Monthly P&I
- —
- Monthly cashflow
- —
- DSCR
- —
- Eligible?
- —
Short-term bridge; refi at stabilization.
Rent comps 18 comps
| Address | Beds | Baths | Sqft | Rent | $/sqft | DOM | Units | Dist |
|---|---|---|---|---|---|---|---|---|
| 4610 Barley St Orlando, FL | 2.0 | 1.0 | 805 | $1,699 | $2.11 | 24d | 1 | 0.05mi |
| 200 Fanfair Ave Orlando, FL | 3.0 | 1.0 | 941 | $1,730 | $1.84 | 8d | 1 | 0.10mi |
| 4431 Barley St Orlando, FL | 4.0 | 1.0 | 1026 | $864 | $0.84 | 24d | 1 | 0.23mi |
| 4333 Cynthia St Orlando, FL | 3.0 | 2.0 | 1039 | $1,813 | $1.74 | 22d | 1 | 0.39mi |
| 767 Willie Mays Pkwy Orlando, FL | 2.0 | 1.0 | 630 | $1,470 | $2.33 | 24d | 1 | 0.48mi |
| 769 Willie Mays Pkwy Orlando, FL | 2.0 | 1.0 | 700 | $1,500 | $2.14 | 5d | 1 | 0.49mi |
| 701 S Ivey Ln Orlando, FL | 2.0–3.0 | 1.0 | 871 | $1,329 | $1.53 | 24d | 1 | 0.64mi |
| 5235 Florida Holly Dr Orlando, FL | 3.0 | 2.0 | 1107 | $2,100 | $1.90 | 24d | 1 | 1.03mi |
| 5132 Elese St Orlando, FL | 3.0 | 2.0 | 960 | $1,800 | $1.88 | 17d | 1 | 1.07mi |
| 1025 Clovercrest Rd Orlando, FL | 3.0 | 2.0 | 1050 | $2,100 | $2.00 | 18d | 1 | 1.08mi |
| 1025 Clovercrest Rd Orlando, FL | 3.0 | 2.0 | 1050 | $2,100 | $2.00 | 24d | 1 | 1.08mi |
| 1036 Ola Dr Unit 2 Orlando, FL | 2.0 | 1.0 | 552 | $1,195 | $2.16 | 24d | 1 | 1.14mi |
| 1216 Lawne Blvd Orlando, FL | 3.0 | 2.0 | 1000 | $1,800 | $1.80 | 24d | 1 | 1.26mi |
| 3950 Columbia St Orlando, FL | 1.0–2.0 | 1.0–2.0 | 875 | $1,416 | $1.62 | 24d | 1 | 1.27mi |
| 907 S Kirkman Rd Orlando, FL | 2.0–4.0 | 2.0 | 1131 | $1,660 | $1.47 | 4d | 14 | 1.31mi |
| 464 S Kirkman Rd Orlando, FL | 1.0–3.0 | 1.0–2.0 | 977 | $2,375 | $2.43 | 3d | 19 | 1.32mi |
| 3205 Orange Center Blvd Orlando, FL | 2.0 | 1.0 | 600 | $1,336 | $2.23 | 24d | 1 | 1.44mi |
| 3025 Long St Unit A Orlando, FL | 2.0 | 1.0 | 678 | $1,650 | $2.43 | 24d | 1 | 1.46mi |
Listing history 40 events
-
2026-06-21days on market $165,000 Active 75 DOM
-
2026-06-18days on market $165,000 Active 72 DOM
-
2026-06-17days on market $165,000 Active 71 DOM
-
2026-06-16days on market $165,000 Active 70 DOM
-
2026-06-15days on market $165,000 Active 69 DOM
-
2026-06-13days on market $165,000 Active 67 DOM
-
2026-06-13days on market $165,000 Active 66 DOM
-
2026-06-09days on market $165,000 Active 63 DOM
-
2026-06-08days on market $165,000 Active 62 DOM
-
2026-06-07days on market $165,000 Active 61 DOM
-
2026-06-04days on market $165,000 Active 58 DOM
-
2026-06-03days on market $165,000 Active 57 DOM
-
2026-06-02days on market $165,000 Active 56 DOM
-
2026-06-02days on market $165,000 Active 55 DOM
-
2026-05-31days on market $165,000 Active 54 DOM
-
2026-04-07$165,000 Active
-
2016-02-12historical
-
2015-09-08status Active
-
2015-09-08price $79,000
-
2014-06-14status Pending
-
2014-06-10historical
-
2014-03-31price $65,000
-
2014-03-31price $65,000
-
2014-03-31price $79,000
-
2013-08-30historical
-
2013-07-10$43,000
-
2012-07-18soldstatus $22,700 500-char remark
Show marketing remark (500 chars)
Short Sale; approval of the seller's lenders(s) may be conditioned upon the gross commission being reduced, any reduction of the gross commission will be apportioned (insert apportionment or split)between listing and cooperating brokers. "Short Sale; approval of the seller's lenders(s) may be conditioned upon the gross commission being reduced, any reduction of the gross commission will be apportioned Between listing and cooperating brokers. ACTIVE WITH CONTRACT WAITING LENDER APPROVAL
-
2012-02-17$25,000 500-char remark
Show marketing remark (500 chars)
Short Sale; approval of the seller's lenders(s) may be conditioned upon the gross commission being reduced, any reduction of the gross commission will be apportioned (insert apportionment or split)between listing and cooperating brokers. "Short Sale; approval of the seller's lenders(s) may be conditioned upon the gross commission being reduced, any reduction of the gross commission will be apportioned Between listing and cooperating brokers. ACTIVE WITH CONTRACT WAITING LENDER APPROVAL
-
2008-06-04soldstatus $60,000
-
2008-05-20soldstatus $60,000
-
2008-05-15soldstatus $60,000
-
2007-08-10$80,000
-
2006-09-06soldstatus $132,500
-
2006-04-12soldstatus $132,500
-
2005-10-10soldstatus $89,900
-
2005-10-06$132,900
-
2005-10-05soldstatus $89,900
-
2005-08-23$89,900
-
1977-10-01soldstatus $14,000
-
1977-09-01soldstatus $14,000
ⓘ Source: listings_history table (triggers on properties + properties_extension) + one-shot
backfill from property_details.listing_events for pre-trigger history.
Tax reassessment forecast FL · Resets to sale price
- Current annual tax
- $1,877 · $156/mo
- Projected year-2 tax
- $1,877 · $156/mo
- Expected delta
- $0/yr ($0/mo · 0.0%)
ⓘ Screening estimate from a state-policy table — verify with the county assessor before closing.
Climate risk First Street
- Flood 1/10 Low FEMA zone X (unshaded) · 0% chance over 30 yrs
- Wildfire 1/10 Low
- Heat 9/10 Extreme 7 d/yr ≥108°F today · 23 d/yr by 30 yrs out
- Wind 9/10 Extreme 99% chance of damaging wind over 30 yrs
- Air quality 1/10 Low 0 unhealthy d/yr today · 0 by 30 yrs out
Nearby sold comps map
Loading sold comps map…
Walkable amenities ~0.75 mi
Loading nearby amenities…
Taxation est. · year 1
- Rental income
- $21,282
- − Mortgage interest
- −$9,243
- − Property taxes
- −$1,877
- − Insurance
- −$825
- − Repairs & maintenance
- −$1,703
- − Management
- −$1,703
- − Depreciation
- −$4,800
- Taxable income
- $1,133
- Est. tax owed @ 24.0%
- −$272
- After-tax cash flow
- $3,456/yr
For passive investors: Depreciation is non-cash, so a rental often shows a tax loss while cash-flowing — sheltering income. Rental losses are passive: they offset passive income freely, and up to $25,000/yr can offset ordinary (W-2) income if you actively participate and your MAGI is under $100k (phasing out to $0 by $150k); unused losses carry forward. On sale, claimed depreciation is recaptured at up to 25%, and gains may owe capital-gains tax (a 1031 exchange can defer both). Figures are a year-1 estimate at your 24.0% rate — not tax advice; consult a CPA.
Schools (NCES district)
- District
- Orange
- NCES district ID
- 1201440
- Math proficiency
- 46% ▼ -9.00%
- Reading proficiency
- 51% ▼ -2.00%
- Median HH income
- $49,350
- Composite
- 41.47/100
- National rank
- #3461
- State rank
- #43 of 73 in FL
Livability — Orlando
- Score
- 86/100
- State rank
- #12
- US rank
- #360
Category grades
Schools grade is shown separately in the Schools card above.
Census & demographics
- Census place
- Orlando, FL
- County
- Orange County · 1,471,359 people
- City population
- 964,969
- Metro
- Orlando-Kissimmee-Sanford, FL
- Population (ZIP)
- 41,475
- Household income
- $54,082
- Rent vs Own
- Severe rent burden
- 2728.0
Population outlook (Orange County) Hauer SSP2
- Today (2025)
- 1,618,226 people
- By 2030
- 1,787,404 · +10.5%
- By 2040
- 2,125,621 · +31.4%
- By 2050
- 2,454,016 · +51.6%
- By 2075
- 3,173,711 · +96.1%
- By 2100
- 3,607,781 · +122.9%
Race, ethnicity, and origin ACS 2023
- Neighborhood character
- Diverse neighborhood (Simpson 0.66)
- Race & ethnicity
- Black 50% Hispanic / Latino 27% Two or more races 17% White 12% Asian 2%
- Hispanic origin (detail)
- Mexican 2% Puerto Rican 8% Dominican 2%
- Common ancestry
- Hispanic 7% Estonian 4% Russian 1%
- Foreign-born
- 31% · Canada, Jamaica, China
- Languages at home
- 62% English-only · Spanish 21% French/Haitian/Cajun 8% Other Indo-European 6%
Political lean MEDSL · Orange
- 2024 margin
- D (+13.6) · D 56.1% · R 42.5% · Other 1.3%
- 2008→2024 swing
- -5.0pp toward R · 2008: 18.6pp · 2024: 13.6pp
- All cycles
- 2024: D+13.6 2020: D+23.1 2016: D+24.6 2012: D+18.2 2008: D+18.6
Not yet ingested
- Civics
- —
Market trends
- HPI YoY
- ▼ -145.37%
- Current HPI
- 284.9191
- Rent YoY
- ▲ 0.15%
- Metro
- Orlando-Kissimmee-Sanford, FL
- State GDP YoY
- ▲ 3.28%
- F500 in state
- 36
Industry mix (Fortune 500 HQ in FL)
| Industry | F500 HQs | Revenue |
|---|---|---|
| Industrial Technology | 2 | $29B |
|
||
| Insurance | 2 | $17B |
|
||
| Retail | 1 | $60B |
|
||
| Technology Distribution | 1 | $58B |
|
||
| Homebuilding | 1 | $35B |
|
||
| Technology Manufacturing | 1 | $35B |
|
||
Price history
+1078.6% since first listed25 events — show timeline
- 2026-04-07 Listed $165,000 Stellar MLS as Distributed by MLS Grid
- 2016-02-12 Listing Removed — Stellar MLS as Distributed by MLS Grid
- 2015-09-08 Price Changed $79,000 Stellar MLS as Distributed by MLS Grid
- 2015-09-08 Relisted — Stellar MLS as Distributed by MLS Grid
- 2014-06-14 Pending — Stellar MLS as Distributed by MLS Grid
- 2014-06-10 Listing Removed — Stellar MLS as Distributed by MLS Grid
- 2014-03-31 Price Changed $79,000 Stellar MLS as Distributed by MLS Grid
- 2014-03-31 Price Changed $65,000 Stellar MLS as Distributed by MLS Grid
- 2014-03-31 Price Changed $65,000 Stellar MLS as Distributed by MLS Grid
- 2013-08-30 Listing Removed — Stellar MLS as Distributed by MLS Grid
- 2013-07-10 Listed $43,000 Stellar MLS as Distributed by MLS Grid
- 2012-07-18 Sold (MLS) $22,700 Stellar MLS as Distributed by MLS Grid
- 2012-02-17 Listed $25,000 Stellar MLS as Distributed by MLS Grid
- 2008-06-04 Sold (Public Records) $60,000 Public Records
- 2008-05-20 Sold (MLS) $60,000 Stellar MLS as Distributed by MLS Grid
- 2008-05-15 Sold (Public Records) $60,000 Public Records
- 2007-08-10 Listed $80,000 Stellar MLS as Distributed by MLS Grid
- 2006-09-06 Sold (Public Records) $132,500 Public Records
- 2006-04-12 Sold (MLS) $132,500 Stellar MLS as Distributed by MLS Grid
- 2005-10-10 Sold (Public Records) $89,900 Public Records
- 2005-10-06 Listed $132,900 Stellar MLS as Distributed by MLS Grid
- 2005-10-05 Sold (MLS) $89,900 Stellar MLS as Distributed by MLS Grid
- 2005-08-23 Listed $89,900 Stellar MLS as Distributed by MLS Grid
- 1977-10-01 Sold (Public Records) $14,000 Public Records
- 1977-09-01 Sold (Public Records) $14,000 Public Records
Property tax history
+10.4%/yrLatest (2025): $1,877 · +11.9% YoY. Source: county tax records.
Cash-flow waterfall
monthlySold comps — $/sqft
last 12 mo · ≤1 miLoading sold comps…