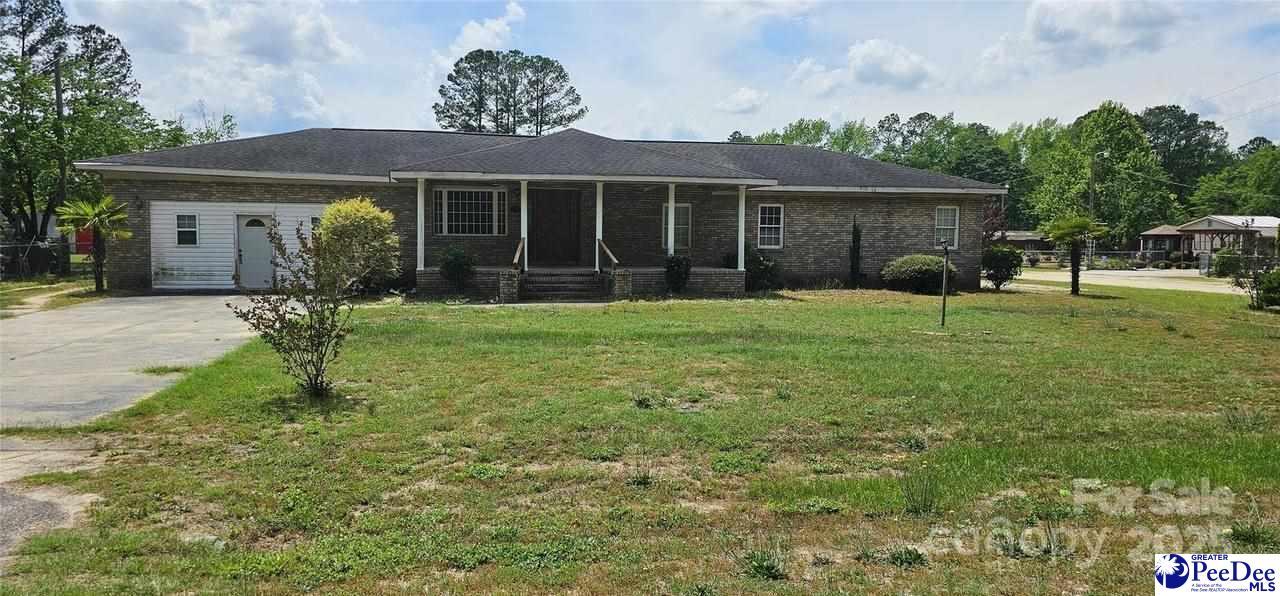
3921 Savannah Grove Rd · Florence, SC
Flood risk 1/10 · Minimal
- FEMA flood zone
- X (unshaded)
- Chance of flooding over 30 yrs
- 0.0%
- Est. flood insurance / yr
- $507 – $1,088
Fire risk 6/10 · Moderate
- Est. fire insurance / yr
- $783 – $1,453
Heat risk 7/10 · Major
- Hot days now (above 109°F)
- 7 days/yr
- Hot days in 30 yrs
- 16 days/yr
Wind risk 8/10 · Major
- Chance of severe wind over 30 yrs
- 80.0%
Air-quality risk 1/10 · Minimal
- Unhealthy air days now
- 0 days/yr
- Unhealthy air days in 30 yrs
- 0 days/yr
Risk factors via First Street. Map © Google.
Why this score? — see what drove the D grade
The composite is a weighted blend of 9 inputs, each scored 0–100. Each bar is that input's sub-score; the figure is the points it added to the 100-point composite (weight × sub-score).
- Cash flow +12.4/30.0
- ARV discount +7.5/15.0
- Rent growth +4.2/5.0
- DSCR +3.7/10.0
- 1% rule +3.5/10.0
- Schools +3.2/10.0
- Livability +3.1/5.0
- Condition / age +2.5/5.0
- Appreciation +0.0/10.0
$203,000
🖨 Deal sheet (PDF) 📄 Offer letter ✓ Due diligence
Listing remarks
Welcome to this exquisite 3-bedroom, 2-bathroom residence, adorned with stunning hardwood flooring throughout. This property boasts the added convenience of an enclosed garage, ideally suited for a workshop, hobby area, or extra storage. Experience year-round relaxation on the expansive screened-in deck, perfect for entertaining guests or enjoying peaceful moments. The charming large front porch enhances the appeal, providing an ideal setting for your morning coffee or evening unwinding. This home seamlessly combines comfort, functionality, and outdoor enjoyment, making it a truly inviting sanctuary!
Key facts
- Hardwood flooring
- Enclosed garage
- Large front porch
Tags
Property features AI
Finance
- Other: Approximately 0.69-acre lot
Exterior
- Home design: Single-family residence; Residential property
- Exterior features: Deck; Porch
Interior
- Kitchen: Oven; Range
- Flooring: Wood; Hardwood
- Bathrooms: 2 full bathrooms
- Heating & cooling: Heat pump
- Interior features: Oven; Range
Neighborhood map
What this means for you Summary
Snapshot
- This is a 3-bed/2.0-bath single-family listed at $203k.
Deal economics
- At list price, monthly cash flow is $-35 ($-421/yr) — negative.
- To cash-flow at today's rent, offer at most $198k (2.5% below list).
- To meet the 1% rule (rent ≥ 1% of price), the offer needs to be $173k (14.7% below list).
- Recommended offer: $173k (14.7% below list) — sets the bar for 1% rule.
- Cap rate 6.1% vs local median 3.5% in Florence — top-decile yield for the area; either an underpriced asset or a hidden risk that comps aren't pricing in. Stress-test before assuming the spread holds.
Location & tenants
- Location reads 62/100 on livability (#196 in SC) — a middle-class / working-renter tenant base. Strengths: cost of living A+, housing A+, health & safety B+; Watch: employment C-, crime F, amenities F.
- Florence 01 (urban): math 29% / reading 47% proficiency, ranked #34 of 80 in SC (top 42%) — families likely to look elsewhere, expect single-tenant / working-renter base with shorter leases.
- Zoned schools: Savannah Grove Elementary (math 24% / reading 29%, grade F, #435 of 597 statewide, top 73%, 432 students, 100% FRL); Henry L. Sneed Middle (math 16% / reading 35%, grade F, #162 of 229 statewide, top 71%, 693 students, 94% FRL); West Florence High (math 57% / reading 88%, grade B+, #46 of 196 statewide, top 24%, 1,807 students, 65% FRL) — zoned schools average 86% FRL vs 57% district-wide (29 pts higher); higher-poverty schools than district average — tighter screening recommended.
- Market conditions: Rents rising fast (+7.0%/yr); 183 active listings in the ZIP; 657 units permitted in Florence County in 2024 (40 in 5+ unit buildings).
- This rent runs 31% of the median local income ($67k/yr) — at the standard rent-burdened threshold; future hikes will face affordability resistance.
Forward outlook
- Local home prices are declining (-3.0%/yr); year-one equity from $1k of loan paydown is wiped out by about $6k of value loss. Plan a longer hold.
Negotiation context
- It's been on market 321 days — a 12% lower offer ($179k) is reasonable based on typical stale-listing flexibility.
- 2 sale attempts with the ask held roughly flat each time — persistent listings suggest the price (not the market) is what's stuck; bring a comps-based counter.
Risks & watch-outs
- Climate carrying-cost: severe wind risk, 80% chance of damaging wind over 30y; major wildfire risk; extreme-heat days projected 7→16/yr by 2055 (HVAC capex compounding) — expect insurance premiums to compound above CPI over the hold.
Questions for the listing agent
- What do current leases actually rent for vs. the listed asking? Can we see a recent rent roll and the last 12 months of T-12 income?
- It's been on market 321 days. Have you received any prior offers? Is the seller open to a 15% concession, seller financing, or rate buy-down credit?
- Why hasn't it sold? Are there any deal-killer items the seller is aware of (foundation, flood, title, zoning, code violations)?
- Is there a deadline driving the sale (1031 exchange, divorce, estate, relocation)? That informs how much negotiation room exists.
- Crime grade is F in this area — have there been break-ins, vandalism, or insurance claims at this property in the last 3 years? What carrier currently insures it and at what premium?
- The area grade is low — what's the realistic commute time and amenity access for the typical tenant pool here? Any planned neighborhood developments (good or bad) we should know about?
- What's the average days-on-market for RENTAL listings here right now (not sales)? A rising rental-DOM trend means longer vacancies and softer asking-rent achievability than the comps imply.
- What's the recent tenant-quality profile in this submarket — average credit score on applications, eviction rate, late-payment / NSF rate, and stable-employment percentage? A property-management company in the area should have these aggregated.
- How much new for-sale + rental construction is in the pipeline within 1–3 miles? Heavy new supply typically softens prices + rents 12–24 months out; constrained supply supports both.
Investment metrics
- 1% rule
- 0.85% ✗
- Cap rate
- 6.09%
- Cash-on-cash
- -0.74%
- DSCR
- 0.97
- GRM
- 9.8
CMA / ARV
No comps found within radius.
Projected returns pro-forma
-3.0% appreciation · 6.97% rent growth · sell at horizon
- IRR
- -13.2%
- Equity multiple
- 0.51×
- Total profit
- $-27,913
- Equity at exit
- $30,268
- IRR
- 1.1%
- Equity multiple
- 1.09×
- Total profit
- $4,950
- Equity at exit
- $17,552
Cash invested: $56,840 (down + closing). Projections, not guarantees.
Landlord ↔ Tenant lean methodology
- Overall (STATE)
- 90 Strongly Landlord-Friendly
- State South Carolina
- 90 Strongly Landlord-Friendly · R+6
- County
- — inherits STATE
- City
- — inherits STATE
ZIP-level market 29505
- Rents YoY
- 7.0%
- Active inventory
- 183
- Price-to-rent
- 9.8×
Monthly cashflow live
- Estimated rent
- $1,731 medium interval (Pro) →
- Mortgage (P&I)
- −$1,065
- Tax est. 1.5%
- −$254 /mo · $3,045/yr
- Insurance
- −$85
- HOA
- −$0
- Vacancy / Maint / Mgmt
- −$364
- Net cashflow
- $-35
Break-even live
Sensitivity live
| Price | -10% $105 | -5% $35 | +0% $-35 | +5% $-105 | +10% $-175 |
|---|---|---|---|---|---|
| Rent | -10% $-172 | -5% $-104 | +0% $-35 | +5% $33 | +10% $102 |
| Rate | -1.0pp $67 | -0.5pp $17 | base $-35 | +0.5pp $-88 | +1.0pp $-141 |
UW: 25.0% down · 7.5% · 30yr · 1.5% tax · 5.0% vac · 8.0% maint · 8.0% mgmt
Financing live
Cash to close
- Down payment
- $50,750
- Closing costs
- $6,090
- Reserves months
- —
- Total cash needed
- —
Loan-product check · same deal, 3 products live
Conventional
25% down · 7.5% · 30yr
- Down + closing
- —
- Monthly P&I
- —
- Monthly cashflow
- —
- DSCR
- —
- Eligible?
- —
Personal DTI + credit; lowest rate.
DSCR
20% down · 8.5% · 30yr
- Down + closing
- —
- Monthly P&I
- —
- Monthly cashflow
- —
- DSCR
- —
- Eligible?
- —
No personal income docs; deal must DSCR.
Hard money
10% down · 12.0% · 12mo
- Down + closing
- —
- Monthly P&I
- —
- Monthly cashflow
- —
- DSCR
- —
- Eligible?
- —
Short-term bridge; refi at stabilization.
Listing history 10 events
-
2026-06-08days on market $203,000 Active 321 DOM
-
2026-06-07days on market $203,000 Active 320 DOM
-
2026-06-05days on market $203,000 Active 317 DOM
-
2026-06-02days on market $203,000 Active 315 DOM
-
2026-06-01days on market $203,000 Active 314 DOM
-
2026-05-31days on market $203,000 Active 313 DOM
-
2026-05-30days on market $203,000 Active 312 DOM
-
2025-10-02status Active
-
2025-08-02historical Active Under Contract
-
2025-07-22$203,000 Active
ⓘ Source: listings_history table (triggers on properties + properties_extension) + one-shot
backfill from property_details.listing_events for pre-trigger history.
Climate risk First Street
- Flood 1/10 Low FEMA zone X (unshaded) · 0% chance over 30 yrs
- Wildfire 6/10 Major
- Heat 7/10 Severe 7 d/yr ≥109°F today · 16 d/yr by 30 yrs out
- Wind 8/10 Severe 80% chance of damaging wind over 30 yrs
- Air quality 1/10 Low 0 unhealthy d/yr today · 0 by 30 yrs out
Nearby sold comps map
Loading sold comps map…
Walkable amenities ~0.75 mi
Loading nearby amenities…
Taxation est. · year 1
- Rental income
- $20,776
- − Mortgage interest
- −$11,371
- − Property taxes
- −$3,045
- − Insurance
- −$1,015
- − Repairs & maintenance
- −$1,662
- − Management
- −$1,662
- − Depreciation
- −$5,905
- Taxable loss
- −$3,885
- Est. tax savings @ 24.0%
- +$932
- After-tax cash flow
- $511/yr
For passive investors: Depreciation is non-cash, so a rental often shows a tax loss while cash-flowing — sheltering income. Rental losses are passive: they offset passive income freely, and up to $25,000/yr can offset ordinary (W-2) income if you actively participate and your MAGI is under $100k (phasing out to $0 by $150k); unused losses carry forward. On sale, claimed depreciation is recaptured at up to 25%, and gains may owe capital-gains tax (a 1031 exchange can defer both). Figures are a year-1 estimate at your 24.0% rate — not tax advice; consult a CPA.
Schools (NCES district)
- District
- Florence 01
- NCES district ID
- 4502130
- Math proficiency
- 29% ▼ -10.00%
- Reading proficiency
- 47% ▬ 0.00%
- Median HH income
- $45,782
- Composite
- 32.36/100
- National rank
- #5737
- State rank
- #34 of 80 in SC
Livability — Florence
- Score
- 62/100
- State rank
- #196
- US rank
- #17076
Category grades
Schools grade is shown separately in the Schools card above.
Census & demographics
- County
- Florence County · 93,345 people
- City population
- 93,345
- Metro
- Florence, SC
- Population (ZIP)
- 23,895
- Household income
- $67,343
- Rent vs Own
- Severe rent burden
- 559.0
Population outlook (Florence County) Hauer SSP2
- Today (2025)
- 141,714 people
- By 2030
- 142,121 · +0.3%
- By 2040
- 141,344 · -0.3%
- By 2050
- 139,478 · -1.6%
- By 2075
- 132,275 · -6.7%
- By 2100
- 118,374 · -16.5%
Race, ethnicity, and origin ACS 2023
- Neighborhood character
- Diverse neighborhood (Simpson 0.57)
- Race & ethnicity
- White 53% Black 38% Hispanic / Latino 5% Two or more races 3% Asian 1%
- Common ancestry
- Slovak 2% Lithuanian 1% Serbian 1%
- Foreign-born
- 3% · Canada, China
- Languages at home
- 96% English-only · Spanish 2% Other Indo-European 1%
Political lean MEDSL · Florence
- 2024 margin
- Lean R (+8.0) · D 45.3% · R 53.3% · Other 1.3%
- 2008→2024 swing
- -4.8pp toward R · 2008: -3.2pp · 2024: -8.0pp
- All cycles
- 2024: R+8.0 2020: R+2.3 2016: R+5.0 2012: R+0.5 2008: R+3.2
Not yet ingested
- Civics
- —
Market trends
- HPI YoY
- ▼ -138.13%
- Current HPI
- 177.9352
- Rent YoY
- ▲ 6.97%
- Metro
- Florence, SC
- State GDP YoY
- ▲ 4.51%
- F500 in state
- 2
Industry mix (Fortune 500 HQ in SC)
| Industry | F500 HQs | Revenue |
|---|---|---|
| Packaging | 1 | $7B |
|
||
Price history
3 events — show timeline
- 2025-10-02 Relisted — RAGPD
- 2025-08-02 Contingent — RAGPD
- 2025-07-22 Listed $203,000 RAGPD
Cash-flow waterfall
monthlySold comps — $/sqft
last 12 mo · ≤1 miLoading sold comps…