3720 N Pine Island Rd · Sunrise, FL
Flood risk No data
- FEMA flood zone
- —
- Chance of flooding over 30 yrs
- —
- Est. flood insurance / yr
- —
Fire risk No data
- Est. fire insurance / yr
- —
Heat risk No data
- Hot days now (above threshold)
- —
- Hot days in 30 yrs
- —
Wind risk No data
- Chance of severe wind over 30 yrs
- —
Air-quality risk No data
- Unhealthy air days now
- —
- Unhealthy air days in 30 yrs
- —
Risk factors via First Street. Map © Google.
Why this score? — see what drove the C- grade
The composite is a weighted blend of 9 inputs, each scored 0–100. Each bar is that input's sub-score; the figure is the points it added to the 100-point composite (weight × sub-score).
- Cash flow +15.5/30.0
- 1% rule +10.0/10.0
- ARV discount +7.5/15.0
- DSCR +4.8/10.0
- Livability +4.2/5.0
- Schools +4.1/10.0
- Rent growth +2.7/5.0
- Condition / age +2.5/5.0
- Appreciation +0.0/10.0
$130,000
🖨 Deal sheet 📄 Offer letter ✓ Due diligence
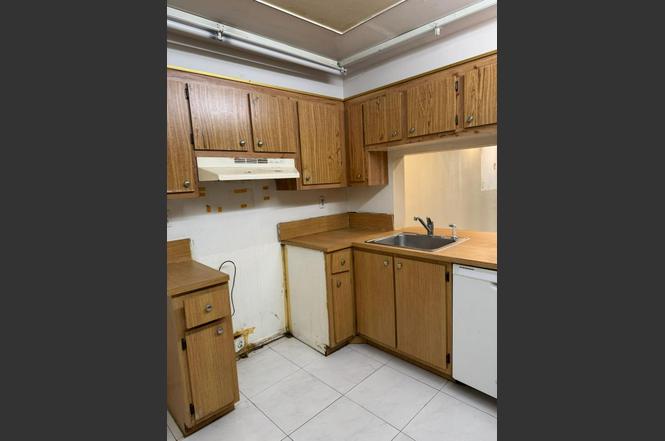
Listing remarks
2/1 Handyman special. If you have the time and talent I don't you can make this a great home for a great price. Near everything, assigned parking, laundry room on each floor, additional storage compartment, community pool, clubhouse. Just needs some appliances, updating and TLC.
Key facts
- Clubhouse
- Community pool
- Laundry room
Tags
Neighborhood map
What this means for you Summary
Snapshot
- This is a 2-bed/1.0-bath condo listed at $130k.
Deal economics
- At list price, monthly cash flow is $53 ($640/yr) — positive.
- The deal already cash-flows at list — no discount required.
- Meets the 1% rule at list price ($2k rent vs $130k).
- Recommended offer: $118k (9.0% below list) — sets the bar for market timing.
- Cap rate 6.8% vs local median 4.9% in Sunrise — top-decile yield for the area; either an underpriced asset or a hidden risk that comps aren't pricing in. Stress-test before assuming the spread holds.
Location & tenants
- Location reads 83/100 on livability (#56 in FL, #986 nationally) — a professional / high-income tenant draw. Strengths: commute A+, housing A+, health & safety A+; Watch: employment C-, amenities F.
- Broward (suburban): math 42% / reading 53% proficiency, ranked #46 of 73 in FL (top 63%) — families likely to look elsewhere, expect single-tenant / working-renter base with shorter leases.
- Market conditions: Rents flat; 189 active listings in the ZIP; 40 comparable units currently listed for rent nearby; rentals at typical pace (median 24d on market — plan ~3-4 weeks tenant-placement turnaround); solid renter incomes; 2,111 units permitted in Broward County in 2024 (1,265 in 5+ unit buildings).
- This rent runs 32% of the median local income ($77k/yr) — at the standard rent-burdened threshold; future hikes will face affordability resistance.
Forward outlook
- Local home prices are declining (-3.0%/yr); year-one equity from $899 of loan paydown is wiped out by about $4k of value loss. Plan a longer hold.
- Broward County population projected at +34% by 2050 — long-run rental-demand tailwind backs the buy-and-hold thesis.
Negotiation context
- It's been on market 101 days — a 9% lower offer ($118k) is reasonable based on typical stale-listing flexibility.
- 4 sale attempts; this cycle's ask is 8025% above the opening price — seller raised mid-cycle; expect resistance to lowballs.
Risks & watch-outs
- Watch-outs: HOA is 33% of rent.
Questions for the listing agent
- It's been on market 101 days. Have you received any prior offers? Is the seller open to a 9% concession, seller financing, or rate buy-down credit?
- What does the HOA fee cover, when was the last increase, and are there any pending special assessments or reserve-fund shortfalls?
- Any open or pending special assessments — roof, HVAC, plumbing, elevator, façade? What's the per-unit balance and payoff schedule, and is the seller paying it off at close or rolling it to the buyer?
- Why hasn't it sold? Are there any deal-killer items the seller is aware of (foundation, flood, title, zoning, code violations)?
- Is there a deadline driving the sale (1031 exchange, divorce, estate, relocation)? That informs how much negotiation room exists.
- What's the average days-on-market for RENTAL listings here right now (not sales)? A rising rental-DOM trend means longer vacancies and softer asking-rent achievability than the comps imply.
- What's the recent tenant-quality profile in this submarket — average credit score on applications, eviction rate, late-payment / NSF rate, and stable-employment percentage? A property-management company in the area should have these aggregated.
- How much new apartment / multifamily construction is in the pipeline within 1–3 miles? Heavy new supply (>2% of stock underway) typically softens rents 12–24 months out; light construction supports rent growth.
Investment metrics
- 1% rule
- 1.60% ✓
- Cap rate
- 6.79%
- Cash-on-cash
- 1.76%
- DSCR
- 1.08
- GRM
- 5.2
CMA / ARV
No comps found within radius.
Projected returns pro-forma
-3.0% appreciation · 0.9% rent growth · sell at horizon
- IRR
- -17.3%
- Equity multiple
- 0.41×
- Total profit
- $-21,525
- Equity at exit
- $19,383
- IRR
- -17.5%
- Equity multiple
- 0.19×
- Total profit
- $-29,486
- Equity at exit
- $11,240
Cash invested: $36,400 (down + closing). Projections, not guarantees.
Landlord ↔ Tenant lean methodology
- Overall (STATE)
- 87 Strongly Landlord-Friendly
- State Florida
- 87 Strongly Landlord-Friendly · R+3
- County
- — inherits STATE
- City
- — inherits STATE
ZIP-level market 33351
- Rents YoY
- 0.9%
- Active inventory
- 189
- Price-to-rent
- 5.2×
Monthly cashflow live
- Estimated rent
- $2,086 high interval (Pro) →
- Mortgage (P&I)
- −$682
- Tax est. 1.5%
- −$162 /mo · $1,950/yr
- Insurance
- −$54
- HOA est. from 3 same-building comps
- −$696
- Vacancy / Maint / Mgmt
- −$438
- Net cashflow
- $53
Break-even live
UW: 25.0% down · 7.5% · 30yr · 1.5% tax · 5.0% vac · 8.0% maint · 8.0% mgmt
Financing live
Cash to close
- Down payment
- $32,500
- Closing costs
- $3,900
- Reserves months
- —
- Total cash needed
- —
Loan-product check · same deal, 3 products live
Conventional
25% down · 7.5% · 30yr
- Down + closing
- —
- Monthly P&I
- —
- Monthly cashflow
- —
- DSCR
- —
- Eligible?
- —
Personal DTI + credit; lowest rate.
DSCR
20% down · 8.5% · 30yr
- Down + closing
- —
- Monthly P&I
- —
- Monthly cashflow
- —
- DSCR
- —
- Eligible?
- —
No personal income docs; deal must DSCR.
Hard money
10% down · 12.0% · 12mo
- Down + closing
- —
- Monthly P&I
- —
- Monthly cashflow
- —
- DSCR
- —
- Eligible?
- —
Short-term bridge; refi at stabilization.
Rent comps 40 comps
| Address | Beds | Baths | Sqft | Rent | $/sqft | DOM | Units | Dist |
|---|---|---|---|---|---|---|---|---|
| 3730 N Pine Island Rd Sunrise, FL | 2.0 | 1.0 | 800 | $1,899 | $2.37 | 22d | 1 | 0.06mi |
| 8798 NW 38th St Sunrise, FL | 1.0–2.0 | 1.0–2.0 | 893 | $2,615 | $2.93 | 7d | 1 | 0.07mi |
| 3825 NW 90th Ave #3825 Sunrise, FL | 2.0 | 1.0 | 865 | $2,000 | $2.31 | 2d | 1 | 0.16mi |
| 3825 NW 90th Ave #3825 Sunrise, FL | 2.0 | 1.0 | 865 | $2,000 | $2.31 | 24d | 1 | 0.16mi |
| 4001 N Pine Island Rd Sunrise, FL | 1.0–3.0 | 1.0–2.0 | 1002 | $2,293 | $2.29 | 1d | 5 | 0.16mi |
| 3710 N Pine Island Rd #122 Sunrise, FL | 2.0 | 2.0 | 989 | $2,095 | $2.12 | 20d | 1 | 0.16mi |
| 3935 NW 87th Ave Sunrise, FL | 1.0 | 1.0 | 595 | $1,600 | $2.69 | 24d | 1 | 0.19mi |
| 8753 NW 39th St #8753 Sunrise, FL | 2.0 | 2.0 | 900 | $2,300 | $2.56 | 24d | 1 | 0.20mi |
| 8793 NW 39th St Sunrise, FL | 2.0 | 1.0 | 793 | $1,800 | $2.27 | 14d | 1 | 0.20mi |
| 8775 NW 39th St #8775 Sunrise, FL | 2.0 | 1.0 | 731 | $1,845 | $2.52 | 13d | 1 | 0.20mi |
| 4028 NW 87th Ave #4028 Sunrise, FL | 1.0 | 1.0 | 595 | $1,700 | $2.86 | 24d | 1 | 0.20mi |
| 3973 NW 87th Ave #3973 Sunrise, FL | 2.0 | 1.0 | 731 | $1,899 | $2.60 | 24d | 1 | 0.20mi |
| 4072 NW 87th Ave Unit 4072 Sunrise, FL | 1.0 | 1.0 | 595 | $1,690 | $2.84 | 16d | 1 | 0.20mi |
| 4071 NW 87th Ave Sunrise, FL | 1.0 | 1.0 | 595 | $1,699 | $2.86 | 24d | 1 | 0.20mi |
| 3968 NW 87th Ave #3968 Sunrise, FL | 1.0 | 1.0 | 595 | $1,625 | $2.73 | 7d | 1 | 0.21mi |
| 3968 NW 87th Ave #3968 Sunrise, FL | 1.0 | 1.0 | 595 | $1,625 | $2.73 | 24d | 1 | 0.21mi |
| 3432 NW 86th Way Unit D204 Sunrise, FL | 2.0 | 2.0 | 1040 | $1,900 | $1.83 | 24d | 1 | 0.22mi |
| 3551 NW 85th Way Sunrise, FL | 1.0–3.0 | 1.0–2.0 | 1247 | $2,364 | $1.90 | 3d | 23 | 0.22mi |
| 4044 NW 87th Ave #4044 Sunrise, FL | 1.0 | 1.0 | 630 | $1,649 | $2.62 | 24d | 1 | 0.25mi |
| 8601 NW 34th Pl Apt A102 Sunrise, FL | 2.0 | 2.0 | 1080 | $2,200 | $2.04 | 24d | 1 | 0.27mi |
| 3776 NW 91st Ln #3776 Sunrise, FL | 2.0 | 2.0 | 886 | $2,000 | $2.26 | 24d | 1 | 0.27mi |
| 4096 N Pine Island Rd #2102 Sunrise, FL | 1.0 | 1.0 | 595 | $1,625 | $2.73 | 24d | 1 | 0.27mi |
| 3624 NW 91st Ln #3624 Sunrise, FL | 2.0 | 2.0 | 886 | $2,000 | $2.26 | 4d | 1 | 0.29mi |
| 3562 NW 91st Ln #3562 Sunrise, FL | 2.0 | 2.0 | 886 | $1,900 | $2.14 | 24d | 1 | 0.29mi |
| 3598 NW 91st Ln #3598 Sunrise, FL | 2.0 | 2.0 | 886 | $1,895 | $2.14 | 24d | 1 | 0.30mi |
| 3831 NW 84th Ave Unit 1E Sunrise, FL | 1.0 | 1.5 | 990 | $1,700 | $1.72 | 24d | 1 | 0.30mi |
| 8445 Springtree Dr Unit 404B Sunrise, FL | 1.0 | 1.5 | 1100 | $1,750 | $1.59 | 24d | 1 | 0.33mi |
| 4108 N Pine Island Rd Sunrise, FL | 2.0 | 2.0 | 1105 | $2,465 | $2.23 | 3d | 1 | 0.33mi |
| 4108 N Pine Island Rd Sunrise, FL | 2.0 | 2.0 | 1026 | $2,420 | $2.36 | 12d | 1 | 0.33mi |
| 4108 N Pine Island Rd Sunrise, FL | 1.0 | 2.0 | 869 | $2,195 | $2.53 | 15d | 1 | 0.33mi |
| 4108 N Pine Island Rd Sunrise, FL | 2.0 | 2.0 | 1105 | $2,325 | $2.10 | 24d | 1 | 0.33mi |
| 8894 NW 44th St Sunrise, FL | 1.0–3.0 | 1.0–2.0 | 1040 | $2,703 | $2.60 | 24d | 1 | 0.35mi |
| 3686 NW 83rd Ln #3686 Sunrise, FL | 2.0 | 2.0 | 849 | $2,350 | $2.77 | 22d | 1 | 0.37mi |
| 8249 Fairway Rd Sunrise, FL | 2.0 | 2.5 | 992 | $2,200 | $2.22 | 24d | 1 | 0.43mi |
| 3648 NW 83rd Ln Sunrise, FL | 2.0 | 1.0 | 987 | $2,100 | $2.13 | 13d | 1 | 0.45mi |
| 3648 NW 83rd Ln Sunrise, FL | 2.0 | 1.0 | 885 | $2,000 | $2.26 | 24d | 1 | 0.45mi |
| #9893 Fort Lauderdale, FL | 2.0 | 2.0 | 986 | $1,975 | $2.00 | 24d | 1 | 0.45mi |
| #9992 Fort Lauderdale, FL | 2.0 | 2.0 | 986 | $2,100 | $2.13 | 24d | 1 | 0.45mi |
| 8327 Fairway Rd #8327 Sunrise, FL | 2.0 | 2.5 | 1028 | $2,500 | $2.43 | 7d | 1 | 0.45mi |
| 8325 Fairway Rd Unit N Sunrise, FL | 2.0 | 2.5 | 1028 | $2,500 | $2.43 | 24d | 1 | 0.45mi |
HOA detail condo
- Monthly dues
- $0 · $0/yr
- Likely covers
- poolparking
- Assessments
- None detected in remarks — confirm with the listing agent.
Listing history 18 events
-
2026-06-18days on market $130,000 Active 101 DOM
-
2026-06-17days on market $130,000 Active 100 DOM
-
2026-06-16days on market $130,000 Active 99 DOM
-
2026-06-15days on market $130,000 Active 98 DOM
-
2026-06-13days on market $130,000 Active 96 DOM
-
2026-06-09days on market $130,000 Active 92 DOM
-
2026-06-07days on market $130,000 Active 90 DOM
-
2026-06-04days on market $130,000 Active 87 DOM
-
2026-06-03days on market $130,000 Active 86 DOM
-
2026-06-02days on market $130,000 Active 85 DOM
-
2026-06-01days on market $130,000 Active 84 DOM
-
2026-05-31days on market $130,000 Active 83 DOM
-
2026-04-03historical $1,600
-
2026-03-31$1,600
-
2026-03-14$2,300
-
2026-03-09$130,000 Active
-
2026-01-01historical $2,300
-
2025-11-24$2,300
ⓘ Source: listings_history table (triggers on properties + properties_extension) + one-shot
backfill from property_details.listing_events for pre-trigger history.
Nearby sold comps map
Loading sold comps map…
Walkable amenities ~0.75 mi
Loading nearby amenities…
Taxation est. · year 1
- Rental income
- $25,029
- − Mortgage interest
- −$7,282
- − Property taxes
- −$1,950
- − Insurance
- −$650
- − Repairs & maintenance
- −$2,002
- − Management
- −$2,002
- − HOA
- −$8,352
- − Depreciation
- −$3,782
- Taxable loss
- −$991
- Est. tax savings @ 24.0%
- +$238
- After-tax cash flow
- $878/yr
For passive investors: Depreciation is non-cash, so a rental often shows a tax loss while cash-flowing — sheltering income. Rental losses are passive: they offset passive income freely, and up to $25,000/yr can offset ordinary (W-2) income if you actively participate and your MAGI is under $100k (phasing out to $0 by $150k); unused losses carry forward. On sale, claimed depreciation is recaptured at up to 25%, and gains may owe capital-gains tax (a 1031 exchange can defer both). Figures are a year-1 estimate at your 24.0% rate — not tax advice; consult a CPA.
Schools (NCES district)
- District
- Broward
- NCES district ID
- 1200180
- Math proficiency
- 42% ▼ -18.00%
- Reading proficiency
- 53% ▼ -5.00%
- Median HH income
- $52,139
- Composite
- 40.88/100
- National rank
- #3621
- State rank
- #46 of 73 in FL
Livability — Sunrise
- Score
- 83/100
- State rank
- #56
- US rank
- #986
Category grades
Schools grade is shown separately in the Schools card above.
Census & demographics
- Census place
- Sunrise, FL
- County
- Broward County · 1,963,430 people
- City population
- 77,492
- Metro
- Miami-Fort Lauderdale-Pompano Beach, FL
- Population (ZIP)
- 36,364
- Household income
- $77,363
- Rent vs Own
- Severe rent burden
- 1753.0
Population outlook (Broward County) Hauer SSP2
- Today (2025)
- 2,207,033 people
- By 2030
- 2,360,704 · +7.0%
- By 2040
- 2,661,208 · +20.6%
- By 2050
- 2,946,698 · +33.5%
- By 2075
- 3,602,273 · +63.2%
- By 2100
- 3,970,984 · +79.9%
Race, ethnicity, and origin ACS 2023
- Neighborhood character
- Highly diverse neighborhood (Simpson 0.70)
- Race & ethnicity
- Black 38% Hispanic / Latino 32% White 21% Two or more races 19% Asian 5%
- Hispanic origin (detail)
- Puerto Rican 5% Cuban 4% Dominican 1%
- Common ancestry
- Hispanic 7% Romanian 1% Scotch-Irish 1%
- Foreign-born
- 40% · Canada, Jamaica, Dominican Republic
- Languages at home
- 57% English-only · Spanish 29% French/Haitian/Cajun 6% Other Indo-European 4%
Political lean MEDSL · Broward
- 2024 margin
- D (+17.0) · D 58.0% · R 41.0%
- 2008→2024 swing
- -17.8pp toward R · 2008: 34.7pp · 2024: 17.0pp
- All cycles
- 2024: D+17.0 2020: D+29.8 2016: D+35.0 2012: D+34.9 2008: D+34.7
Not yet ingested
- Civics
- —
Market trends
- HPI YoY
- ▼ -238.70%
- Current HPI
- 395.4292
- Rent YoY
- ▲ 0.90%
- Metro
- Miami-Fort Lauderdale-Pompano Beach, FL
- State GDP YoY
- ▲ 3.28%
- F500 in state
- 36
Industry mix (Fortune 500 HQ in FL)
| Industry | F500 HQs | Revenue |
|---|---|---|
| Industrial Technology | 2 | $29B |
|
||
| Insurance | 2 | $17B |
|
||
| Retail | 1 | $60B |
|
||
| Technology Distribution | 1 | $58B |
|
||
| Homebuilding | 1 | $35B |
|
||
| Technology Manufacturing | 1 | $35B |
|
||
Price history
-30.4% since first listed6 events — show timeline
- 2026-04-03 Rental Removed $1,600 SHOWMOJO
- 2026-03-31 Listed for Rent $1,600 SHOWMOJO
- 2026-03-14 Listed for Rent $2,300 SHOWMOJO
- 2026-03-09 Listed $130,000 ForSaleByOwner.com
- 2026-01-01 Rental Removed $2,300 SHOWMOJO
- 2025-11-24 Listed for Rent $2,300 SHOWMOJO
Cash-flow waterfall
monthlySold comps — $/sqft
last 12 mo · ≤1 miLoading sold comps…