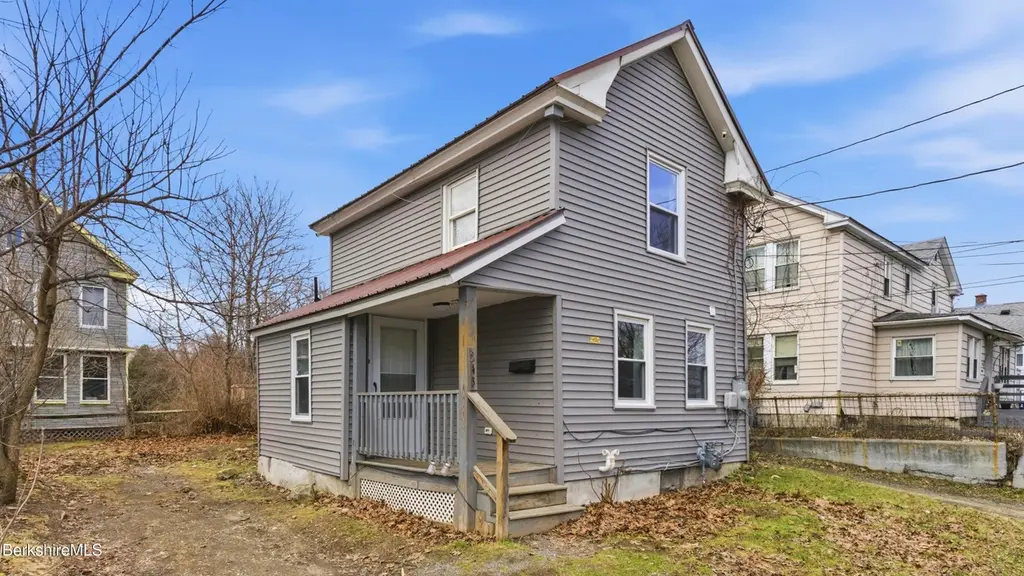
243 Robbins Ave · Pittsfield, MA
Flood risk 1/10 · Minimal
- FEMA flood zone
- X
- Chance of flooding over 30 yrs
- 0.0%
- Est. flood insurance / yr
- $473 – $860
Fire risk 3/10 · Minor
- Est. fire insurance / yr
- $915 – $1,699
Heat risk 2/10 · Minimal
- Hot days now (above 92°F)
- 7 days/yr
- Hot days in 30 yrs
- 16 days/yr
Wind risk 4/10 · Minor
- Chance of severe wind over 30 yrs
- 9.0%
Air-quality risk 2/10 · Minimal
- Unhealthy air days now
- 1 days/yr
- Unhealthy air days in 30 yrs
- 1 days/yr
Risk factors via First Street. Map © Google.
Why this score? — see what drove the C- grade
The composite is a weighted blend of 9 inputs, each scored 0–100. Each bar is that input's sub-score; the figure is the points it added to the 100-point composite (weight × sub-score).
- Cash flow +15.5/30.0
- ARV discount +15.0/15.0
- DSCR +4.8/10.0
- Rent growth +4.4/5.0
- Livability +3.8/5.0
- 1% rule +3.7/10.0
- Condition / age +2.5/5.0
- Schools +2.3/10.0
- Appreciation +0.0/10.0
$169,900
🖨 Deal sheet 📄 Offer letter ✓ Due diligence
Listing remarks MLS
Completely renovated in 2021, this thoughtfully updated 2-bedroom, 1-bath home offers easy, low-maintenance living with a fresh, modern feel throughout. With 747 square feet of efficiently designed space, every inch has been maximized for comfort and functionality. The interior features updated finishes, an inviting layout, and abundant natural light, creating a warm and welcoming atmosphere. The kitchen and living areas flow seamlessly, making the home feel open yet cozy--perfect for everyday living or entertaining. Ideally located just minutes from downtown Pittsfield and the vibrant Cultural District, you'll enjoy convenient access to local dining, shopping, arts, and entertainment. Whether you're looking for a primary residence or an investment opportunity, this property offers g value and accessibility in a central location.
Key facts
- Updated finishes
- Convenient access
- Central location
Tags
Neighborhood map
What this means for you Summary
Snapshot
- This is a 2-bed/1.0-bath single-family listed at $170k.
Deal economics
- At list price, monthly cash flow is $69 ($825/yr) — positive.
- The deal already cash-flows at list — no discount required.
- To meet the 1% rule (rent ≥ 1% of price), the offer needs to be $148k (13.0% below list).
- Recommended offer: $148k (13.0% below list) — sets the bar for 1% rule.
- Cap rate 6.8% vs local median 3.6% in Pittsfield — top-decile yield for the area; either an underpriced asset or a hidden risk that comps aren't pricing in. Stress-test before assuming the spread holds.
Location & tenants
- Location reads 75/100 on livability (#70 in MA, #3,820 nationally) — a middle-class / working-renter tenant base. Strengths: commute A+, housing A+, health & safety A+; Watch: employment C-, amenities D+, schools D.
- Pittsfield (urban): math 19% / reading 34% proficiency, ranked #272 of 302 in MA (top 90%) — low school quality limits family demand, transient renter base, plan for 1-2y turnover.
- Market conditions: Rents rising fast (+7.7%/yr); 275 active listings in the ZIP; 1 comparable units currently listed for rent nearby; 130 units permitted in Berkshire County in 2024 (10 in 5+ unit buildings).
Forward outlook
- Local home prices are declining (-3.0%/yr); year-one equity from $1k of loan paydown is wiped out by about $5k of value loss. Plan a longer hold.
- Berkshire County population projected at -24% by 2050 — secular population decline; favor cash flow + early exit over multi-decade hold.
Negotiation context
- It's been on market 74 days — a 6% lower offer ($160k) is reasonable based on typical stale-listing flexibility.
- 7 sale attempts since 10y ago; this cycle's ask has dropped $25k (13%) from the opening price — seller is motivated, your offer sets the floor, not the list.
- Current owner paid $16k; list at $170k implies a 962% gain — meaningful room to come down on a strong offer.
Risks & watch-outs
- Watch-outs: built in 1890 — expect roof / HVAC / electrical / plumbing capex.
Questions for the listing agent
- It's been on market 74 days. Have you received any prior offers? Is the seller open to a 13% concession, seller financing, or rate buy-down credit?
- Built in 1890 — when were the roof, HVAC, electrical panel, plumbing, and water heater last replaced?
- Why hasn't it sold? Are there any deal-killer items the seller is aware of (foundation, flood, title, zoning, code violations)?
- Is there a deadline driving the sale (1031 exchange, divorce, estate, relocation)? That informs how much negotiation room exists.
- Schools are D-rated, which usually means shorter tenancies and higher turnover. Who's the typical renter profile here, and what's been the actual vacancy rate?
- Crime grade is D in this area — have there been break-ins, vandalism, or insurance claims at this property in the last 3 years? What carrier currently insures it and at what premium?
- What's the average days-on-market for RENTAL listings here right now (not sales)? A rising rental-DOM trend means longer vacancies and softer asking-rent achievability than the comps imply.
- What's the recent tenant-quality profile in this submarket — average credit score on applications, eviction rate, late-payment / NSF rate, and stable-employment percentage? A property-management company in the area should have these aggregated.
- How much new for-sale + rental construction is in the pipeline within 1–3 miles? Heavy new supply typically softens prices + rents 12–24 months out; constrained supply supports both.
Investment metrics
- 1% rule
- 0.87% ✗
- Cap rate
- 6.78%
- Cash-on-cash
- 1.73%
- DSCR
- 1.08
- GRM
- 9.6
CMA / ARV
- ARV (median comp)
- $222,323
- List price
- $169,900
- Delta
- -23.58%
- Verdict
- UNDERPRICED
- Comps
- 18 within 1.0 mi
Show comp detail 2 sales within ~0.75 mi
| Address | Dist | Beds/Ba | Sqft | Sold | Price | $/sf | Match |
|---|---|---|---|---|---|---|---|
| 20 Crystal St | 0.49mi | 1/1.0 (-1) | 720 (-4%) | 2mo | $199,900 | $278 | 64 |
| 36 Montgomery Ave | 0.70mi | 2/1.0 | 768 (+3%) | 12mo | $225,000 | $293 | 53 |
Match score weights: distance 35% · size 25% · config 20% · recency 20%. Top-matched comps best support the ARV.
Projected returns pro-forma
-3.0% appreciation · 7.72% rent growth · sell at horizon
- IRR
- -8.7%
- Equity multiple
- 0.67×
- Total profit
- $-15,819
- Equity at exit
- $25,333
- IRR
- 5.9%
- Equity multiple
- 1.53×
- Total profit
- $25,049
- Equity at exit
- $14,690
Cash invested: $47,572 (down + closing). Projections, not guarantees.
Landlord ↔ Tenant lean methodology
- Overall (STATE)
- 20 Strongly Tenant-Friendly
- State Massachusetts
- 20 Strongly Tenant-Friendly · D+15
- County
- — inherits STATE
- City
- — inherits STATE
ZIP-level market 01201
- Rents YoY
- 7.7%
- Active inventory
- 275
- Price-to-rent
- 9.6×
Monthly cashflow live
- Estimated rent
- $1,478 medium interval (Pro) →
- Mortgage (P&I)
- −$891
- Tax from tax record
- −$137 /mo · $1,649/yr
- Insurance
- −$71
- HOA
- −$0
- Vacancy / Maint / Mgmt
- −$310
- Net cashflow
- $69
Break-even live
UW: 25.0% down · 7.5% · 30yr · 1.5% tax · 5.0% vac · 8.0% maint · 8.0% mgmt
Financing live
Cash to close
- Down payment
- $42,475
- Closing costs
- $5,097
- Reserves months
- —
- Total cash needed
- —
Loan-product check · same deal, 3 products live
Conventional
25% down · 7.5% · 30yr
- Down + closing
- —
- Monthly P&I
- —
- Monthly cashflow
- —
- DSCR
- —
- Eligible?
- —
Personal DTI + credit; lowest rate.
DSCR
20% down · 8.5% · 30yr
- Down + closing
- —
- Monthly P&I
- —
- Monthly cashflow
- —
- DSCR
- —
- Eligible?
- —
No personal income docs; deal must DSCR.
Hard money
10% down · 12.0% · 12mo
- Down + closing
- —
- Monthly P&I
- —
- Monthly cashflow
- —
- DSCR
- —
- Eligible?
- —
Short-term bridge; refi at stabilization.
Rent comps 1 comps
| Address | Beds | Baths | Sqft | Rent | $/sqft | DOM | Units | Dist |
|---|---|---|---|---|---|---|---|---|
| 68 Union St Unit 68-3 Pittsfield, MA | 1.0 | 1.0 | 650 | $1,175 | $1.81 | 43d | 1 | 0.36mi |
Listing history 29 events
-
2026-06-19days on market $169,900 Active 74 DOM
-
2026-06-18days on market $169,900 Active 73 DOM
-
2026-06-17days on market $169,900 Active 72 DOM
-
2026-06-16days on market $169,900 Active 71 DOM
-
2026-06-15days on market $169,900 Active 70 DOM
-
2026-06-14days on market $169,900 Active 68 DOM
-
2026-06-12pricedays on market $169,900 Active 67 DOM
-
2026-06-09days on market $179,900 Active 64 DOM
-
2026-06-08days on market $179,900 Active 63 DOM
-
2026-06-07days on market $179,900 Active 62 DOM
-
2026-06-05days on market $179,900 Active 59 DOM
-
2026-06-02days on market $179,900 Active 57 DOM
-
2026-06-01days on market $179,900 Active 56 DOM
-
2026-05-31days on market $179,900 Active 55 DOM
-
2026-05-30days on market $179,900 Active 54 DOM
-
2026-05-14price $179,900 847-char remark
Show marketing remark (847 chars)
Completely renovated in 2021, this thoughtfully updated 2-bedroom, 1-bath home offers easy, low-maintenance living with a fresh, modern feel throughout. With 747 square feet of efficiently designed space, every inch has been maximized for comfort and functionality. The interior features updated finishes, an inviting layout, and abundant natural light, creating a warm and welcoming atmosphere. The kitchen and living areas flow seamlessly, making the home feel open yet cozy--perfect for everyday living or entertaining. Ideally located just minutes from downtown Pittsfield and the vibrant Cultural District, you'll enjoy convenient access to local dining, shopping, arts, and entertainment. Whether you're looking for a primary residence or an investment opportunity, this property offers g value and accessibility in a central location.
-
2026-04-06$195,000 Active 847-char remark
Show marketing remark (847 chars)
Completely renovated in 2021, this thoughtfully updated 2-bedroom, 1-bath home offers easy, low-maintenance living with a fresh, modern feel throughout. With 747 square feet of efficiently designed space, every inch has been maximized for comfort and functionality. The interior features updated finishes, an inviting layout, and abundant natural light, creating a warm and welcoming atmosphere. The kitchen and living areas flow seamlessly, making the home feel open yet cozy--perfect for everyday living or entertaining. Ideally located just minutes from downtown Pittsfield and the vibrant Cultural District, you'll enjoy convenient access to local dining, shopping, arts, and entertainment. Whether you're looking for a primary residence or an investment opportunity, this property offers g value and accessibility in a central location.
-
2024-07-18historical
-
2024-05-06$124,900 Active
-
2019-11-08soldstatus $16,000
-
2019-03-22historical
-
2019-03-22historical
-
2018-09-23$24,800
-
2018-09-23$29,800
-
2018-04-03$19,800
-
2016-10-18soldstatus $10,000
-
2016-10-18soldstatus $10,000
-
2016-07-07$19,500
-
2016-05-26$19,500
ⓘ Source: listings_history table (triggers on properties + properties_extension) + one-shot
backfill from property_details.listing_events for pre-trigger history.
Tax reassessment forecast MA · Partial reset (capped growth)
- Current annual tax
- $1,649 · $137/mo
- Projected year-2 tax
- $1,869 · $156/mo
- Expected delta
- +$220/yr (+$18/mo · 13.4%)
ⓘ Screening estimate from a state-policy table — verify with the county assessor before closing.
Climate risk First Street
- Flood 1/10 Low FEMA zone X · 0% chance over 30 yrs
- Wildfire 3/10 Moderate
- Heat 2/10 Low 7 d/yr ≥92°F today · 16 d/yr by 30 yrs out
- Wind 4/10 Moderate 9% chance of damaging wind over 30 yrs
- Air quality 2/10 Low 1 unhealthy d/yr today · 1 by 30 yrs out
Nearby sold comps map
Loading sold comps map…
Walkable amenities ~0.75 mi
Loading nearby amenities…
Taxation est. · year 1
- Rental income
- $17,741
- − Mortgage interest
- −$9,517
- − Property taxes
- −$1,649
- − Insurance
- −$850
- − Repairs & maintenance
- −$1,419
- − Management
- −$1,419
- − Depreciation
- −$4,943
- Taxable loss
- −$2,056
- Est. tax savings @ 24.0%
- +$493
- After-tax cash flow
- $1,319/yr
For passive investors: Depreciation is non-cash, so a rental often shows a tax loss while cash-flowing — sheltering income. Rental losses are passive: they offset passive income freely, and up to $25,000/yr can offset ordinary (W-2) income if you actively participate and your MAGI is under $100k (phasing out to $0 by $150k); unused losses carry forward. On sale, claimed depreciation is recaptured at up to 25%, and gains may owe capital-gains tax (a 1031 exchange can defer both). Figures are a year-1 estimate at your 24.0% rate — not tax advice; consult a CPA.
Schools (NCES district)
- District
- Pittsfield
- NCES district ID
- 2509630
- Math proficiency
- 19% ▼ -10.00%
- Reading proficiency
- 34% ▼ -2.00%
- Median HH income
- $44,032
- Composite
- 22.67/100
- National rank
- #8046
- State rank
- #272 of 302 in MA
Livability — Pittsfield
- Score
- 75/100
- State rank
- #70
- US rank
- #3820
Category grades
Schools grade is shown separately in the Schools card above.
Census & demographics
- Census place
- Pittsfield, MA
- County
- Berkshire County · 44,848 people
- City population
- 44,848
- Metro
- Pittsfield, MA
- Population (ZIP)
- 44,848
- Household income
- $71,093
- Rent vs Own
- Severe rent burden
- 1580.0
Population outlook (Berkshire County) Hauer SSP2
- Today (2025)
- 119,723 people
- By 2030
- 114,608 · -4.3%
- By 2040
- 102,806 · -14.1%
- By 2050
- 91,305 · -23.7%
- By 2075
- 71,517 · -40.3%
- By 2100
- 57,988 · -51.6%
Race, ethnicity, and origin ACS 2023
- Neighborhood character
- Predominantly White (78%)
- Race & ethnicity
- White 78% Two or more races 10% Hispanic / Latino 9% Black 5% Asian 1%
- Hispanic origin (detail)
- Puerto Rican 3%
- Common ancestry
- Lithuanian 8% Romanian 6% Slovak 2%
- Foreign-born
- 7% · Canada, Jamaica
- Languages at home
- 90% English-only · Spanish 6% Other Indo-European 1% Russian/Polish/Slavic 1%
Political lean MEDSL · Berkshire
- 2024 margin
- Solid D (+39.9) · D 68.9% · R 29.0% · Other 2.1%
- 2008→2024 swing
- -12.5pp toward R · 2008: 52.4pp · 2024: 39.9pp
- All cycles
- 2024: D+39.9 2020: D+47.1 2016: D+41.5 2012: D+53.7 2008: D+52.4
Not yet ingested
- Civics
- —
Market trends
- HPI YoY
- ▼ -199.88%
- Current HPI
- 283.3421
- Rent YoY
- ▲ 7.72%
- Metro
- Pittsfield, MA
- State GDP YoY
- ▲ 2.28%
- F500 in state
- 38
Industry mix (Fortune 500 HQ in MA)
| Industry | F500 HQs | Revenue |
|---|---|---|
| Technology | 3 | $17B |
|
||
| Insurance | 2 | $84B |
|
||
| Retail | 2 | $76B |
|
||
| Life Sciences | 1 | $43B |
|
||
| Energy Technology | 1 | $31B |
|
||
| Aerospace / Defense | 1 | $18B |
|
||
Price history
+822.6% since first listed14 events — show timeline
- 2026-05-14 Price Changed $179,900 BCMLS
- 2026-04-06 Listed $195,000 BCMLS
- 2024-07-18 Listing Removed — BCMLS
- 2024-05-06 Listed $124,900 BCMLS
- 2019-11-08 Sold (MLS) $16,000 BCMLS
- 2019-03-22 Listing Removed — BCMLS
- 2019-03-22 Listing Removed — BCMLS
- 2018-09-23 Listed $29,800 BCMLS
- 2018-09-23 Listed $24,800 BCMLS
- 2018-04-03 Listed $19,800 BCMLS
- 2016-10-18 Sold (MLS) $10,000 BCMLS
- 2016-10-18 Sold (MLS) $10,000 MLS PIN
- 2016-07-07 Listed $19,500 MLS PIN
- 2016-05-26 Listed $19,500 BCMLS
Property tax history
+3.7%/yrLatest (2023): $1,649 · +13.2% YoY. Source: county tax records.
Cash-flow waterfall
monthlySold comps — $/sqft
last 12 mo · ≤1 miLoading sold comps…