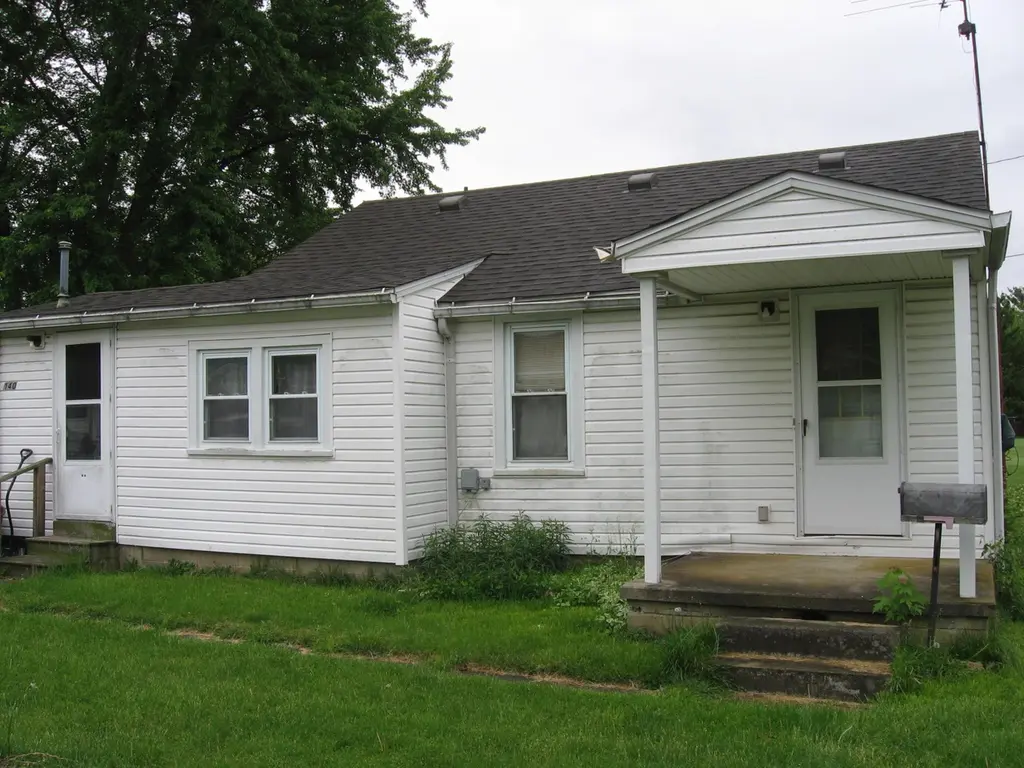
140 E Lewis Ave · Sabina, OH
Flood risk 1/10 · Minimal
- FEMA flood zone
- X (unshaded)
- Chance of flooding over 30 yrs
- 0.0%
- Est. flood insurance / yr
- $507 – $1,088
Fire risk 1/10 · Minimal
- Est. fire insurance / yr
- $713 – $1,323
Heat risk 3/10 · Minor
- Hot days now (above 99°F)
- 7 days/yr
- Hot days in 30 yrs
- 19 days/yr
Wind risk 2/10 · Minimal
- Chance of severe wind over 30 yrs
- 1.0%
Air-quality risk 3/10 · Minor
- Unhealthy air days now
- 2 days/yr
- Unhealthy air days in 30 yrs
- 3 days/yr
Risk factors via First Street. Map © Google.
Why this score? — see what drove the B- grade
The composite is a weighted blend of 9 inputs, each scored 0–100. Each bar is that input's sub-score; the figure is the points it added to the 100-point composite (weight × sub-score).
- Cash flow +30.0/30.0
- 1% rule +10.0/10.0
- DSCR +10.0/10.0
- ARV discount +7.5/15.0
- Schools +3.9/10.0
- Livability +3.2/5.0
- Rent growth +2.5/5.0
- Condition / age +2.5/5.0
- Appreciation +0.0/10.0
$53,500
🖨 Deal sheet 📄 Offer letter ✓ Due diligence
Listing remarks
This property needs some work but with the required attention, it could be a comfortable place to live. An eat-in kitchen with gas range and refrigerator. The two bedrooms have hardwood floors and a ceiling fan in one. The living room offers an open layout with ceiling fan. The house has vinyl windows and vinyl siding. Property to be sold AS-IS.
Key facts
- Vinyl windows
- Ceiling fan
- Open layout
Tags
Property features AI
Exterior
- Utilities: Public water; Public sewer
- Home design: Single-family residence; One story; Built in 1948; No shared/common walls
- Construction: Block foundation
- Exterior features: Outbuilding
Interior
- Bedrooms: 2 main-level bedrooms
- Flooring: Wood flooring; Vinyl flooring
- Bathrooms: 1 full bathroom
- Heating & cooling: Forced air heating; Window unit cooling
- Interior features: Crawl space basement; 654 livable square feet
Neighborhood map
What this means for you Summary
Snapshot
- This is a 2-bed/1.0-bath single-family listed at $54k.
Deal economics
- At list price, monthly cash flow is $284 ($3k/yr) — positive.
- The deal already cash-flows at list — no discount required.
- Meets the 1% rule at list price ($819 rent vs $54k).
- Recommended offer: $52k (3.0% below list) — sets the bar for market timing.
Location & tenants
- Location reads 65/100 on livability (#734 in OH) — a middle-class / working-renter tenant base. Strengths: crime A+, cost of living A+, housing A+; Watch: amenities F, commute F, employment D-.
- East Clinton Local (rural): math 41% / reading 52% proficiency, ranked #489 of 656 in OH (top 74%) — families likely to look elsewhere, expect single-tenant / working-renter base with shorter leases.
- Market conditions: 18 active listings in the ZIP; 119 units permitted in Clinton County in 2024 (0 in 5+ unit buildings).
Forward outlook
- Local home prices are declining (-3.0%/yr); year-one equity from $370 of loan paydown is wiped out by about $2k of value loss. Plan a longer hold.
- Clinton County population projected at -12% by 2050 — secular population decline; favor cash flow + early exit over multi-decade hold.
- At projected returns (-3.0% appreciation + 3.0% rent growth), your $15k cash investment doubles in ~6 years — after that, you're playing with house money.
Negotiation context
- It's been on market 45 days — a 3% lower offer ($52k) is reasonable based on typical stale-listing flexibility.
- 2 sale attempts; this cycle's ask has dropped $32k (37%) from the opening price — seller is motivated, your offer sets the floor, not the list.
- Current owner paid $32k; list at $54k implies a 65% gain — meaningful room to come down on a strong offer.
Risks & watch-outs
- Watch-outs: built in 1948 — expect roof / HVAC / electrical / plumbing capex.
Questions for the listing agent
- It's been on market 45 days. Have you received any prior offers? Is the seller open to a 3% concession, seller financing, or rate buy-down credit?
- Built in 1948 — when were the roof, HVAC, electrical panel, plumbing, and water heater last replaced?
- Is there a deadline driving the sale (1031 exchange, divorce, estate, relocation)? That informs how much negotiation room exists.
- What's the average days-on-market for RENTAL listings here right now (not sales)? A rising rental-DOM trend means longer vacancies and softer asking-rent achievability than the comps imply.
- What's the recent tenant-quality profile in this submarket — average credit score on applications, eviction rate, late-payment / NSF rate, and stable-employment percentage? A property-management company in the area should have these aggregated.
- How much new for-sale + rental construction is in the pipeline within 1–3 miles? Heavy new supply typically softens prices + rents 12–24 months out; constrained supply supports both.
Investment metrics
- 1% rule
- 1.53% ✓
- Cap rate
- 12.65%
- Cash-on-cash
- 22.71%
- DSCR
- 2.01
- GRM
- 5.4
CMA / ARV
- ARV (median comp)
- $135,496
- List price
- $53,500
- Delta
- -60.52%
- Verdict
- UNDERPRICED
- Comps
- 17 within 1.0 mi
Show comp detail 2 sales within ~0.75 mi
| Address | Dist | Beds/Ba | Sqft | Sold | Price | $/sf | Match |
|---|---|---|---|---|---|---|---|
| 285 S Howard St | 0.17mi | 2/1.0 | 720 (+10%) | 2mo | $105,000 | $146 | 73 |
| 48 North St | 0.53mi | 2/1.0 | 672 (+3%) | 15mo | $134,000 | $199 | 58 |
Match score weights: distance 35% · size 25% · config 20% · recency 20%. Top-matched comps best support the ARV.
Projected returns pro-forma
-3.0% appreciation · 3.0% rent growth · sell at horizon
- IRR
- 15.6%
- Equity multiple
- 1.63×
- Total profit
- $9,398
- Equity at exit
- $7,977
- IRR
- 24.3%
- Equity multiple
- 3.10×
- Total profit
- $31,470
- Equity at exit
- $4,626
Cash invested: $14,980 (down + closing). Projections, not guarantees.
Landlord ↔ Tenant lean methodology
- Overall (STATE)
- 73 Landlord-Friendly
- State Ohio
- 73 Landlord-Friendly · R+6
- County
- — inherits STATE
- City
- — inherits STATE
ZIP-level market 45169
- Home prices YoY
- -14.9%
- Active inventory
- 18
- Price-to-rent
- 5.4×
Monthly cashflow live
- Estimated rent
- $819 medium interval (Pro) →
- Mortgage (P&I)
- −$281
- Tax from tax record
- −$60 /mo · $723/yr
- Insurance
- −$22
- HOA
- −$0
- Vacancy / Maint / Mgmt
- −$172
- Net cashflow
- $284
Break-even live
UW: 25.0% down · 7.5% · 30yr · 1.5% tax · 5.0% vac · 8.0% maint · 8.0% mgmt
Financing live
Cash to close
- Down payment
- $13,375
- Closing costs
- $1,605
- Reserves months
- —
- Total cash needed
- —
Loan-product check · same deal, 3 products live
Conventional
25% down · 7.5% · 30yr
- Down + closing
- —
- Monthly P&I
- —
- Monthly cashflow
- —
- DSCR
- —
- Eligible?
- —
Personal DTI + credit; lowest rate.
DSCR
20% down · 8.5% · 30yr
- Down + closing
- —
- Monthly P&I
- —
- Monthly cashflow
- —
- DSCR
- —
- Eligible?
- —
No personal income docs; deal must DSCR.
Hard money
10% down · 12.0% · 12mo
- Down + closing
- —
- Monthly P&I
- —
- Monthly cashflow
- —
- DSCR
- —
- Eligible?
- —
Short-term bridge; refi at stabilization.
Listing history 18 events
-
2026-06-18days on market $53,500 Active 45 DOM
-
2026-06-17days on market $53,500 Active 44 DOM
-
2026-06-16days on market $53,500 Active 43 DOM
-
2026-06-15days on market $53,500 Active 42 DOM
-
2026-06-13days on market $53,500 Active 40 DOM
-
2026-06-12days on market $53,500 Active 39 DOM
-
2026-06-09days on market $53,500 Active 36 DOM
-
2026-06-08days on market $53,500 Active 35 DOM
-
2026-06-08days on market $53,500 Active 34 DOM
-
2026-06-07days on market $53,500 Active 33 DOM
-
2026-06-04days on market $53,500 Active 30 DOM
-
2026-06-02days on market $53,500 Active 29 DOM
-
2026-06-01days on market $53,500 Active 28 DOM
-
2026-05-31days on market $53,500 Active 27 DOM
-
2026-05-15status Active 347-char remark
-
2026-05-08historical Contingent 347-char remark
-
2026-05-04$85,000 Active 347-char remark
-
2001-04-17soldstatus $32,500
ⓘ Source: listings_history table (triggers on properties + properties_extension) + one-shot
backfill from property_details.listing_events for pre-trigger history.
Tax reassessment forecast OH · Partial reset (capped growth)
- Current annual tax
- $723 · $60/mo
- Projected year-2 tax
- $779 · $65/mo
- Expected delta
- +$56/yr (+$5/mo · 7.7%)
ⓘ Screening estimate from a state-policy table — verify with the county assessor before closing.
Climate risk First Street
- Flood 1/10 Low FEMA zone X (unshaded) · 0% chance over 30 yrs
- Wildfire 1/10 Low
- Heat 3/10 Moderate 7 d/yr ≥99°F today · 19 d/yr by 30 yrs out
- Wind 2/10 Low 100% chance of damaging wind over 30 yrs
- Air quality 3/10 Moderate 2 unhealthy d/yr today · 3 by 30 yrs out
Nearby sold comps map
Loading sold comps map…
Walkable amenities ~0.75 mi
Loading nearby amenities…
Taxation est. · year 1
- Rental income
- $9,823
- − Mortgage interest
- −$2,997
- − Property taxes
- −$723
- − Insurance
- −$268
- − Repairs & maintenance
- −$786
- − Management
- −$786
- − Depreciation
- −$1,556
- Taxable income
- $2,707
- Est. tax owed @ 24.0%
- −$650
- After-tax cash flow
- $2,753/yr
For passive investors: Depreciation is non-cash, so a rental often shows a tax loss while cash-flowing — sheltering income. Rental losses are passive: they offset passive income freely, and up to $25,000/yr can offset ordinary (W-2) income if you actively participate and your MAGI is under $100k (phasing out to $0 by $150k); unused losses carry forward. On sale, claimed depreciation is recaptured at up to 25%, and gains may owe capital-gains tax (a 1031 exchange can defer both). Figures are a year-1 estimate at your 24.0% rate — not tax advice; consult a CPA.
Schools (NCES district)
- District
- East Clinton Local
- NCES district ID
- 3904640
- Math proficiency
- 41% ▼ -21.00%
- Reading proficiency
- 52% ▼ -14.00%
- Median HH income
- $45,362
- Composite
- 39.4/100
- National rank
- #3969
- State rank
- #489 of 656 in OH
Livability — Sabina
- Score
- 65/100
- State rank
- #734
- US rank
- #13251
Category grades
Schools grade is shown separately in the Schools card above.
Census & demographics
- Census place
- Sabina, OH
- County
- Clinton · 46,911 people
- Population (ZIP)
- 4,410
- Household income
- $52,061
- Rent vs Own
- Severe rent burden
- 11.8
Population outlook (Clinton County) Hauer SSP2
- Today (2025)
- 41,352 people
- By 2030
- 40,831 · -1.3%
- By 2040
- 39,049 · -5.6%
- By 2050
- 36,408 · -12.0%
- By 2075
- 29,652 · -28.3%
- By 2100
- 20,736 · -49.9%
Race, ethnicity, and origin ACS 2023
- Neighborhood character
- Predominantly White (96%)
- Race & ethnicity
- White 96% Two or more races 3% Hispanic / Latino 2%
- Common ancestry
- Lithuanian 1% Iranian 1% Romanian 1%
- Foreign-born
- 0%
- Languages at home
- 99% English-only · German/W. Germanic 1%
Political lean MEDSL · Clinton
- 2024 margin
- Solid R (+54.6) · D 22.3% · R 76.9%
- 2008→2024 swing
- -24.3pp toward R · 2008: -30.3pp · 2024: -54.6pp
- All cycles
- 2024: R+54.6 2020: R+52.6 2016: R+52.6 2012: R+35.2 2008: R+30.3
Not yet ingested
- Civics
- —
Market trends
- HPI YoY
- ▼ -47.66%
- Current HPI
- 271.7764
- Rent YoY
- —
- Metro
- —
- State GDP YoY
- ▲ 1.98%
- F500 in state
- 48
Industry mix (Fortune 500 HQ in OH)
| Industry | F500 HQs | Revenue |
|---|---|---|
| Insurance | 3 | $145B |
|
||
| Industrial Machinery | 3 | $49B |
|
||
| Financial Services | 3 | $24B |
|
||
| Consumer Goods | 2 | $93B |
|
||
| Aerospace / Defense | 2 | $47B |
|
||
| Utilities | 2 | $33B |
|
||
Price history
+64.6% since first listed5 events — show timeline
- 2026-05-26 Price Changed $53,500 CBRMLS
- 2026-05-15 Relisted — CBRMLS
- 2026-05-08 Contingent — CBRMLS
- 2026-05-04 Listed $85,000 CBRMLS
- 2001-04-17 Sold (Public Records) $32,500 Public Records
Property tax history
+5.7%/yrLatest (2025): $723 · -4.2% YoY. Source: county tax records.
Cash-flow waterfall
monthlySold comps — $/sqft
last 12 mo · ≤1 miLoading sold comps…