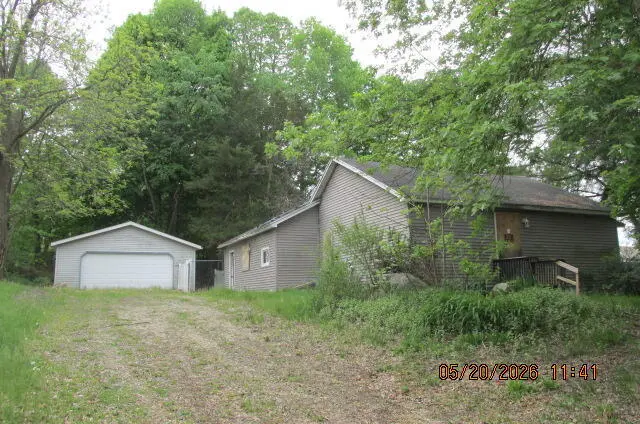
128 W Colfax St · Hastings, MI
Flood risk 1/10 · Minimal
- FEMA flood zone
- X (unshaded)
- Chance of flooding over 30 yrs
- 0.0%
- Est. flood insurance / yr
- $473 – $860
Fire risk 1/10 · Minimal
- Est. fire insurance / yr
- $784 – $1,456
Heat risk 2/10 · Minimal
- Hot days now (above 98°F)
- 7 days/yr
- Hot days in 30 yrs
- 16 days/yr
Wind risk 2/10 · Minimal
- Chance of severe wind over 30 yrs
- —
Air-quality risk 2/10 · Minimal
- Unhealthy air days now
- 1 days/yr
- Unhealthy air days in 30 yrs
- 1 days/yr
Risk factors via First Street. Map © Google.
Why this score? — see what drove the B- grade
The composite is a weighted blend of 9 inputs, each scored 0–100. Each bar is that input's sub-score; the figure is the points it added to the 100-point composite (weight × sub-score).
- Cash flow +30.0/30.0
- 1% rule +10.0/10.0
- DSCR +10.0/10.0
- ARV discount +7.5/15.0
- Livability +4.0/5.0
- Schools +3.5/10.0
- Rent growth +2.5/5.0
- Condition / age +2.5/5.0
- Appreciation +0.0/10.0
$98,000
🖨 Deal sheet 📄 Offer letter ✓ Due diligence
Listing remarks MLS
This property has been placed in an upcoming event. All bids should be submitted at www. xome.com/auctions (void where prohibited). Please submit any pre-auction offer received through the property details page on Xome.com. Any post-auction offers will need to be submitted directly to the listing agent. All offers will be reviewed and responded to within 3 business days. All properties are subject to a 5% buyer's premium pursuant to the Auction Participation Agreement and Terms & Conditions (minimums will apply). Please contact listing agent for details and commission paid on this property.
Key facts
- 0.4 acre lot
- 2 garage spots
- Built 1930
Property features AI
Exterior
- Parking: Detached 2-car garage
- Home design: Ranch-style single family residence; Residential property
- Construction: Built in 1930; Vinyl siding
- Exterior features: 0.4-acre lot; Public water
Interior
- Bathrooms: 2 full bathrooms
- Heating & cooling: Forced air heating
- Interior features: 8 total rooms; Crawl space basement
Neighborhood map
What this means for you Summary
Snapshot
- This is a 4-bed/2.0-bath single-family listed at $98k.
Deal economics
- At list price, monthly cash flow is $1k ($16k/yr) — positive.
- The deal already cash-flows at list — no discount required.
- Meets the 1% rule at list price ($2k rent vs $98k).
- Recommended offer: $97k (1.5% below list) — sets the bar for market timing.
- Cap rate 22.1% vs local median 4.0% in Hastings — top-decile yield for the area; either an underpriced asset or a hidden risk that comps aren't pricing in. Stress-test before assuming the spread holds.
Location & tenants
- Location reads 79/100 on livability (#95 in MI, #2,201 nationally) — a middle-class / working-renter tenant base. Strengths: amenities A+, cost of living A+, housing A+; Watch: schools C-, employment D, commute F.
- Hastings Area School District (town): math 33% / reading 48% proficiency, ranked #203 of 540 in MI (top 38%) — families likely to look elsewhere, expect single-tenant / working-renter base with shorter leases.
- Market conditions: 136 active listings in the ZIP; 1 comparable units currently listed for rent nearby; 171 units permitted in Barry County in 2024 (0 in 5+ unit buildings).
Forward outlook
- Local home prices are declining (-3.0%/yr); year-one equity from $678 of loan paydown is wiped out by about $3k of value loss. Plan a longer hold.
- Barry County population projected at -11% by 2050 — secular population decline; favor cash flow + early exit over multi-decade hold.
- At projected returns (-3.0% appreciation + 3.0% rent growth), your $27k cash investment doubles in ~3 years — after that, you're playing with house money.
Negotiation context
- It's been on market 18 days — a 2% lower offer ($97k) is reasonable based on typical stale-listing flexibility.
- 18 sale attempts since 27y ago with the ask held roughly flat each time — persistent listings suggest the price (not the market) is what's stuck; bring a comps-based counter.
Risks & watch-outs
- Watch-outs: built in 1930 — expect roof / HVAC / electrical / plumbing capex.
Questions for the listing agent
- Built in 1930 — when were the roof, HVAC, electrical panel, plumbing, and water heater last replaced?
- Is there a deadline driving the sale (1031 exchange, divorce, estate, relocation)? That informs how much negotiation room exists.
- What's the average days-on-market for RENTAL listings here right now (not sales)? A rising rental-DOM trend means longer vacancies and softer asking-rent achievability than the comps imply.
- What's the recent tenant-quality profile in this submarket — average credit score on applications, eviction rate, late-payment / NSF rate, and stable-employment percentage? A property-management company in the area should have these aggregated.
- How much new for-sale + rental construction is in the pipeline within 1–3 miles? Heavy new supply typically softens prices + rents 12–24 months out; constrained supply supports both.
Investment metrics
- 1% rule
- 2.55% ✓
- Cap rate
- 22.14%
- Cash-on-cash
- 56.58%
- DSCR
- 3.52
- GRM
- 3.3
CMA / ARV
- ARV (on-the-fly)
- $306,409
- Comps found
- 12
Show comp detail 12 sales within ~0.75 mi
| Address | Dist | Beds/Ba | Sqft | Sold | Price | $/sf | Match |
|---|---|---|---|---|---|---|---|
| 414 W State Rd | 0.25mi | 4/2.0 | 2,313 (-1%) | 4mo | $235,000 | $102 | 83 |
| 817 N Glenwood St | 0.30mi | 3/2.5 (-1) | 2,079 (-11%) | 1mo | $300,000 | $144 | 60 |
| 614 E Charles St | 0.48mi | 3/2.0 (-1) | 2,102 (-10%) | 2mo | $313,200 | $149 | 54 |
| 527 E William St | 0.47mi | 4/2.0 | 2,152 (-8%) | 14mo | $305,000 | $142 | 53 |
| 1505 N Church St | 0.44mi | 5/2.0 (+1) | 2,560 (+9%) | 11mo | $240,000 | $94 | 50 |
| 103 W Benson St | 0.22mi | 3/2.5 (-1) | 2,081 (-11%) | 19mo | $280,000 | $135 | 49 |
| 118 E High St | 0.23mi | 3/2.5 (-1) | 2,061 (-12%) | 18mo | $221,900 | $108 | 48 |
| 220 S Park St | 0.59mi | 4/2.5 | 2,039 (-13%) | 3mo | $245,000 | $120 | 47 |
| 105 Sherbrooke Ct | 0.65mi | 3/2.5 (-1) | 2,354 (+1%) | 19mo | $307,500 | $131 | 46 |
| 210 Thorn Hill Ct | 0.68mi | 4/2.5 | 2,022 (-14%) | 5mo | $385,000 | $190 | 40 |
| 824 E Grant St | 0.66mi | 4/2.0 | 2,653 (+13%) | 21mo | $295,000 | $111 | 29 |
| 211 E North St | 0.59mi | 3/2.0 (-1) | 2,684 (+15%) | 20mo | $247,000 | $92 | 26 |
Match score weights: distance 35% · size 25% · config 20% · recency 20%. Top-matched comps best support the ARV.
Projected returns pro-forma
-3.0% appreciation · 3.0% rent growth · sell at horizon
- IRR
- 55.0%
- Equity multiple
- 3.43×
- Total profit
- $66,560
- Equity at exit
- $14,612
- IRR
- 60.1%
- Equity multiple
- 6.98×
- Total profit
- $164,218
- Equity at exit
- $8,473
Cash invested: $27,440 (down + closing). Projections, not guarantees.
Landlord ↔ Tenant lean methodology
- Overall (STATE)
- 62 Landlord-Friendly
- State Michigan
- 62 Landlord-Friendly · EVEN
- County
- — inherits STATE
- City
- — inherits STATE
ZIP-level market 49058
- Active inventory
- 136
- Price-to-rent
- 3.3×
Monthly cashflow live
- Estimated rent
- $2,495 medium interval (Pro) →
- Mortgage (P&I)
- −$514
- Tax est. 1.5%
- −$122 /mo · $1,470/yr
- Insurance
- −$41
- HOA
- −$0
- Vacancy / Maint / Mgmt
- −$524
- Net cashflow
- $1,294
Break-even live
UW: 25.0% down · 7.5% · 30yr · 1.5% tax · 5.0% vac · 8.0% maint · 8.0% mgmt
Financing live
Cash to close
- Down payment
- $24,500
- Closing costs
- $2,940
- Reserves months
- —
- Total cash needed
- —
Loan-product check · same deal, 3 products live
Conventional
25% down · 7.5% · 30yr
- Down + closing
- —
- Monthly P&I
- —
- Monthly cashflow
- —
- DSCR
- —
- Eligible?
- —
Personal DTI + credit; lowest rate.
DSCR
20% down · 8.5% · 30yr
- Down + closing
- —
- Monthly P&I
- —
- Monthly cashflow
- —
- DSCR
- —
- Eligible?
- —
No personal income docs; deal must DSCR.
Hard money
10% down · 12.0% · 12mo
- Down + closing
- —
- Monthly P&I
- —
- Monthly cashflow
- —
- DSCR
- —
- Eligible?
- —
Short-term bridge; refi at stabilization.
Rent comps 1 comps
| Address | Beds | Baths | Sqft | Rent | $/sqft | DOM | Units | Dist |
|---|---|---|---|---|---|---|---|---|
| 634 E North St Hastings, MI | 3.0 | 2.5 | 1840 | $2,495 | $1.36 | 3d | 1 | 0.82mi |
Listing history 13 events
-
2026-06-19days on market $98,000 Active 18 DOM
-
2026-06-18days on market $98,000 Active 17 DOM
-
2026-06-17days on market $98,000 Active 16 DOM
-
2026-06-16days on market $98,000 Active 15 DOM
-
2026-06-15days on market $98,000 Active 14 DOM
-
2026-06-14days on market $98,000 Active 12 DOM
-
2026-06-13days on market $98,000 Active 11 DOM
-
2026-06-10days on market $98,000 Active 9 DOM
-
2026-06-09days on market $98,000 Active 8 DOM
-
2026-06-08days on market $98,000 Active 7 DOM
-
2026-06-07days on market $98,000 Active 6 DOM
-
2026-06-02remarks 599-char remark
-
2026-06-02$98,000 Active 1 DOM
ⓘ Source: listings_history table (triggers on properties + properties_extension) + one-shot
backfill from property_details.listing_events for pre-trigger history.
Climate risk First Street
- Flood 1/10 Low FEMA zone X (unshaded) · 0% chance over 30 yrs
- Wildfire 1/10 Low
- Heat 2/10 Low 7 d/yr ≥98°F today · 16 d/yr by 30 yrs out
- Wind 2/10 Low
- Air quality 2/10 Low 1 unhealthy d/yr today · 1 by 30 yrs out
Nearby sold comps map
Loading sold comps map…
Walkable amenities ~0.75 mi
Loading nearby amenities…
Taxation est. · year 1
- Rental income
- $29,940
- − Mortgage interest
- −$5,490
- − Property taxes
- −$1,470
- − Insurance
- −$490
- − Repairs & maintenance
- −$2,395
- − Management
- −$2,395
- − Depreciation
- −$2,851
- Taxable income
- $14,849
- Est. tax owed @ 24.0%
- −$3,564
- After-tax cash flow
- $11,962/yr
For passive investors: Depreciation is non-cash, so a rental often shows a tax loss while cash-flowing — sheltering income. Rental losses are passive: they offset passive income freely, and up to $25,000/yr can offset ordinary (W-2) income if you actively participate and your MAGI is under $100k (phasing out to $0 by $150k); unused losses carry forward. On sale, claimed depreciation is recaptured at up to 25%, and gains may owe capital-gains tax (a 1031 exchange can defer both). Figures are a year-1 estimate at your 24.0% rate — not tax advice; consult a CPA.
Schools (NCES district)
- District
- Hastings Area School District
- NCES district ID
- 2617970
- Math proficiency
- 33% ▼ -5.00%
- Reading proficiency
- 48% ▼ -2.00%
- Median HH income
- $48,478
- Composite
- 34.71/100
- National rank
- #5137
- State rank
- #203 of 540 in MI
Livability — Hastings
- Score
- 79/100
- State rank
- #95
- US rank
- #2201
Category grades
Schools grade is shown separately in the Schools card above.
Census & demographics
- Census place
- Hastings, MI
- City population
- 19,513
- Population (ZIP)
- 19,513
Population outlook (Barry County) Hauer SSP2
- Today (2025)
- 59,601 people
- By 2030
- 59,185 · -0.7%
- By 2040
- 57,121 · -4.2%
- By 2050
- 53,139 · -10.8%
- By 2075
- 42,814 · -28.2%
- By 2100
- 29,357 · -50.7%
Race, ethnicity, and origin ACS 2023
- Neighborhood character
- Predominantly White (92%)
- Race & ethnicity
- White 92% Two or more races 5% Hispanic / Latino 3%
- Common ancestry
- Iranian 8% Romanian 3% Lithuanian 3%
- Foreign-born
- 3% · Canada
- Languages at home
- 96% English-only · Spanish 2% German/W. Germanic 1%
Political lean MEDSL · Barry
- 2024 margin
- Solid R (+34.3) · D 32.1% · R 66.4% · Other 1.5%
- 2008→2024 swing
- -24.6pp toward R · 2008: -9.8pp · 2024: -34.3pp
- All cycles
- 2024: R+34.3 2020: R+32.5 2016: R+33.3 2012: R+18.1 2008: R+9.8
Not yet ingested
- Civics
- —
Market trends
- HPI YoY
- ▼ -137.56%
- Current HPI
- 224.6353
- Rent YoY
- —
- Metro
- —
- State GDP YoY
- ▲ 1.37%
- F500 in state
- 28
Industry mix (Fortune 500 HQ in MI)
| Industry | F500 HQs | Revenue |
|---|---|---|
| Automotive Parts | 3 | $48B |
|
||
| Automotive | 2 | $372B |
|
||
| Chemicals | 1 | $45B |
|
||
| Automotive Retail | 1 | $29B |
|
||
| Healthcare / Medical Devices | 1 | $23B |
|
||
| Automotive Technology | 1 | $20B |
|
||
Price history
+9.0% since first listed37 events — show timeline
- 2026-05-29 Listed $98,000 SW Michigan MLS
- 2026-05-29 Listed $98,000 REALCOMP
- 2026-05-29 Listed $98,000 MiRealSource-MiMLS
- 2023-02-28 Sold (Public Records) $155,000 Public Records
- 2023-02-24 Sold (MLS) $155,000 SW Michigan MLS
- 2023-02-24 Sold (MLS) $155,000 MiRealSource-MiMLS
- 2023-02-24 Sold (MLS) $155,000 REALCOMP
- 2023-01-23 Pending — REALCOMP
- 2023-01-23 Pending — MiRealSource-MiMLS
- 2023-01-23 Pending — SW Michigan MLS
- 2023-01-18 Listed $160,000 SW Michigan MLS
- 2023-01-18 Listed $160,000 MiRealSource-MiMLS
- 2023-01-18 Listed $160,000 REALCOMP
- 2015-06-29 Listing Removed — SW Michigan MLS
- 2015-04-27 Listing Removed — SW Michigan MLS
- 2008-09-26 Sold (MLS) $35,126 REALCOMP
- 2008-09-26 Sold (MLS) $35,126 SW Michigan MLS
- 2008-04-02 Listing Removed — REALCOMP
- 2008-04-01 Listed $34,900 REALCOMP
- 2008-04-01 Listed $34,900 SW Michigan MLS
- 2008-03-24 Listing Removed — REALCOMP
- 2008-03-24 Listing Removed — SW Michigan MLS
- 2008-03-18 Listed $47,000 REALCOMP
- 2008-03-18 Listed $47,000 SW Michigan MLS
- 2008-03-18 Listed $47,000 REALCOMP
- 2008-03-18 Listed $47,000 SW Michigan MLS
- 2008-03-16 Listing Removed — REALCOMP
- 2007-09-11 Listed $54,500 REALCOMP
- 2007-09-11 Listed $54,500 SW Michigan MLS
- 2000-08-03 Sold (MLS) $87,850 REALCOMP
- 2000-08-03 Sold (MLS) $87,850 SW Michigan MLS
- 1999-11-09 Listing Removed — SW Michigan MLS
- 1999-11-09 Listing Removed — REALCOMP
- 1999-08-17 Listed $89,900 REALCOMP
- 1999-08-17 Listed $89,900 SW Michigan MLS
- 1999-08-07 Listed $89,900 SW Michigan MLS
- 1999-08-07 Listed $89,900 REALCOMP
Cash-flow waterfall
monthlySold comps — $/sqft
last 12 mo · ≤1 miLoading sold comps…