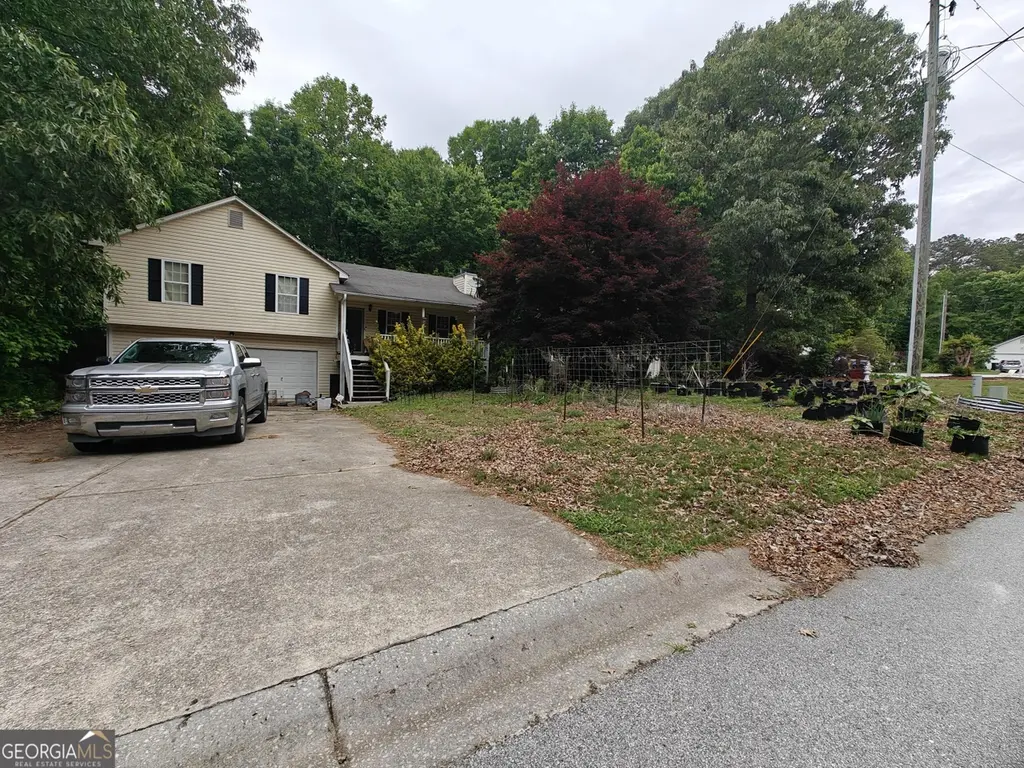
115 Cash Way · Braswell, GA
Flood risk 1/10 · Minimal
- FEMA flood zone
- X (unshaded)
- Chance of flooding over 30 yrs
- 0.0%
- Est. flood insurance / yr
- $473 – $860
Fire risk 4/10 · Minor
- Est. fire insurance / yr
- $963 – $1,789
Heat risk 4/10 · Minor
- Hot days now (above 102°F)
- 7 days/yr
- Hot days in 30 yrs
- 18 days/yr
Wind risk 4/10 · Minor
- Chance of severe wind over 30 yrs
- 19.0%
Air-quality risk 4/10 · Minor
- Unhealthy air days now
- 4 days/yr
- Unhealthy air days in 30 yrs
- 5 days/yr
Risk factors via First Street. Map © Google.
Why this score? — see what drove the D+ grade
The composite is a weighted blend of 9 inputs, each scored 0–100. Each bar is that input's sub-score; the figure is the points it added to the 100-point composite (weight × sub-score).
- ARV discount +15.0/15.0
- Cash flow +14.6/30.0
- DSCR +4.4/10.0
- 1% rule +3.6/10.0
- Schools +3.6/10.0
- Livability +3.0/5.0
- Rent growth +2.5/5.0
- Condition / age +2.5/5.0
- Appreciation +0.0/10.0
$214,900
🖨 Deal sheet 📄 Offer letter ✓ Due diligence
Listing remarks
Highly motivated seller! Very accommodating to ensure a smooth transition for the next owner. Bring your unique situation! This 3-bedroom, 2-bath home features a fenced backyard, attached garage, front porch, rear deck, and a practical layout in the Rockmart area of Paulding County. The home has good bones and is priced to reflect cosmetic updates that many buyers may choose to make, including paint, flooring, and personal finishes. This creates an opportunity to add value while updating the home to fit your preferences. Additional features include a large crawl space with easy access, extra storage space, and a fenced backyard. Conveniently located near shopping, dining, schools, and majo
Key facts
- Double car garage
- Extra storage
- Front porch
Tags
Property features AI
Finance
- Other: Listing accepts Cash, Conventional, FHA, VA loan, and other terms
- HOA & community: No HOA
Exterior
- Parking: Garage with door opener and side/rear entrance; Storage in garage; Parking pad; 2 parking spaces; Open parking available
- Utilities: Public water; Septic sewer; Electricity available; Cable available; High speed internet available; Phone available; Water available; Sewer available
- Home design: Single family house; Residential property; One and one half stories; Resale
- Construction: Built in 2001; Vinyl siding; Composition roof; House structure
- Exterior features: Balcony; Sloped lot; Has a view
Interior
- Kitchen: Refrigerator
- Bedrooms: 3 bedrooms
- Flooring: Carpet; Vinyl
- Bathrooms: 2 full bathrooms
- Heating & cooling: Heat pump heating; Central air conditioning
- Interior features: High ceilings; Rear stairs; Soaking tub; Walk-in closet(s); Unfinished basement; Family room; One fireplace
- Laundry & utility: Laundry in basement; Electric water heater
Neighborhood map
What this means for you Summary
Snapshot
- This is a 3-bed/2.0-bath single-family listed at $215k.
Deal economics
- At list price, monthly cash flow is $50 ($598/yr) — positive.
- The deal already cash-flows at list — no discount required.
- To meet the 1% rule (rent ≥ 1% of price), the offer needs to be $185k (13.8% below list).
- Recommended offer: $185k (13.8% below list) — sets the bar for 1% rule.
- Cap rate 6.6% vs local median 3.4% in Braswell — top-decile yield for the area; either an underpriced asset or a hidden risk that comps aren't pricing in. Stress-test before assuming the spread holds.
Location & tenants
- Location reads 60/100 on livability (#380 in GA) — a middle-class / working-renter tenant base. Strengths: crime A+, cost of living A+, housing A; Watch: amenities F, commute F, employment D-.
- Paulding County (suburban): math 39% / reading 42% proficiency, ranked #33 of 174 in GA (top 19%) — families likely to look elsewhere, expect single-tenant / working-renter base with shorter leases.
- Zoned schools: Carl Scoggins Sr. Middle School (math 29% / reading 40%, grade F, #196 of 470 statewide, top 42%, 760 students, 47% FRL).
- Market conditions: 198 active listings in the ZIP; 5 comparable units currently listed for rent nearby; rentals leasing fast (median 5d on market — plan ~1-2 weeks tenant-placement turnaround); 1,458 units permitted in Paulding County in 2024 (0 in 5+ unit buildings).
- This rent runs 39% of the median local income ($57k/yr) — at the standard rent-burdened threshold; future hikes will face affordability resistance.
Forward outlook
- Local home prices are declining (-3.0%/yr); year-one equity from $1k of loan paydown is wiped out by about $6k of value loss. Plan a longer hold.
- Paulding County population projected at +24% by 2050 — long-run rental-demand tailwind backs the buy-and-hold thesis.
Negotiation context
- It's been on market 48 days — a 3% lower offer ($208k) is reasonable based on typical stale-listing flexibility.
- 9 sale attempts since 8y ago with the ask held roughly flat each time — persistent listings suggest the price (not the market) is what's stuck; bring a comps-based counter.
Questions for the listing agent
- It's been on market 48 days. Have you received any prior offers? Is the seller open to a 14% concession, seller financing, or rate buy-down credit?
- Is there a deadline driving the sale (1031 exchange, divorce, estate, relocation)? That informs how much negotiation room exists.
- Schools are F-rated, which usually means shorter tenancies and higher turnover. Who's the typical renter profile here, and what's been the actual vacancy rate?
- The area grade is low — what's the realistic commute time and amenity access for the typical tenant pool here? Any planned neighborhood developments (good or bad) we should know about?
- What's the average days-on-market for RENTAL listings here right now (not sales)? A rising rental-DOM trend means longer vacancies and softer asking-rent achievability than the comps imply.
- What's the recent tenant-quality profile in this submarket — average credit score on applications, eviction rate, late-payment / NSF rate, and stable-employment percentage? A property-management company in the area should have these aggregated.
- How much new for-sale + rental construction is in the pipeline within 1–3 miles? Heavy new supply typically softens prices + rents 12–24 months out; constrained supply supports both.
Investment metrics
- 1% rule
- 0.86% ✗
- Cap rate
- 6.57%
- Cash-on-cash
- 0.99%
- DSCR
- 1.04
- GRM
- 9.7
CMA / ARV
- ARV (median comp)
- $269,444
- List price
- $214,900
- Delta
- -20.24%
- Verdict
- UNDERPRICED
- Comps
- 20 within 1.0 mi
Show comp detail 12 sales within ~0.75 mi
| Address | Dist | Beds/Ba | Sqft | Sold | Price | $/sf | Match |
|---|---|---|---|---|---|---|---|
| 233 Winterville Dr | 0.23mi | 3/2.0 | 1,190 (-2%) | 6mo | $244,900 | $206 | 80 |
| 409 Benjamin Dr | 0.31mi | 3/2.0 | 1,246 (+3%) | 3mo | $244,900 | $197 | 79 |
| 146 Old Brock Rd | 0.45mi | 3/2.0 | 1,320 (+9%) | 5mo | $297,000 | $225 | 61 |
| 52 Tide Water Way | 0.66mi | 3/2.0 | 1,246 (+3%) | 7mo | $273,500 | $220 | 59 |
| 375 Old Brock Rd | 0.59mi | 3/2.0 | 1,118 (-8%) | 2mo | $192,400 | $172 | 58 |
| 192 Old Brock Rd | 0.45mi | 3/2.0 | 1,150 (-5%) | 15mo | $298,500 | $260 | 58 |
| 413 Old Brock Rd | 0.63mi | 3/1.5 | 1,118 (-8%) | 3mo | $258,799 | $231 | 53 |
| 98 Brenda Cir | 0.47mi | 3/1.5 | 1,102 (-9%) | 10mo | $223,500 | $203 | 52 |
| 101 Tidewater Way | 0.62mi | 3/2.0 | 1,342 (+10%) | 4mo | $227,867 | $170 | 50 |
| 129 Carolyn Path | 0.62mi | 3/2.0 | 1,330 (+10%) | 10mo | $324,900 | $244 | 47 |
| 343 Old Brock Rd | 0.57mi | 3/1.5 | 1,118 (-8%) | 15mo | $249,950 | $224 | 46 |
| 307 Farm Brook Ln | 0.75mi | 3/2.0 | 1,289 (+6%) | 18mo | $279,900 | $217 | 39 |
Match score weights: distance 35% · size 25% · config 20% · recency 20%. Top-matched comps best support the ARV.
Projected returns pro-forma
-3.0% appreciation · 3.0% rent growth · sell at horizon
- IRR
- -14.7%
- Equity multiple
- 0.47×
- Total profit
- $-31,666
- Equity at exit
- $32,042
- IRR
- -6.1%
- Equity multiple
- 0.61×
- Total profit
- $-23,552
- Equity at exit
- $18,581
Cash invested: $60,172 (down + closing). Projections, not guarantees.
Landlord ↔ Tenant lean methodology
- Overall (STATE)
- 90 Strongly Landlord-Friendly
- State Georgia
- 90 Strongly Landlord-Friendly · R+3
- County
- — inherits STATE
- City
- — inherits STATE
ZIP-level market 30153
- Home prices YoY
- -4.6%
- Active inventory
- 198
- Price-to-rent
- 9.7×
Monthly cashflow live
- Estimated rent
- $1,853 high interval (Pro) →
- Mortgage (P&I)
- −$1,127
- Tax from tax record
- −$198 /mo · $2,372/yr
- Insurance
- −$90
- HOA
- −$0
- Vacancy / Maint / Mgmt
- −$389
- Net cashflow
- $50
Break-even live
UW: 25.0% down · 7.5% · 30yr · 1.5% tax · 5.0% vac · 8.0% maint · 8.0% mgmt
Financing live
Cash to close
- Down payment
- $53,725
- Closing costs
- $6,447
- Reserves months
- —
- Total cash needed
- —
Loan-product check · same deal, 3 products live
Conventional
25% down · 7.5% · 30yr
- Down + closing
- —
- Monthly P&I
- —
- Monthly cashflow
- —
- DSCR
- —
- Eligible?
- —
Personal DTI + credit; lowest rate.
DSCR
20% down · 8.5% · 30yr
- Down + closing
- —
- Monthly P&I
- —
- Monthly cashflow
- —
- DSCR
- —
- Eligible?
- —
No personal income docs; deal must DSCR.
Hard money
10% down · 12.0% · 12mo
- Down + closing
- —
- Monthly P&I
- —
- Monthly cashflow
- —
- DSCR
- —
- Eligible?
- —
Short-term bridge; refi at stabilization.
Rent comps 5 comps
| Address | Beds | Baths | Sqft | Rent | $/sqft | DOM | Units | Dist |
|---|---|---|---|---|---|---|---|---|
| 51 Chesapeake Way Rockmart, GA | 3.0 | 2.0 | 1266 | $1,689 | $1.33 | 43d | 1 | 0.78mi |
| 103 Fairfax Dr Rockmart, GA | 3.0 | 2.0 | 1245 | $1,619 | $1.30 | 1d | 1 | 1.02mi |
| 39 Lofty Pine Ln Rockmart, GA | 3.0 | 2.0 | 1304 | $1,949 | $1.49 | 2d | 1 | 1.05mi |
| 141 Fairfax Dr Rockmart, GA | 3.0 | 2.0 | 1214 | $1,759 | $1.45 | 5d | 1 | 1.06mi |
| 57 Honeysuckle Ct Rockmart, GA | 3.0 | 2.0 | 1320 | $1,649 | $1.25 | 15d | 1 | 1.40mi |
Listing history 50 events
-
2026-06-18days on market $214,900 Active 48 DOM
-
2026-06-17days on market $214,900 Active 47 DOM
-
2026-06-16days on market $214,900 Active 46 DOM
-
2026-06-15days on market $214,900 Active 45 DOM
-
2026-06-13days on market $214,900 Active 43 DOM
-
2026-06-13days on market $214,900 Active 42 DOM
-
2026-06-09days on market $214,900 Active 39 DOM
-
2026-06-08days on market $214,900 Active 38 DOM
-
2026-06-07days on market $214,900 Active 37 DOM
-
2026-06-04days on market $214,900 Active 34 DOM
-
2026-06-03days on market $214,900 Active 33 DOM
-
2026-06-02days on market $214,900 Active 32 DOM
-
2026-06-01days on market $214,900 Active 31 DOM
-
2026-05-31days on market $214,900 Active 30 DOM
-
2026-05-05price $214,900 726-char remark
-
2026-05-01$225,000 New 726-char remark
-
2026-03-30historical
-
2026-03-30historical
-
2026-02-17price $215,000
-
2026-02-17price $215,000
-
2026-02-06$225,000 Active
-
2026-02-05historical
-
2026-02-05$225,000 New
-
2023-10-09soldstatus $238,500
-
2023-10-04soldstatus $238,500 Sold
-
2023-10-04soldstatus $238,500 Closed
-
2023-10-03status Pending
-
2023-09-14status Under Contract
-
2023-09-14historical Active Under Contract
-
2023-09-08price $238,500
-
2023-09-08price $238,500
-
2023-09-07status Back On Market
-
2023-09-07status Active
-
2023-09-03status Under Contract
-
2023-09-03historical Active Under Contract
-
2023-09-01price $242,000
-
2023-09-01price $242,000
-
2023-08-29price $265,000
-
2023-08-29price $265,000
-
2023-08-16price $270,000
-
2023-08-16price $270,000
-
2023-08-09price $275,000
-
2023-08-09price $275,000
-
2023-08-03price $285,000
-
2023-08-03price $285,000
-
2023-07-26price $290,000
-
2023-07-26price $290,000
-
2023-07-24$299,000 New
-
2023-07-24$299,000 Active
-
2023-07-07soldstatus $220,880
ⓘ Source: listings_history table (triggers on properties + properties_extension) + one-shot
backfill from property_details.listing_events for pre-trigger history.
Tax reassessment forecast GA · Resets to sale price
- Current annual tax
- $2,372 · $198/mo
- Projected year-2 tax
- $2,372 · $198/mo
- Expected delta
- $0/yr ($0/mo · 0.0%)
ⓘ Screening estimate from a state-policy table — verify with the county assessor before closing.
Climate risk First Street
- Flood 1/10 Low FEMA zone X (unshaded) · 0% chance over 30 yrs
- Wildfire 4/10 Moderate
- Heat 4/10 Moderate 7 d/yr ≥102°F today · 18 d/yr by 30 yrs out
- Wind 4/10 Moderate 19% chance of damaging wind over 30 yrs
- Air quality 4/10 Moderate 4 unhealthy d/yr today · 5 by 30 yrs out
Nearby sold comps map
Loading sold comps map…
Walkable amenities ~0.75 mi
Loading nearby amenities…
Taxation est. · year 1
- Rental income
- $22,238
- − Mortgage interest
- −$12,038
- − Property taxes
- −$2,372
- − Insurance
- −$1,074
- − Repairs & maintenance
- −$1,779
- − Management
- −$1,779
- − Depreciation
- −$6,252
- Taxable loss
- −$3,056
- Est. tax savings @ 24.0%
- +$733
- After-tax cash flow
- $1,331/yr
For passive investors: Depreciation is non-cash, so a rental often shows a tax loss while cash-flowing — sheltering income. Rental losses are passive: they offset passive income freely, and up to $25,000/yr can offset ordinary (W-2) income if you actively participate and your MAGI is under $100k (phasing out to $0 by $150k); unused losses carry forward. On sale, claimed depreciation is recaptured at up to 25%, and gains may owe capital-gains tax (a 1031 exchange can defer both). Figures are a year-1 estimate at your 24.0% rate — not tax advice; consult a CPA.
Schools (NCES district)
- District
- Paulding County
- NCES district ID
- 1304020
- Math proficiency
- 39% ▼ -6.00%
- Reading proficiency
- 42% ▼ -7.00%
- Median HH income
- $61,447
- Composite
- 36.0/100
- National rank
- #4784
- State rank
- #33 of 174 in GA
Livability — Braswell
- Score
- 60/100
- State rank
- #380
- US rank
- #19219
Category grades
Schools grade is shown separately in the Schools card above.
Census & demographics
- County
- Polk County · 18,467 people
- Metro
- Cedartown, GA
- Population (ZIP)
- 18,467
- Household income
- $57,377
- Rent vs Own
- Severe rent burden
- 340.0
Population outlook (Paulding County) Hauer SSP2
- Today (2025)
- 175,714 people
- By 2030
- 186,082 · +5.9%
- By 2040
- 204,414 · +16.3%
- By 2050
- 217,040 · +23.5%
- By 2075
- 236,980 · +34.9%
- By 2100
- 238,314 · +35.6%
Race, ethnicity, and origin ACS 2023
- Neighborhood character
- Predominantly White (81%)
- Race & ethnicity
- White 81% Black 10% Hispanic / Latino 6% Two or more races 4% Asian 1%
- Hispanic origin (detail)
- Mexican 4% Puerto Rican 2%
- Common ancestry
- Italian 2% Slovak 1% Romanian 1%
- Foreign-born
- 3% · Canada, China
- Languages at home
- 95% English-only · Spanish 2% Other Indo-European 1% German/W. Germanic 1%
Political lean MEDSL · Paulding
- 2024 margin
- Strong R (+24.1) · D 37.6% · R 61.7%
- 2008→2024 swing
- +14.4pp toward D · 2008: -38.5pp · 2024: -24.1pp
- All cycles
- 2024: R+24.1 2020: R+29.1 2016: R+41.2 2012: R+43.6 2008: R+38.5
Not yet ingested
- Civics
- —
Market trends
- HPI YoY
- ▼ -18.01%
- Current HPI
- 370.1814
- Rent YoY
- —
- Metro
- Cedartown, GA
- State GDP YoY
- ▲ 2.66%
- F500 in state
- 28
Industry mix (Fortune 500 HQ in GA)
| Industry | F500 HQs | Revenue |
|---|---|---|
| Paper / Packaging | 2 | $29B |
|
||
| Retail | 1 | $160B |
|
||
| Transportation / Logistics | 1 | $91B |
|
||
| Airlines | 1 | $62B |
|
||
| Consumer Goods | 1 | $47B |
|
||
| Utilities | 1 | $25B |
|
||
Price history
+114.3% since first listed48 events — show timeline
- 2026-05-05 Price Changed $214,900 GAMLS
- 2026-05-01 Listed $225,000 GAMLS
- 2026-03-30 Listing Removed — GAMLS
- 2026-03-30 Listing Removed — FMLS
- 2026-02-17 Price Changed $215,000 GAMLS
- 2026-02-17 Price Changed $215,000 FMLS
- 2026-02-06 Listed $225,000 FMLS
- 2026-02-05 Coming Soon — FMLS
- 2026-02-05 Listed $225,000 GAMLS
- 2023-10-09 Sold (Public Records) $238,500 Public Records
- 2023-10-04 Sold (MLS) $238,500 FMLS
- 2023-10-04 Sold (MLS) $238,500 GAMLS
- 2023-10-03 Pending — FMLS
- 2023-09-14 Pending — GAMLS
- 2023-09-14 Contingent — FMLS
- 2023-09-08 Price Changed $238,500 GAMLS
- 2023-09-08 Price Changed $238,500 FMLS
- 2023-09-07 Relisted — GAMLS
- 2023-09-07 Relisted — FMLS
- 2023-09-03 Pending — GAMLS
- 2023-09-03 Contingent — FMLS
- 2023-09-01 Price Changed $242,000 GAMLS
- 2023-09-01 Price Changed $242,000 FMLS
- 2023-08-29 Price Changed $265,000 GAMLS
- 2023-08-29 Price Changed $265,000 FMLS
- 2023-08-16 Price Changed $270,000 GAMLS
- 2023-08-16 Price Changed $270,000 FMLS
- 2023-08-09 Price Changed $275,000 GAMLS
- 2023-08-09 Price Changed $275,000 FMLS
- 2023-08-03 Price Changed $285,000 GAMLS
- 2023-08-03 Price Changed $285,000 FMLS
- 2023-07-26 Price Changed $290,000 GAMLS
- 2023-07-26 Price Changed $290,000 FMLS
- 2023-07-24 Listed $299,000 FMLS
- 2023-07-24 Listed $299,000 GAMLS
- 2023-07-07 Sold (Public Records) $220,880 Public Records
- 2018-10-15 Sold (Public Records) $144,900 Public Records
- 2018-10-12 Sold (MLS) $144,900 GAMLS
- 2018-10-12 Sold (MLS) $144,900 FMLS
- 2018-09-04 Pending — FMLS
- 2018-09-04 Pending — GAMLS
- 2018-07-29 Price Changed $144,900 GAMLS
- 2018-07-28 Price Changed $144,900 FMLS
- 2018-07-25 Price Changed $149,900 GAMLS
- 2018-07-12 Listed $154,900 GAMLS
- 2018-07-12 Listed $154,900 FMLS
- 2006-03-29 Sold (Public Records) $106,600 Public Records
- 2001-06-18 Sold (Public Records) $100,300 Public Records
Property tax history
+4.0%/yrLatest (2025): $2,372 · +0.4% YoY. Source: county tax records.
Cash-flow waterfall
monthlySold comps — $/sqft
last 12 mo · ≤1 miLoading sold comps…