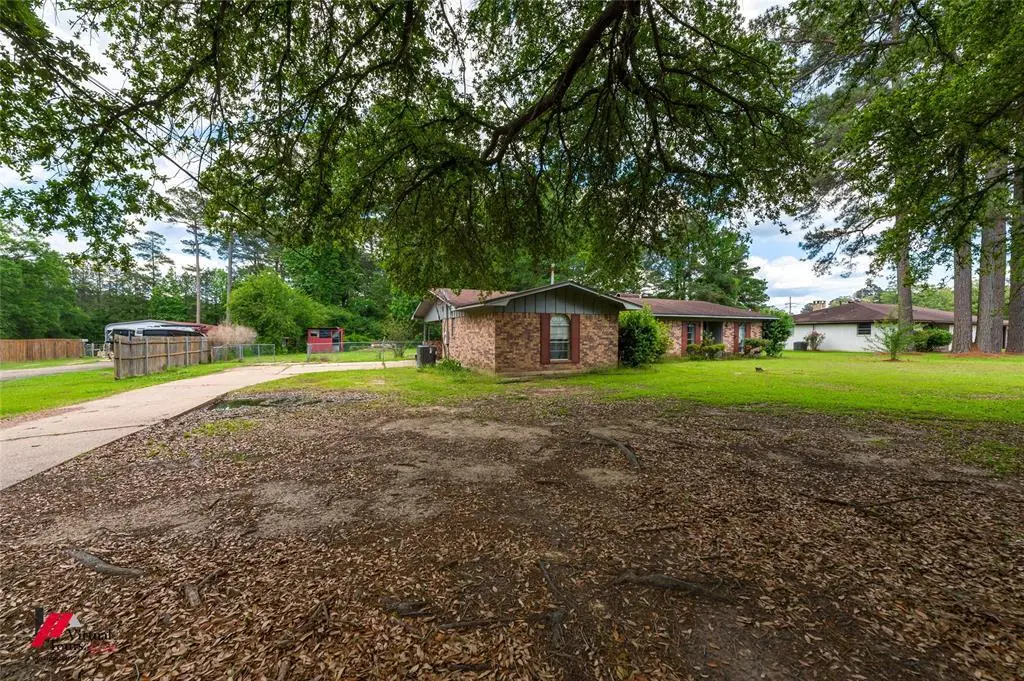
423 11th St NE · Springhill, LA
Flood risk 1/10 · Minimal
- FEMA flood zone
- X (unshaded)
- Chance of flooding over 30 yrs
- 0.0%
- Est. flood insurance / yr
- $507 – $1,088
Fire risk 4/10 · Minor
- Est. fire insurance / yr
- $1,269 – $2,357
Heat risk 7/10 · Major
- Hot days now (above 111°F)
- 7 days/yr
- Hot days in 30 yrs
- 23 days/yr
Wind risk 6/10 · Moderate
- Chance of severe wind over 30 yrs
- 51.0%
Air-quality risk 1/10 · Minimal
- Unhealthy air days now
- 0 days/yr
- Unhealthy air days in 30 yrs
- 0 days/yr
Risk factors via First Street. Map © Google.
Why this score? — see what drove the B grade
The composite is a weighted blend of 9 inputs, each scored 0–100. Each bar is that input's sub-score; the figure is the points it added to the 100-point composite (weight × sub-score).
- Cash flow +27.0/30.0
- ARV discount +15.0/15.0
- DSCR +9.3/10.0
- Appreciation +6.8/10.0
- 1% rule +6.7/10.0
- Livability +3.2/5.0
- Rent growth +2.5/5.0
- Condition / age +2.5/5.0
- Schools +1.8/10.0
$110,000
🖨 Deal sheet 📄 Offer letter ✓ Due diligence
Listing remarks
Charming opportunity in the heart of Springhill! This property at 423 11th St NE offers great potential for investors or buyers looking to put their personal touch on a home. Featuring a functional layout with spacious living areas, this home sits on a generous lot with room to expand, garden, or create your ideal outdoor space. Conveniently located near local schools, shopping, and amenities, it provides both small-town charm and everyday convenience. Whether you're looking for your next rental, flip project, or a place to make your own, this property is full of possibilities—don’t miss your chance to bring it back to life!
Key facts
- Generous lot
- Room to expand
- 0.5 acre lot
Tags
Property features AI
Finance
- Other: Property is not attached and has no accessory unit
- Financial info: Listing accepts Cash, Conventional, FHA, USDA Loan, VA Loan
- HOA & community: No association
Exterior
- Parking: Attached carport with 2 covered spaces; 2 carport spaces
- Utilities: City water; City sewer; Electricity connected; Individual gas meter; Cable available; Phone available
- Home design: Single-family residence; Residential property; One story; Preowned home (built 1979)
- Construction: Brick construction; Slab foundation; Built in 1979
- Exterior features: Approximately 0.5 acre lot; Will not subdivide
Interior
- Kitchen: No appliances included
- Bedrooms: 4 bedrooms (all on main level); Primary bedroom on main level
- Bathrooms: 2 full bathrooms (main level)
- Heating & cooling: Central heating; Central air conditioning
- Interior features: Cable TV available; High-speed internet available; One-level floor plan; 8 total rooms; One living area; One dining area
- Laundry & utility: No specific laundry appliances listed
Neighborhood map
What this means for you Summary
Snapshot
- This is a 4-bed/2.0-bath single-family listed at $110k.
Deal economics
- At list price, monthly cash flow is $308 ($4k/yr) — positive.
- The deal already cash-flows at list — no discount required.
- Meets the 1% rule at list price ($1k rent vs $110k).
- Recommended offer: $107k (3.0% below list) — sets the bar for market timing.
- Cap rate 9.7% vs local median 7.0% in Springhill — top-decile yield for the area; either an underpriced asset or a hidden risk that comps aren't pricing in. Stress-test before assuming the spread holds.
Location & tenants
- Location reads 65/100 on livability (#139 in LA) — a middle-class / working-renter tenant base. Strengths: cost of living A+, crime A-, health & safety A-; Watch: amenities F, commute F, employment F.
- Webster Parish (town): math 17% / reading 26% proficiency, ranked #67 of 98 in LA (top 68%) — low school quality limits family demand, transient renter base, plan for 1-2y turnover; 61% free/reduced lunch — lower-income household profile, screen leases tightly.
- Market conditions: 44 active listings in the ZIP; 36 units permitted in Webster Parish in 2024 (0 in 5+ unit buildings).
Forward outlook
- In year one you build about $5k of equity ($761 loan paydown + $4k appreciation (3.6% local appreciation)).
- Webster County population projected at -21% by 2050 — secular population decline; favor cash flow + early exit over multi-decade hold.
- At projected returns (3.6% appreciation + 3.0% rent growth), your $31k cash investment doubles in ~4 years — after that, you're playing with house money.
- By year 8, paydown + projected appreciation supports a ~$35k cash-out refi (75% LTV) — recoverable capital for the next deal without selling this one.
Negotiation context
- It's been on market 45 days — a 3% lower offer ($107k) is reasonable based on typical stale-listing flexibility.
- 2 sale attempts; this cycle's ask has dropped $10k (8%) from the opening price — seller is motivated, your offer sets the floor, not the list.
Risks & watch-outs
- Climate carrying-cost: major wind risk, 51% chance of damaging wind over 30y; extreme-heat days projected 7→23/yr by 2055 (HVAC capex compounding) — expect insurance premiums to compound above CPI over the hold.
Questions for the listing agent
- It's been on market 45 days. Have you received any prior offers? Is the seller open to a 3% concession, seller financing, or rate buy-down credit?
- Built in 1979 — when were the roof, HVAC, electrical panel, plumbing, and water heater last replaced?
- Is there a deadline driving the sale (1031 exchange, divorce, estate, relocation)? That informs how much negotiation room exists.
- What's the average days-on-market for RENTAL listings here right now (not sales)? A rising rental-DOM trend means longer vacancies and softer asking-rent achievability than the comps imply.
- What's the recent tenant-quality profile in this submarket — average credit score on applications, eviction rate, late-payment / NSF rate, and stable-employment percentage? A property-management company in the area should have these aggregated.
- How much new for-sale + rental construction is in the pipeline within 1–3 miles? Heavy new supply typically softens prices + rents 12–24 months out; constrained supply supports both.
Investment metrics
- 1% rule
- 1.17% ✓
- Cap rate
- 9.65%
- Cash-on-cash
- 12.00%
- DSCR
- 1.53
- GRM
- 7.1
CMA / ARV
- ARV (median comp)
- $132,210
- List price
- $110,000
- Delta
- -16.80%
- Verdict
- UNDERPRICED
- Comps
- 16 within 1.0 mi
Show comp detail 1 sale within ~0.75 mi
| Address | Dist | Beds/Ba | Sqft | Sold | Price | $/sf | Match |
|---|---|---|---|---|---|---|---|
| 607 5th St NE | 0.68mi | 3/1.5 (-1) | 1,806 (-14%) | 1mo | $110,000 | $61 | 37 |
Match score weights: distance 35% · size 25% · config 20% · recency 20%. Top-matched comps best support the ARV.
Projected returns pro-forma
3.57% appreciation · 3.0% rent growth · sell at horizon
- IRR
- 20.0%
- Equity multiple
- 2.18×
- Total profit
- $36,197
- Equity at exit
- $53,008
- IRR
- 20.8%
- Equity multiple
- 4.16×
- Total profit
- $97,324
- Equity at exit
- $84,564
Cash invested: $30,800 (down + closing). Projections, not guarantees.
Landlord ↔ Tenant lean methodology
- Overall (STATE)
- 90 Strongly Landlord-Friendly
- State Louisiana
- 90 Strongly Landlord-Friendly · R+12
- County
- — inherits STATE
- City
- — inherits STATE
ZIP-level market 71075
- Home prices YoY
- 4.1%
- Active inventory
- 44
- Price-to-rent
- 7.1×
Monthly cashflow live
- Estimated rent
- $1,286 medium interval (Pro) →
- Mortgage (P&I)
- −$577
- Tax from tax record
- −$85 /mo · $1,022/yr
- Insurance
- −$46
- HOA
- −$0
- Vacancy / Maint / Mgmt
- −$270
- Net cashflow
- $308
Break-even live
UW: 25.0% down · 7.5% · 30yr · 1.5% tax · 5.0% vac · 8.0% maint · 8.0% mgmt
Financing live
Cash to close
- Down payment
- $27,500
- Closing costs
- $3,300
- Reserves months
- —
- Total cash needed
- —
Loan-product check · same deal, 3 products live
Conventional
25% down · 7.5% · 30yr
- Down + closing
- —
- Monthly P&I
- —
- Monthly cashflow
- —
- DSCR
- —
- Eligible?
- —
Personal DTI + credit; lowest rate.
DSCR
20% down · 8.5% · 30yr
- Down + closing
- —
- Monthly P&I
- —
- Monthly cashflow
- —
- DSCR
- —
- Eligible?
- —
No personal income docs; deal must DSCR.
Hard money
10% down · 12.0% · 12mo
- Down + closing
- —
- Monthly P&I
- —
- Monthly cashflow
- —
- DSCR
- —
- Eligible?
- —
Short-term bridge; refi at stabilization.
Listing history 24 events
-
2026-06-18days on market $110,000 Active 45 DOM
-
2026-06-17days on market $110,000 Active 44 DOM
-
2026-06-16days on market $110,000 Active 43 DOM
-
2026-06-15days on market $110,000 Active 42 DOM
-
2026-06-14pricedays on market $110,000 Active 40 DOM
-
2026-06-13days on market $115,500 Active 39 DOM
-
2026-06-10days on market $115,500 Active 37 DOM
-
2026-06-09days on market $115,500 Active 36 DOM
-
2026-06-08days on market $115,500 Active 35 DOM
-
2026-06-07days on market $115,500 Active 34 DOM
-
2026-06-02days on market $115,500 Active 29 DOM
-
2026-06-01days on market $115,500 Active 28 DOM
-
2026-05-31days on market $115,500 Active 27 DOM
-
2026-05-30days on market $115,500 Active 26 DOM
-
2026-04-29$120,000 Active 644-char remark
-
2026-03-18historical
-
2026-03-05price $119,900
-
2026-03-03price $123,900
-
2026-02-28price $126,900
-
2026-02-24price $129,900
-
2026-02-19price $139,900
-
2026-02-13price $149,900
-
2026-02-09price $156,900
-
2026-02-04$159,900 Active
ⓘ Source: listings_history table (triggers on properties + properties_extension) + one-shot
backfill from property_details.listing_events for pre-trigger history.
Tax reassessment forecast LA · Resets to sale price
- Current annual tax
- $1,022 · $85/mo
- Projected year-2 tax
- $1,022 · $85/mo
- Expected delta
- $0/yr ($0/mo · -0.0%)
ⓘ Screening estimate from a state-policy table — verify with the county assessor before closing.
Climate risk First Street
- Flood 1/10 Low FEMA zone X (unshaded) · 0% chance over 30 yrs
- Wildfire 4/10 Moderate
- Heat 7/10 Severe 7 d/yr ≥111°F today · 23 d/yr by 30 yrs out
- Wind 6/10 Major 51% chance of damaging wind over 30 yrs
- Air quality 1/10 Low 0 unhealthy d/yr today · 0 by 30 yrs out
Nearby sold comps map
Loading sold comps map…
Walkable amenities ~0.75 mi
Loading nearby amenities…
Taxation est. · year 1
- Rental income
- $15,432
- − Mortgage interest
- −$6,162
- − Property taxes
- −$1,022
- − Insurance
- −$550
- − Repairs & maintenance
- −$1,235
- − Management
- −$1,235
- − Depreciation
- −$3,200
- Taxable income
- $2,030
- Est. tax owed @ 24.0%
- −$487
- After-tax cash flow
- $3,210/yr
For passive investors: Depreciation is non-cash, so a rental often shows a tax loss while cash-flowing — sheltering income. Rental losses are passive: they offset passive income freely, and up to $25,000/yr can offset ordinary (W-2) income if you actively participate and your MAGI is under $100k (phasing out to $0 by $150k); unused losses carry forward. On sale, claimed depreciation is recaptured at up to 25%, and gains may owe capital-gains tax (a 1031 exchange can defer both). Figures are a year-1 estimate at your 24.0% rate — not tax advice; consult a CPA.
Schools (NCES district)
- District
- Webster Parish
- NCES district ID
- 2201890
- Math proficiency
- 17% ▼ -39.00%
- Reading proficiency
- 26% ▼ -38.00%
- Median HH income
- $33,011
- Composite
- 17.5/100
- National rank
- #9055
- State rank
- #67 of 98 in LA
Livability — Springhill
- Score
- 65/100
- State rank
- #139
- US rank
- #12517
Category grades
Schools grade is shown separately in the Schools card above.
Census & demographics
- Census place
- Springhill, LA
- Population (ZIP)
- 5,417
Population outlook (Webster County) Hauer SSP2
- Today (2025)
- 37,736 people
- By 2030
- 36,203 · -4.1%
- By 2040
- 32,988 · -12.6%
- By 2050
- 29,743 · -21.2%
- By 2075
- 22,346 · -40.8%
- By 2100
- 15,045 · -60.1%
Race, ethnicity, and origin ACS 2023
- Neighborhood character
- Diverse neighborhood (Simpson 0.56)
- Race & ethnicity
- White 56% Black 34% Hispanic / Latino 6% Two or more races 2% Native American 2%
- Hispanic origin (detail)
- Mexican 4%
- Common ancestry
- Iranian 4% Slovak 3% Lithuanian 2%
- Foreign-born
- 1% · Canada
- Languages at home
- 99% English-only · French/Haitian/Cajun 1% Spanish 1%
Political lean MEDSL · Webster
- 2024 margin
- Solid R (+36.5) · D 31.2% · R 67.7% · Other 1.1%
- 2008→2024 swing
- -10.2pp toward R · 2008: -26.3pp · 2024: -36.5pp
- All cycles
- 2024: R+36.5 2020: R+31.1 2016: R+29.1 2012: R+25.0 2008: R+26.3
Not yet ingested
- Civics
- —
Market trends
- HPI YoY
- ▲ 3.57%
- Current HPI
- 90.8938
- Rent YoY
- —
- Metro
- —
- State GDP YoY
- ▲ 3.29%
- F500 in state
- 10
Industry mix (Fortune 500 HQ in LA)
| Industry | F500 HQs | Revenue |
|---|---|---|
| Telecommunications | 2 | $23B |
|
||
| Utilities | 1 | $12B |
|
||
| Wholesale / Distribution | 1 | $5B |
|
||
| Advertising | 1 | $2B |
|
||
Price history
-31.2% since first listed12 events — show timeline
- 2026-06-13 Price Changed $110,000 NTREIS
- 2026-05-19 Price Changed $115,500 NTREIS
- 2026-04-29 Listed $120,000 NTREIS
- 2026-03-18 Listing Removed — NTREIS
- 2026-03-05 Price Changed $119,900 NTREIS
- 2026-03-03 Price Changed $123,900 NTREIS
- 2026-02-28 Price Changed $126,900 NTREIS
- 2026-02-24 Price Changed $129,900 NTREIS
- 2026-02-19 Price Changed $139,900 NTREIS
- 2026-02-13 Price Changed $149,900 NTREIS
- 2026-02-09 Price Changed $156,900 NTREIS
- 2026-02-04 Listed $159,900 NTREIS
Property tax history
+2.5%/yrLatest (2025): $1,022 · +2.2% YoY. Source: county tax records.
Cash-flow waterfall
monthlySold comps — $/sqft
last 12 mo · ≤1 miLoading sold comps…