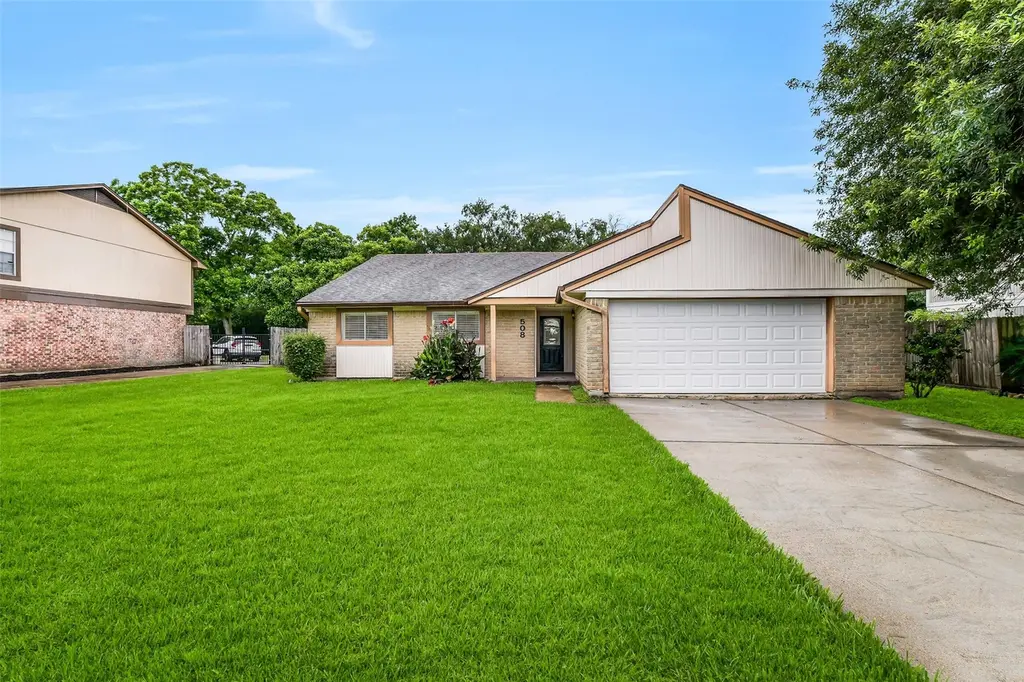
508 E Castle Harbour Dr · Friendswood, TX
Flood risk 6/10 · Moderate
- FEMA flood zone
- X (unshaded)
- Chance of flooding over 30 yrs
- 0.84%
- Est. flood insurance / yr
- $507 – $1,088
Fire risk 2/10 · Minimal
- Est. fire insurance / yr
- $1,222 – $2,270
Heat risk 9/10 · Severe
- Hot days now (above 107°F)
- 7 days/yr
- Hot days in 30 yrs
- 25 days/yr
Wind risk 9/10 · Severe
- Chance of severe wind over 30 yrs
- 99.0%
Air-quality risk 2/10 · Minimal
- Unhealthy air days now
- 1 days/yr
- Unhealthy air days in 30 yrs
- 1 days/yr
Risk factors via First Street. Map © Google.
Why this score? — see what drove the D- grade
The composite is a weighted blend of 9 inputs, each scored 0–100. Each bar is that input's sub-score; the figure is the points it added to the 100-point composite (weight × sub-score).
- Cash flow +10.5/30.0
- Schools +6.1/10.0
- ARV discount +5.2/15.0
- Livability +3.5/5.0
- 1% rule +3.3/10.0
- Rent growth +3.2/5.0
- DSCR +3.0/10.0
- Condition / age +2.5/5.0
- Appreciation +0.0/10.0
$325,000
🖨 Deal sheet 📄 Offer letter ✓ Due diligence
Listing remarks MLS
Charming, updated single story 3/2 bungalow in established Sunmeadow subdivision in FISD! Home boasts wood-look laminate flooring, vaulted ceiling, fresh interior paint, recessed lighting, updated ceiling fans, kitchen with breakfast bar, 5 burner glass cooktop, and spacious laundry room nearby. Oversized bedrooms with updated bathrooms that include granite countertops, framed mirrors, and a glass door shower with river rock floor! Outdoors, a peaceful backyard shaded by Bradford Pear trees offers a built-in fire pit and no back neighbors.
Key facts
- Dual sinks
- Walk-in closet
- Granite countertops
Tags
Property features AI
Finance
- Other: Full ownership
- HOA & community: Sunmeadow Community Improvement association with an $83 annual fee
Exterior
- Parking: Attached garage (2 spaces)
- Utilities: Public water; Public sewer
- Home design: Residential property; Faces east; Built in 1978; Slab foundation
- Construction: Brick and vinyl siding; Composition roof
- Exterior features: Concrete road access; Subdivision lot
Interior
- Kitchen: Double oven; Electric oven; Electric range; Dishwasher; Disposal; Microwave
- Bedrooms: Three bedrooms on the first floor (approx. 10x12, 11x13, 14x19)
- Flooring: Carpet; Laminate; Tile
- Bathrooms: Two full bathrooms
- Heating & cooling: Central heating (electric); Central air (electric)
- Interior features: Wet bar; Breakfast bar; Double vanity; High ceilings; Vaulted ceilings; Laminate countertops
- Laundry & utility: Washer hookup; Electric dryer hookup; Gas dryer hookup
Neighborhood map
What this means for you Summary
Snapshot
- This is a 3-bed/2.0-bath single-family listed at $325k.
Deal economics
- At list price, monthly cash flow is $-168 ($-2k/yr) — negative.
- To cash-flow at today's rent, offer at most $295k (9.1% below list).
- To meet the 1% rule (rent ≥ 1% of price), the offer needs to be $270k (16.9% below list).
- Recommended offer: $270k (16.9% below list) — sets the bar for 1% rule.
- Cap rate 5.7% vs local median 2.3% in Friendswood — top-decile yield for the area; either an underpriced asset or a hidden risk that comps aren't pricing in. Stress-test before assuming the spread holds.
Location & tenants
- Location reads 70/100 on livability (#338 in TX) — a middle-class / working-renter tenant base. Strengths: crime A+, employment A+, housing A+; Watch: amenities F, commute F, health & safety F.
- Friendswood ISD (suburban): math 64% / reading 65% proficiency, ranked #15 of 826 in TX (top 2%) — acceptable for families but not a draw, mixed tenant base, ~2y average lease; only 8% free/reduced lunch — higher-income household profile.
- Zoned schools: Friendswood J H (math 62% / reading 59%, grade B+, #154 of 1,662 statewide, top 9%, 1,467 students, 0% FRL); Friendswood H S (math 61% / reading 76%, grade B, #144 of 1,632 statewide, top 9%, 1,980 students, 0% FRL).
- Market conditions: Rents rising (+2.7%/yr); 502 active listings in the ZIP; 1 comparable units currently listed for rent nearby; high-income renter base; 3,258 units permitted in Galveston County in 2024 (0 in 5+ unit buildings).
Forward outlook
- Local home prices are declining (-3.0%/yr); year-one equity from $2k of loan paydown is wiped out by about $10k of value loss. Plan a longer hold.
- Galveston County population projected at +43% by 2050 — long-run rental-demand tailwind backs the buy-and-hold thesis.
Negotiation context
- It's been on market 21 days — a 2% lower offer ($320k) is reasonable based on typical stale-listing flexibility.
- 3 sale attempts since 17y ago with the ask held roughly flat each time — persistent listings suggest the price (not the market) is what's stuck; bring a comps-based counter.
Risks & watch-outs
- Climate carrying-cost: major flood risk; severe wind risk, 99% chance of damaging wind over 30y; extreme-heat days projected 7→25/yr by 2055 (HVAC capex compounding) — expect insurance premiums to compound above CPI over the hold.
Questions for the listing agent
- What do current leases actually rent for vs. the listed asking? Can we see a recent rent roll and the last 12 months of T-12 income?
- Built in 1978 — when were the roof, HVAC, electrical panel, plumbing, and water heater last replaced?
- What does the HOA fee cover, when was the last increase, and are there any pending special assessments or reserve-fund shortfalls?
- Is there a deadline driving the sale (1031 exchange, divorce, estate, relocation)? That informs how much negotiation room exists.
- Schools are A-rated — typically a magnet for longer-tenancy family renters. What's the average tenant stay here, and is there a school-zone premium baked into asking?
- The area grade is low — what's the realistic commute time and amenity access for the typical tenant pool here? Any planned neighborhood developments (good or bad) we should know about?
- What's the average days-on-market for RENTAL listings here right now (not sales)? A rising rental-DOM trend means longer vacancies and softer asking-rent achievability than the comps imply.
- What's the recent tenant-quality profile in this submarket — average credit score on applications, eviction rate, late-payment / NSF rate, and stable-employment percentage? A property-management company in the area should have these aggregated.
- How much new for-sale + rental construction is in the pipeline within 1–3 miles? Heavy new supply typically softens prices + rents 12–24 months out; constrained supply supports both.
Investment metrics
- 1% rule
- 0.83% ✗
- Cap rate
- 5.67%
- Cash-on-cash
- -2.21%
- DSCR
- 0.90
- GRM
- 10.0
CMA / ARV
- ARV (on-the-fly)
- $309,488
- Comps found
- 12
Show comp detail 12 sales within ~0.75 mi
| Address | Dist | Beds/Ba | Sqft | Sold | Price | $/sf | Match |
|---|---|---|---|---|---|---|---|
| 644 E Castle Harbour Dr | 0.23mi | 3/2.0 | 1,692 (+1%) | 6mo | $260,000 | $154 | 83 |
| 528 Belmont Dr | 0.27mi | 3/2.0 | 1,608 (-4%) | 0mo | $325,000 | $202 | 80 |
| 621 W Castle Harbour Dr | 0.28mi | 3/2.0 | 1,608 (-4%) | 1mo | $349,900 | $218 | 79 |
| 602 W Castle Harbour Dr | 0.34mi | 3/2.0 | 1,608 (-4%) | 3mo | $310,000 | $193 | 74 |
| 235 E Castle Harbour Dr | 0.50mi | 3/2.0 | 1,712 (+2%) | 10mo | $305,000 | $178 | 66 |
| 406 W W Castle Harbour Dr | 0.40mi | 3/2.0 | 1,756 (+4%) | 12mo | $305,000 | $174 | 64 |
| 402 W Castle Harbour Dr | 0.41mi | 4/2.0 (+1) | 1,804 (+7%) | 2mo | $350,000 | $194 | 62 |
| 408 Broadmoor St | 0.34mi | 3/2.0 | 1,884 (+12%) | 4mo | $329,900 | $175 | 61 |
| 2403 S Mission Cir | 0.66mi | 3/2.0 | 1,624 (-3%) | 12mo | $329,000 | $203 | 53 |
| 501 Point Clear Dr | 0.36mi | 4/2.0 (+1) | 1,872 (+11%) | 12mo | $289,000 | $154 | 49 |
| 1803 Presidio St | 0.56mi | 3/2.0 | 1,893 (+12%) | 11mo | $325,000 | $172 | 44 |
| 2514 S Mission Cir | 0.70mi | 3/2.0 | 1,842 (+10%) | 9mo | $339,000 | $184 | 44 |
Match score weights: distance 35% · size 25% · config 20% · recency 20%. Top-matched comps best support the ARV.
Projected returns pro-forma
-3.0% appreciation · 2.74% rent growth · sell at horizon
- IRR
- -20.2%
- Equity multiple
- 0.30×
- Total profit
- $-63,983
- Equity at exit
- $48,459
- IRR
- -13.8%
- Equity multiple
- 0.21×
- Total profit
- $-72,051
- Equity at exit
- $28,100
Cash invested: $91,000 (down + closing). Projections, not guarantees.
Landlord ↔ Tenant lean methodology
- Overall (STATE)
- 87 Strongly Landlord-Friendly
- State Texas
- 87 Strongly Landlord-Friendly · R+5
- County
- — inherits STATE
- City
- — inherits STATE
ZIP-level market 77546
- Rents YoY
- 2.7%
- Active inventory
- 502
- Price-to-rent
- 10.0×
Monthly cashflow live
- Estimated rent
- $2,700 medium interval (Pro) →
- Mortgage (P&I)
- −$1,704
- Tax from tax record
- −$454 /mo · $5,452/yr
- Insurance
- −$135
- HOA
- −$7
- Vacancy / Maint / Mgmt
- −$567
- Net cashflow
- $-168
Break-even live
UW: 25.0% down · 7.5% · 30yr · 1.5% tax · 5.0% vac · 8.0% maint · 8.0% mgmt
Financing live
Cash to close
- Down payment
- $81,250
- Closing costs
- $9,750
- Reserves months
- —
- Total cash needed
- —
Loan-product check · same deal, 3 products live
Conventional
25% down · 7.5% · 30yr
- Down + closing
- —
- Monthly P&I
- —
- Monthly cashflow
- —
- DSCR
- —
- Eligible?
- —
Personal DTI + credit; lowest rate.
DSCR
20% down · 8.5% · 30yr
- Down + closing
- —
- Monthly P&I
- —
- Monthly cashflow
- —
- DSCR
- —
- Eligible?
- —
No personal income docs; deal must DSCR.
Hard money
10% down · 12.0% · 12mo
- Down + closing
- —
- Monthly P&I
- —
- Monthly cashflow
- —
- DSCR
- —
- Eligible?
- —
Short-term bridge; refi at stabilization.
Rent comps 1 comps
| Address | Beds | Baths | Sqft | Rent | $/sqft | DOM | Units | Dist |
|---|---|---|---|---|---|---|---|---|
| 206 Saint Cloud Dr Unit 1472546P Friendswood, TX | 3.0 | 2.0 | 2045 | $4,662 | $2.28 | 1d | 1 | 0.80mi |
HOA detail
- Monthly dues
- $7 · $84/yr
Listing history 22 events
-
2026-06-18days on market $325,000 Active 21 DOM
-
2026-06-17days on market $325,000 Active 20 DOM
-
2026-06-16days on market $325,000 Active 19 DOM
-
2026-06-15days on market $325,000 Active 18 DOM
-
2026-06-13days on market $325,000 Active 16 DOM
-
2026-06-09days on market $325,000 Active 12 DOM
-
2026-06-08days on market $325,000 Active 11 DOM
-
2026-06-07days on market $325,000 Active 10 DOM
-
2026-06-04days on market $325,000 Active 7 DOM
-
2026-06-03days on market $325,000 Active 6 DOM
-
2026-06-02days on market $325,000 Active 5 DOM
-
2026-06-01days on market $325,000 Active 4 DOM
-
2026-05-31days on market $325,000 Active 3 DOM
-
2026-05-28$325,000 Active
-
2018-03-05soldstatus
-
2018-03-02soldstatus Sold 547-char remark
Show marketing remark (547 chars)
Charming, updated single story 3/2 bungalow in established Sunmeadow subdivision in FISD! Home boasts wood-look laminate flooring, vaulted ceiling, fresh interior paint, recessed lighting, updated ceiling fans, kitchen with breakfast bar, 5 burner glass cooktop, and spacious laundry room nearby. Oversized bedrooms with updated bathrooms that include granite countertops, framed mirrors, and a glass door shower with river rock floor! Outdoors, a peaceful backyard shaded by Bradford Pear trees offers a built-in fire pit and no back neighbors.
-
2018-01-25status Pending 547-char remark
Show marketing remark (547 chars)
Charming, updated single story 3/2 bungalow in established Sunmeadow subdivision in FISD! Home boasts wood-look laminate flooring, vaulted ceiling, fresh interior paint, recessed lighting, updated ceiling fans, kitchen with breakfast bar, 5 burner glass cooktop, and spacious laundry room nearby. Oversized bedrooms with updated bathrooms that include granite countertops, framed mirrors, and a glass door shower with river rock floor! Outdoors, a peaceful backyard shaded by Bradford Pear trees offers a built-in fire pit and no back neighbors.
-
2018-01-16status Option Pending 547-char remark
Show marketing remark (547 chars)
Charming, updated single story 3/2 bungalow in established Sunmeadow subdivision in FISD! Home boasts wood-look laminate flooring, vaulted ceiling, fresh interior paint, recessed lighting, updated ceiling fans, kitchen with breakfast bar, 5 burner glass cooktop, and spacious laundry room nearby. Oversized bedrooms with updated bathrooms that include granite countertops, framed mirrors, and a glass door shower with river rock floor! Outdoors, a peaceful backyard shaded by Bradford Pear trees offers a built-in fire pit and no back neighbors.
-
2018-01-11$189,900 Active 547-char remark
Show marketing remark (547 chars)
Charming, updated single story 3/2 bungalow in established Sunmeadow subdivision in FISD! Home boasts wood-look laminate flooring, vaulted ceiling, fresh interior paint, recessed lighting, updated ceiling fans, kitchen with breakfast bar, 5 burner glass cooktop, and spacious laundry room nearby. Oversized bedrooms with updated bathrooms that include granite countertops, framed mirrors, and a glass door shower with river rock floor! Outdoors, a peaceful backyard shaded by Bradford Pear trees offers a built-in fire pit and no back neighbors.
-
2009-01-30historical
-
2009-01-02$129,900
-
2007-10-05soldstatus
ⓘ Source: listings_history table (triggers on properties + properties_extension) + one-shot
backfill from property_details.listing_events for pre-trigger history.
Tax reassessment forecast TX · Resets to sale price
- Current annual tax
- $5,452 · $454/mo
- Projected year-2 tax
- $5,948 · $496/mo
- Expected delta
- +$496/yr (+$41/mo · 9.1%)
ⓘ Screening estimate from a state-policy table — verify with the county assessor before closing.
Climate risk First Street
- Flood 6/10 Major FEMA zone X (unshaded) · 84% chance over 30 yrs
- Wildfire 2/10 Low
- Heat 9/10 Extreme 7 d/yr ≥107°F today · 25 d/yr by 30 yrs out
- Wind 9/10 Extreme 99% chance of damaging wind over 30 yrs
- Air quality 2/10 Low 1 unhealthy d/yr today · 1 by 30 yrs out
Nearby sold comps map
Loading sold comps map…
Walkable amenities ~0.75 mi
Loading nearby amenities…
Taxation est. · year 1
- Rental income
- $32,404
- − Mortgage interest
- −$18,205
- − Property taxes
- −$5,452
- − Insurance
- −$1,625
- − Repairs & maintenance
- −$2,592
- − Management
- −$2,592
- − HOA
- −$84
- − Depreciation
- −$9,455
- Taxable loss
- −$7,601
- Est. tax savings @ 24.0%
- +$1,824
- After-tax cash flow
- $-190/yr
For passive investors: Depreciation is non-cash, so a rental often shows a tax loss while cash-flowing — sheltering income. Rental losses are passive: they offset passive income freely, and up to $25,000/yr can offset ordinary (W-2) income if you actively participate and your MAGI is under $100k (phasing out to $0 by $150k); unused losses carry forward. On sale, claimed depreciation is recaptured at up to 25%, and gains may owe capital-gains tax (a 1031 exchange can defer both). Figures are a year-1 estimate at your 24.0% rate — not tax advice; consult a CPA.
Schools (NCES district)
- District
- Friendswood ISD
- NCES district ID
- 4819950
- Math proficiency
- 64% ▼ -12.00%
- Reading proficiency
- 65% ▼ -6.00%
- Median HH income
- $109,699
- Composite
- 60.52/100
- National rank
- #841
- State rank
- #15 of 826 in TX
Livability — Friendswood
- Score
- 70/100
- State rank
- #338
- US rank
- #7362
Category grades
Schools grade is shown separately in the Schools card above.
Census & demographics
- Census place
- Friendswood, TX
- County
- Galveston County · 357,330 people
- City population
- 54,789
- Metro
- Houston-The Woodlands-Sugar Land, TX
- Population (ZIP)
- 54,789
- Household income
- $123,756
- Rent vs Own
- Severe rent burden
- 1350.0
Population outlook (Galveston County) Hauer SSP2
- Today (2025)
- 390,640 people
- By 2030
- 425,226 · +8.9%
- By 2040
- 493,765 · +26.4%
- By 2050
- 559,698 · +43.3%
- By 2075
- 719,260 · +84.1%
- By 2100
- 819,628 · +109.8%
Race, ethnicity, and origin ACS 2023
- Neighborhood character
- Predominantly White (67%)
- Race & ethnicity
- White 67% Hispanic / Latino 17% Two or more races 11% Asian 7% Black 4%
- Hispanic origin (detail)
- Mexican 13%
- Common ancestry
- Lithuanian 3% Italian 3% Romanian 2%
- Foreign-born
- 10% · Canada, Vietnam, China
- Languages at home
- 84% English-only · Spanish 7% Other Indo-European 3% Vietnamese 2%
Political lean MEDSL · Galveston
- 2024 margin
- Strong R (+27.4) · D 35.7% · R 63.1% · Other 1.2%
- 2008→2024 swing
- -7.9pp toward R · 2008: -19.5pp · 2024: -27.4pp
- All cycles
- 2024: R+27.4 2020: R+22.6 2016: R+22.6 2012: R+26.9 2008: R+19.5
Not yet ingested
- Civics
- —
Market trends
- HPI YoY
- ▼ -160.03%
- Current HPI
- 243.7934
- Rent YoY
- ▲ 2.74%
- Metro
- Houston-The Woodlands-Sugar Land, TX
- State GDP YoY
- ▲ 3.95%
- F500 in state
- 110
Industry mix (Fortune 500 HQ in TX)
| Industry | F500 HQs | Revenue |
|---|---|---|
| Energy | 16 | $1,198B |
|
||
| Technology | 5 | $198B |
|
||
| Engineering / Construction | 4 | $72B |
|
||
| Energy Services | 3 | $60B |
|
||
| Utilities | 3 | $41B |
|
||
| Healthcare | 2 | $330B |
|
||
Price history
+150.2% since first listed9 events — show timeline
- 2026-05-28 Listed $325,000 HARMLS
- 2018-03-05 Sold (Public Records) — Public Records
- 2018-03-02 Sold (MLS) — HARMLS
- 2018-01-25 Pending — HARMLS
- 2018-01-16 Pending — HARMLS
- 2018-01-11 Listed $189,900 HARMLS
- 2009-01-30 Listing Removed — HARMLS
- 2009-01-02 Listed $129,900 HARMLS
- 2007-10-05 Sold (Public Records) — Public Records
Property tax history
+6.1%/yrLatest (2025): $5,452 · +7.0% YoY. Source: county tax records.
Cash-flow waterfall
monthlySold comps — $/sqft
last 12 mo · ≤1 miLoading sold comps…