 Fourplex
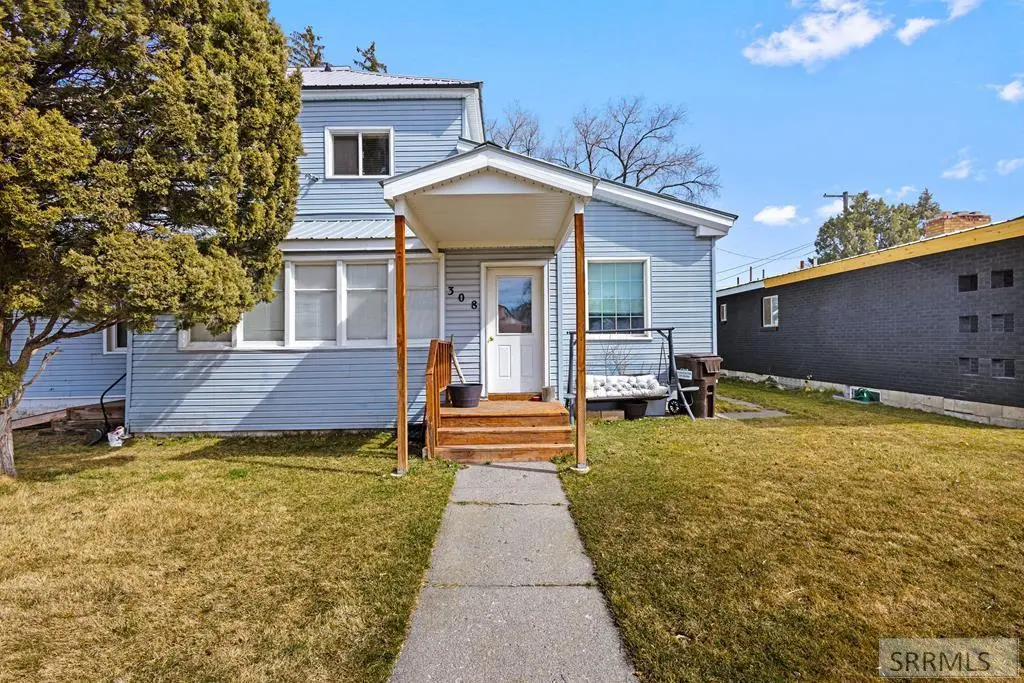
308 E 3rd N Unit 1-4 · St. Anthony, ID
Flood risk 1/10 · Minimal
- FEMA flood zone
- X
- Chance of flooding over 30 yrs
- 0.0%
- Est. flood insurance / yr
- $507 – $1,088
Fire risk 4/10 · Minor
- Est. fire insurance / yr
- $584 – $1,086
Heat risk 2/10 · Minimal
- Hot days now (above 89°F)
- 7 days/yr
- Hot days in 30 yrs
- 17 days/yr
Wind risk 1/10 · Minimal
- Chance of severe wind over 30 yrs
- —
Air-quality risk 5/10 · Moderate
- Unhealthy air days now
- 7 days/yr
- Unhealthy air days in 30 yrs
- 9 days/yr
Risk factors via First Street. Map © Google.
Why this score? — see what drove the D+ grade
The composite is a weighted blend of 9 inputs, each scored 0–100. Each bar is that input's sub-score; the figure is the points it added to the 100-point composite (weight × sub-score).
- Cash flow +12.7/30.0
- Appreciation +10.0/10.0
- ARV discount +7.5/15.0
- DSCR +3.8/10.0
- 1% rule +3.6/10.0
- Schools +3.4/10.0
- Condition / age +2.8/5.0
- Rent growth +2.5/5.0
- Livability +2.5/5.0
$465,000
🖨 Deal sheet 📄 Offer letter ✓ Due diligence
Multi-family units
County records classify this as Multi-Family (2-4 Unit). Listing-text estimate: 4 units. confirmed
Listing remarks
This well-maintained fourplex offers a total of seven bedrooms and four bathrooms, thoughtfully distributed across four functional units. Each unit features a practical layout with comfortable living spaces and plenty of natural light, creating an inviting environment for residents. Whether you're looking to expand your investment portfolio or occupy one unit while generating income from the others, this property provides strong flexibility.
Key facts
- 7,841 sq ft lot
- 2 garage spots
- Built 1900
Neighborhood map
What this means for you Summary
Snapshot
- This is a 4 × 3-bed/1.5-bath units multifamily listed at $465k. Condition is rated average.
Deal economics
- At list price, monthly cash flow is $-47 ($-566/yr) — negative. Per door: $-12/mo.
- To cash-flow at today's rent, offer at most $458k (1.5% below list).
- To meet the 1% rule (rent ≥ 1% of price), the offer needs to be $401k (13.8% below list).
- Recommended offer: $401k (13.8% below list) — sets the bar for 1% rule.
Location & tenants
- Location reads: area grade D — affects rentability + tenant quality, not the cash-flow math above.
- Fremont County Joint District (rural): math 37% / reading 44% proficiency, ranked #63 of 92 in ID (top 68%) — families likely to look elsewhere, expect single-tenant / working-renter base with shorter leases.
- Zoned schools: South Fremont Jr High (math 30% / reading 42%, grade F, #78 of 109 statewide, top 72%, 365 students, 49% FRL); South Fremont High School (math 27% / reading 67%, grade D-, #55 of 169 statewide, top 34%, 457 students, 40% FRL) — zoned schools at 44% FRL track the district average.
- Market conditions: 129 active listings in the ZIP; 135 units permitted in Fremont County in 2024 (0 in 5+ unit buildings).
Forward outlook
- In year one you build about $50k of equity ($3k loan paydown + $46k appreciation (10.0% local appreciation)).
- Fremont County population projected at -21% by 2050 — secular population decline; favor cash flow + early exit over multi-decade hold.
- At projected returns (10.0% appreciation + 3.0% rent growth), your $130k cash investment doubles in ~3 years — after that, you're playing with house money.
- By year 2, paydown + projected appreciation supports a ~$80k cash-out refi (75% LTV) — recoverable capital for the next deal without selling this one.
Negotiation context
- It's been on market 33 days — a 3% lower offer ($451k) is reasonable based on typical stale-listing flexibility.
Risks & watch-outs
- Watch-outs: built in 1900 — expect roof / HVAC / electrical / plumbing capex.
Questions for the listing agent
- What do current leases actually rent for vs. the listed asking? Can we see a recent rent roll and the last 12 months of T-12 income?
- It's been on market 33 days. Have you received any prior offers? Is the seller open to a 14% concession, seller financing, or rate buy-down credit?
- Can we see the unit-by-unit rent roll, current vacancy, and any below-market leases? What's the average tenancy length?
- What capital expenditures (roof, boiler, parking lot, exteriors) have been made in the last 5 years, and what's planned in the next 2?
- Built in 1900 — when were the roof, HVAC, electrical panel, plumbing, and water heater last replaced?
- Is there a deadline driving the sale (1031 exchange, divorce, estate, relocation)? That informs how much negotiation room exists.
- The area grade is low — what's the realistic commute time and amenity access for the typical tenant pool here? Any planned neighborhood developments (good or bad) we should know about?
- What's the average days-on-market for RENTAL listings here right now (not sales)? A rising rental-DOM trend means longer vacancies and softer asking-rent achievability than the comps imply.
- What's the recent tenant-quality profile in this submarket — average credit score on applications, eviction rate, late-payment / NSF rate, and stable-employment percentage? A property-management company in the area should have these aggregated.
- How much new apartment / multifamily construction is in the pipeline within 1–3 miles? Heavy new supply (>2% of stock underway) typically softens rents 12–24 months out; light construction supports rent growth.
Investment metrics
- 1% rule
- 0.86% ✗
- Cap rate
- 6.17%
- Cash-on-cash
- -0.43%
- DSCR
- 0.98
- GRM
- 9.7
CMA / ARV
No comps found within radius.
Projected returns pro-forma
10.0% appreciation · 3.0% rent growth · sell at horizon
- IRR
- 24.0%
- Equity multiple
- 2.92×
- Total profit
- $250,306
- Equity at exit
- $418,909
- IRR
- 21.3%
- Equity multiple
- 6.68×
- Total profit
- $739,594
- Equity at exit
- $903,393
Cash invested: $130,200 (down + closing). Projections, not guarantees.
Landlord ↔ Tenant lean methodology
- Overall (STATE)
- 91 Strongly Landlord-Friendly
- State Idaho
- 91 Strongly Landlord-Friendly · R+18
- County
- — inherits STATE
- City
- — inherits STATE
ZIP-level market 83445
- Home prices YoY
- 10.2%
- Active inventory
- 129
- Price-to-rent
- 38.7×
Monthly cashflow live
- Estimated rent
- $4,008 medium interval (Pro) →
- Mortgage (P&I)
- −$2,439
- Tax est. 1.5%
- −$581 /mo · $6,975/yr
- Insurance
- −$194
- HOA
- −$0
- Vacancy / Maint / Mgmt
- −$842
- Net cashflow
- $-47
Break-even live
4-unit breakdown (identical units grouped — click to expand)
| Units | Beds | Baths | Est. rent |
|---|---|---|---|
| 4× units | 3 | 1.5 | $4,008 |
| #1 | 3 | 1.5 | $1,002 |
| #2 | 3 | 1.5 | $1,002 |
| #3 | 3 | 1.5 | $1,002 |
| #4 | 3 | 1.5 | $1,002 |
| Total (4 units) | $4,008 | ||
UW: 25.0% down · 7.5% · 30yr · 1.5% tax · 5.0% vac · 8.0% maint · 8.0% mgmt
Financing live
Cash to close
- Down payment
- $116,250
- Closing costs
- $13,950
- Reserves months
- —
- Total cash needed
- —
Loan-product check · same deal, 3 products live
Conventional
25% down · 7.5% · 30yr
- Down + closing
- —
- Monthly P&I
- —
- Monthly cashflow
- —
- DSCR
- —
- Eligible?
- —
Personal DTI + credit; lowest rate.
DSCR
20% down · 8.5% · 30yr
- Down + closing
- —
- Monthly P&I
- —
- Monthly cashflow
- —
- DSCR
- —
- Eligible?
- —
No personal income docs; deal must DSCR.
Hard money
10% down · 12.0% · 12mo
- Down + closing
- —
- Monthly P&I
- —
- Monthly cashflow
- —
- DSCR
- —
- Eligible?
- —
Short-term bridge; refi at stabilization.
Listing history 2 events
-
2026-04-26status Pending
-
2026-03-24$465,000 Active
ⓘ Source: listings_history table (triggers on properties + properties_extension) + one-shot
backfill from property_details.listing_events for pre-trigger history.
Climate risk First Street
- Flood 1/10 Low FEMA zone X · 0% chance over 30 yrs
- Wildfire 4/10 Moderate
- Heat 2/10 Low 7 d/yr ≥89°F today · 17 d/yr by 30 yrs out
- Wind 1/10 Low
- Air quality 5/10 Major 7 unhealthy d/yr today · 9 by 30 yrs out
Nearby sold comps map
Loading sold comps map…
Walkable amenities ~0.75 mi
Loading nearby amenities…
Taxation est. · year 1
- Rental income
- $48,096
- − Mortgage interest
- −$26,047
- − Property taxes
- −$6,975
- − Insurance
- −$2,325
- − Repairs & maintenance
- −$3,848
- − Management
- −$3,848
- − Depreciation
- −$13,527
- Taxable loss
- −$8,474
- Est. tax savings @ 24.0%
- +$2,034
- After-tax cash flow
- $1,467/yr
For passive investors: Depreciation is non-cash, so a rental often shows a tax loss while cash-flowing — sheltering income. Rental losses are passive: they offset passive income freely, and up to $25,000/yr can offset ordinary (W-2) income if you actively participate and your MAGI is under $100k (phasing out to $0 by $150k); unused losses carry forward. On sale, claimed depreciation is recaptured at up to 25%, and gains may owe capital-gains tax (a 1031 exchange can defer both). Figures are a year-1 estimate at your 24.0% rate — not tax advice; consult a CPA.
Condition & rehab AI · 12 photos
This fourplex requires moderate renovations to update kitchens and exterior, but presents a good investment opportunity with strong flexibility.
Repairs flagged
- Moderate kitchen cabinets — dated and worn
- Moderate kitchen countertops — dated and worn
- Moderate kitchen appliances — dated and worn
- Minor bathroom fixtures — standard and functional
Value-add opportunities
- Both update kitchen cabinets and countertops — modernizing kitchen will appeal to buyers and renters
- Both paint interior walls — fresh paint enhances curb appeal and interior aesthetics
- Both replace carpet with hardwood or tile — updated flooring will improve both resale and rental value
- Both repair and paint exterior siding — improved exterior will boost curb appeal and value
- Both service and replace HVAC system — modern and efficient HVAC will improve comfort and energy efficiency
Renovation cost estimate screening
| Repair item | Severity | Est. cost |
|---|---|---|
| kitchen cabinets · dated and worn | Moderate | $3,000–15,000 |
| kitchen countertops · dated and worn | Moderate | $3,000–15,000 |
| kitchen appliances · dated and worn | Moderate | $3,000–15,000 |
| bathroom fixtures · standard and functional | Minor | $500–3,000 |
| Total estimated repair cost · 4 items | $9,500–48,000 |
Value-add ROI direction
- Both update kitchen cabinets and countertops — modernizing kitchen will appeal to buyers and renters ↑
- Both paint interior walls — fresh paint enhances curb appeal and interior aesthetics ↑
- Both replace carpet with hardwood or tile — updated flooring will improve both resale and rental value ↑
- Both repair and paint exterior siding — improved exterior will boost curb appeal and value ↑
- Both service and replace HVAC system — modern and efficient HVAC will improve comfort and energy efficiency ↑
ⓘ Cost ranges are severity-bucket heuristics (US national rule-of-thumb). Get contractor quotes + a written scope before underwriting a rehab budget.
Schools (NCES district)
- District
- Fremont County Joint District
- NCES district ID
- 1601110
- Math proficiency
- 37% ▲ 1.00%
- Reading proficiency
- 44% ▼ -2.00%
- Median HH income
- $45,591
- Composite
- 34.47/100
- National rank
- #5187
- State rank
- #63 of 92 in ID
Livability — St. Anthony
No livability data for this city. (Only ~50 U.S. cities are tracked.)
Census & demographics
- Census place
- St. Anthony, ID
- Population (ZIP)
- 7,514
Population outlook (Fremont County) Hauer SSP2
- Today (2025)
- 12,247 people
- By 2030
- 11,817 · -3.5%
- By 2040
- 10,832 · -11.6%
- By 2050
- 9,725 · -20.6%
- By 2075
- 6,685 · -45.4%
- By 2100
- 3,942 · -67.8%
Race, ethnicity, and origin ACS 2023
- Neighborhood character
- Predominantly White (77%)
- Race & ethnicity
- White 77% Hispanic / Latino 17% Two or more races 6% Native American 2%
- Hispanic origin (detail)
- Mexican 15% Puerto Rican 1%
- Common ancestry
- Slovak 3% Portuguese 3% Lithuanian 3%
- Foreign-born
- 6% · Canada
- Languages at home
- 88% English-only · Spanish 12%
Political lean MEDSL · Fremont
- 2024 margin
- Solid R (+69.0) · D 14.0% · R 83.0% · Other 3.0%
- 2008→2024 swing
- -7.1pp toward R · 2008: -61.8pp · 2024: -69.0pp
- All cycles
- 2024: R+69.0 2020: R+67.7 2016: R+60.2 2012: R+70.6 2008: R+61.8
Not yet ingested
- Civics
- —
Market trends
- HPI YoY
- ▲ 52.68%
- Current HPI
- 568.0
- Rent YoY
- —
- Metro
- —
- State GDP YoY
- ▲ 4.51%
- F500 in state
- 6
Industry mix (Fortune 500 HQ in ID)
| Industry | F500 HQs | Revenue |
|---|---|---|
| Retail | 1 | $79B |
|
||
| Technology | 1 | $25B |
|
||
| Food / Agriculture | 1 | $6B |
|
||
Price history
2 events — show timeline
- 2026-04-26 Pending — SRMLS
- 2026-03-24 Listed $465,000 SRMLS
Cash-flow waterfall
monthlySold comps — $/sqft
last 12 mo · ≤1 miLoading sold comps…