 Duplex
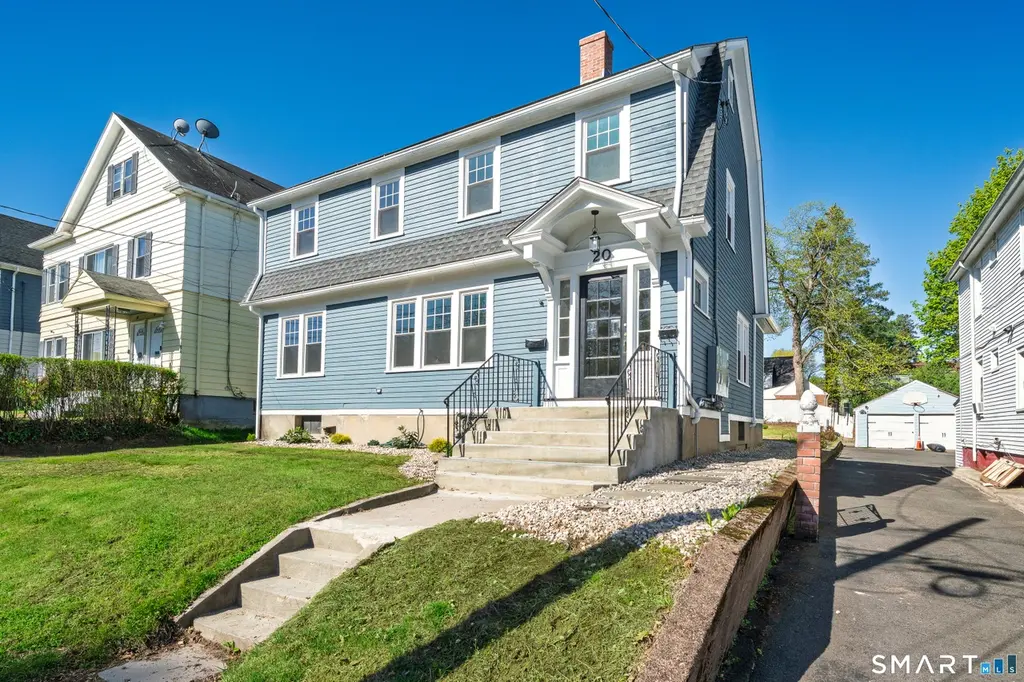
20 Mountain St · Hartford, CT
Flood risk 1/10 · Minimal
- FEMA flood zone
- X (unshaded)
- Chance of flooding over 30 yrs
- 0.0%
- Est. flood insurance / yr
- $473 – $860
Fire risk 1/10 · Minimal
- Est. fire insurance / yr
- $829 – $1,539
Heat risk 5/10 · Moderate
- Hot days now (above 96°F)
- 7 days/yr
- Hot days in 30 yrs
- 16 days/yr
Wind risk 6/10 · Moderate
- Chance of severe wind over 30 yrs
- 27.0%
Air-quality risk 3/10 · Minor
- Unhealthy air days now
- 3 days/yr
- Unhealthy air days in 30 yrs
- 4 days/yr
Risk factors via First Street. Map © Google.
Why this score? — see what drove the C grade
The composite is a weighted blend of 9 inputs, each scored 0–100. Each bar is that input's sub-score; the figure is the points it added to the 100-point composite (weight × sub-score).
- Cash flow +17.4/30.0
- ARV discount +15.0/15.0
- Appreciation +5.7/10.0
- DSCR +5.4/10.0
- 1% rule +4.1/10.0
- Livability +3.8/5.0
- Rent growth +3.1/5.0
- Condition / age +2.5/5.0
- Schools +1.4/10.0
$420,000
🖨 Deal sheet 📄 Offer letter ✓ Due diligence
Multi-family units
County records classify this as Multi-Family (2-4 Unit). Listing-text estimate: 2 units. confirmed
Listing remarks
* * MULTIPLE OFFERS: H & B SUNDAY 6PM * * Fully remodeled and move-in ready 2-family in the Southwest area of Hartford. This turnkey property has undergone extensive renovations with all work permitted and approved, offering peace of mind for both owner-occupants and investors alike. Improvements include updated plumbing and electrical systems, all new windows, whole home insulation, updated gutters and downspouts, refinished hardwood flooring, fresh interior and exterior paint, beautifully renovated kitchens and bathrooms, new porches decking and hardscaping, roof is approx 10yo. The home features two separate units located on different floors. Each unit offers bright, refreshed liv
Key facts
- 7,405 sq ft lot
- Built 1925
- Listed 6 days
Property features AI
Finance
- Other: Living area reported as 2,110 (public record)
- Financial info: No investor-specific income or expense details provided
- HOA & community: No HOA information provided
Exterior
- Parking: No parking details provided
- Security: No security details provided
- Utilities: Public water connected; Public sewer connected; Natural gas hot water
- Home design: Multi-family 2-family property; Blue exterior
- Construction: Frame construction with wood siding; Concrete foundation; Asphalt shingle roof
- Exterior features: Level lot; Sidewalk, porch, deck, and gutters
Interior
- Kitchen: No specific kitchen appliance details provided
- Bedrooms: 5 bedrooms (total across the property)
- Flooring: No flooring details provided
- Bathrooms: 2 full bathrooms
- Heating & cooling: Hot water heat using natural gas; Extra insulation
- Interior features: Full, unfinished shared basement with storage and concrete floor; Attic with access via hatch; One fireplace; 11 total rooms
- Laundry & utility: Separate laundry hookups/areas for each unit; Basement laundry hook-ups
Neighborhood map
What this means for you Summary
Snapshot
- This is a 2 × 2-bed/1.0-bath units multifamily listed at $420k.
Deal economics
- At list price, monthly cash flow is $318 ($4k/yr) — positive. Per door: $159/mo.
- The deal already cash-flows at list — no discount required.
- To meet the 1% rule (rent ≥ 1% of price), the offer needs to be $382k (9.0% below list).
- Recommended offer: $382k (9.0% below list) — sets the bar for 1% rule.
Location & tenants
- Location reads 76/100 on livability (#58 in CT, #3,553 nationally) — a middle-class / working-renter tenant base. Strengths: amenities A+, commute A+, health & safety A+; Watch: schools D-, crime F, employment F.
- Hartford School District (urban): math 13% / reading 21% proficiency, ranked #150 of 153 in CT (top 98%) — low school quality limits family demand, transient renter base, plan for 1-2y turnover; 84% free/reduced lunch — lower-income household profile, screen leases tightly.
- Market conditions: Rents rising (+2.4%/yr); 62 active listings in the ZIP; 2 comparable units currently listed for rent nearby; 1,867 units permitted in Capitol Planning Region in 2024 (1,399 in 5+ unit buildings).
- At $3,824/mo this rent would consume 99% of the median local household income ($46k/yr) (locally 3400% of renters already pay >50% of income on rent) — very limited rent-growth headroom before tenants either downsize or default.
Forward outlook
- In year one you build about $9k of equity ($3k loan paydown + $6k appreciation (1.4% local appreciation)).
- At projected returns (1.4% appreciation + 2.4% rent growth), your $118k cash investment doubles in ~8 years — after that, you're playing with house money.
- By year 4, paydown + projected appreciation supports a ~$31k cash-out refi (75% LTV) — recoverable capital for the next deal without selling this one.
Negotiation context
- Only 6 days on market — expect competitive offers; lowballing is unlikely to land.
- Current owner paid $160k; list at $420k implies a 162% gain — meaningful room to come down on a strong offer.
Risks & watch-outs
- Watch-outs: built in 1925 — expect roof / HVAC / electrical / plumbing capex.
- Climate carrying-cost: major wind risk, 27% chance of damaging wind over 30y; extreme-heat days projected 7→16/yr by 2055 (HVAC capex compounding) — expect insurance premiums to compound above CPI over the hold.
Questions for the listing agent
- Can we see the unit-by-unit rent roll, current vacancy, and any below-market leases? What's the average tenancy length?
- What capital expenditures (roof, boiler, parking lot, exteriors) have been made in the last 5 years, and what's planned in the next 2?
- Built in 1925 — when were the roof, HVAC, electrical panel, plumbing, and water heater last replaced?
- Is there a deadline driving the sale (1031 exchange, divorce, estate, relocation)? That informs how much negotiation room exists.
- Schools are D-rated, which usually means shorter tenancies and higher turnover. Who's the typical renter profile here, and what's been the actual vacancy rate?
- Crime grade is F in this area — have there been break-ins, vandalism, or insurance claims at this property in the last 3 years? What carrier currently insures it and at what premium?
- What's the average days-on-market for RENTAL listings here right now (not sales)? A rising rental-DOM trend means longer vacancies and softer asking-rent achievability than the comps imply.
- What's the recent tenant-quality profile in this submarket — average credit score on applications, eviction rate, late-payment / NSF rate, and stable-employment percentage? A property-management company in the area should have these aggregated.
- How much new apartment / multifamily construction is in the pipeline within 1–3 miles? Heavy new supply (>2% of stock underway) typically softens rents 12–24 months out; light construction supports rent growth.
Investment metrics
- 1% rule
- 0.91% ✗
- Cap rate
- 7.20%
- Cash-on-cash
- 3.25%
- DSCR
- 1.14
- GRM
- 9.2
CMA / ARV
- ARV (median comp)
- $526,341
- List price
- $420,000
- Delta
- -20.20%
- Verdict
- UNDERPRICED
- Comps
- 2 within 1.0 mi
Projected returns pro-forma
1.38% appreciation · 2.37% rent growth · sell at horizon
- IRR
- 5.5%
- Equity multiple
- 1.28×
- Total profit
- $33,402
- Equity at exit
- $151,644
- IRR
- 9.1%
- Equity multiple
- 2.14×
- Total profit
- $133,729
- Equity at exit
- $208,072
Cash invested: $117,600 (down + closing). Projections, not guarantees.
Landlord ↔ Tenant lean methodology
- Overall (STATE)
- 27 Tenant-Leaning
- State Connecticut
- 27 Tenant-Leaning · D+7
- County
- — inherits STATE
- City
- — inherits STATE
ZIP-level market 06106
- Home prices YoY
- 0.4%
- Rents YoY
- 2.4%
- Active inventory
- 62
- Price-to-rent
- 18.3×
Monthly cashflow live
- Estimated rent
- $3,824 high interval (Pro) →
- Mortgage (P&I)
- −$2,203
- Tax from tax record
- −$325 /mo · $3,905/yr
- Insurance
- −$175
- HOA
- −$0
- Vacancy / Maint / Mgmt
- −$803
- Net cashflow
- $318
Break-even live
2-unit breakdown (identical units grouped — click to expand)
| Units | Beds | Baths | Est. rent |
|---|---|---|---|
| 2× units | 2 | 1 | $3,824 |
| #1 | 2 | 1 | $1,912 |
| #2 | 2 | 1 | $1,912 |
| Total (2 units) | $3,824 | ||
UW: 25.0% down · 7.5% · 30yr · 1.5% tax · 5.0% vac · 8.0% maint · 8.0% mgmt
Financing live
Cash to close
- Down payment
- $105,000
- Closing costs
- $12,600
- Reserves months
- —
- Total cash needed
- —
Loan-product check · same deal, 3 products live
Conventional
25% down · 7.5% · 30yr
- Down + closing
- —
- Monthly P&I
- —
- Monthly cashflow
- —
- DSCR
- —
- Eligible?
- —
Personal DTI + credit; lowest rate.
DSCR
20% down · 8.5% · 30yr
- Down + closing
- —
- Monthly P&I
- —
- Monthly cashflow
- —
- DSCR
- —
- Eligible?
- —
No personal income docs; deal must DSCR.
Hard money
10% down · 12.0% · 12mo
- Down + closing
- —
- Monthly P&I
- —
- Monthly cashflow
- —
- DSCR
- —
- Eligible?
- —
Short-term bridge; refi at stabilization.
Rent comps 2 comps
| Address | Beds | Baths | Sqft | Rent | $/sqft | DOM | Units | Dist |
|---|---|---|---|---|---|---|---|---|
| 97 Bates St Hartford, CT | 3.0 | 2.0 | 2240 | $2,900 | $1.29 | 1d | 1 | 0.51mi |
| 218 Grandview Ter Hartford, CT | 3.0 | 1.0 | 2648 | $2,000 | $0.76 | 23d | 1 | 0.60mi |
Listing history 4 events
-
2026-05-18status Under Contract 1205-char remark
-
2026-05-13$420,000 Active 1205-char remark
-
2026-05-08historical $420,000 1205-char remark
-
2025-03-17soldstatus $160,000
ⓘ Source: listings_history table (triggers on properties + properties_extension) + one-shot
backfill from property_details.listing_events for pre-trigger history.
Tax reassessment forecast CT · Partial reset (capped growth)
- Current annual tax
- $3,905 · $325/mo
- Projected year-2 tax
- $6,446 · $537/mo
- Expected delta
- +$2,542/yr (+$212/mo · 65.1%)
ⓘ Screening estimate from a state-policy table — verify with the county assessor before closing.
Climate risk First Street
- Flood 1/10 Low FEMA zone X (unshaded) · 0% chance over 30 yrs
- Wildfire 1/10 Low
- Heat 5/10 Major 7 d/yr ≥96°F today · 16 d/yr by 30 yrs out
- Wind 6/10 Major 27% chance of damaging wind over 30 yrs
- Air quality 3/10 Moderate 3 unhealthy d/yr today · 4 by 30 yrs out
Nearby sold comps map
Loading sold comps map…
Walkable amenities ~0.75 mi
Loading nearby amenities…
Taxation est. · year 1
- Rental income
- $45,888
- − Mortgage interest
- −$23,527
- − Property taxes
- −$3,905
- − Insurance
- −$2,100
- − Repairs & maintenance
- −$3,671
- − Management
- −$3,671
- − Depreciation
- −$12,218
- Taxable loss
- −$3,204
- Est. tax savings @ 24.0%
- +$769
- After-tax cash flow
- $4,585/yr
For passive investors: Depreciation is non-cash, so a rental often shows a tax loss while cash-flowing — sheltering income. Rental losses are passive: they offset passive income freely, and up to $25,000/yr can offset ordinary (W-2) income if you actively participate and your MAGI is under $100k (phasing out to $0 by $150k); unused losses carry forward. On sale, claimed depreciation is recaptured at up to 25%, and gains may owe capital-gains tax (a 1031 exchange can defer both). Figures are a year-1 estimate at your 24.0% rate — not tax advice; consult a CPA.
Schools (NCES district)
- District
- Hartford School District
- NCES district ID
- 0901920
- Math proficiency
- 13% ▼ -5.00%
- Reading proficiency
- 21% ▼ -6.00%
- Median HH income
- $30,521
- Composite
- 13.54/100
- National rank
- #9514
- State rank
- #150 of 153 in CT
Livability — Hartford
- Score
- 76/100
- State rank
- #58
- US rank
- #3553
Category grades
Schools grade is shown separately in the Schools card above.
Census & demographics
- Census place
- Hartford, CT
- County
- Hartford County · 754,208 people
- City population
- 121,162
- Metro
- Hartford-East Hartford-Middletown, CT
- Population (ZIP)
- 36,322
- Household income
- $46,304
- Rent vs Own
- Severe rent burden
- 3400.0
Population outlook (Capitol County) Hauer SSP2
- By 2040
- 1,063,519
Race, ethnicity, and origin ACS 2023
- Neighborhood character
- Diverse neighborhood (Simpson 0.58)
- Race & ethnicity
- Hispanic / Latino 60% Two or more races 25% Black 18% White 15% Asian 3%
- Hispanic origin (detail)
- Mexican 2% Puerto Rican 42% Dominican 6%
- Common ancestry
- Lithuanian 2% Russian 1% Romanian 1%
- Foreign-born
- 20% · Canada, Jamaica, China
- Languages at home
- 46% English-only · Spanish 47% Other Indo-European 3% Other Asian/Pacific 1%
Political lean MEDSL · Capitol
- 2024 margin
- Strong D (+21.9) · D 60.1% · R 38.2% · Other 1.7%
- All cycles
- 2024: D+21.9
Not yet ingested
- Civics
- —
Market trends
- HPI YoY
- ▲ 1.38%
- Current HPI
- 314.0899
- Rent YoY
- ▲ 2.37%
- Metro
- Hartford-East Hartford-Middletown, CT
- State GDP YoY
- ▲ 1.06%
- F500 in state
- 38
Industry mix (Fortune 500 HQ in CT)
| Industry | F500 HQs | Revenue |
|---|---|---|
| Industrial Machinery | 4 | $38B |
|
||
| Insurance | 3 | $71B |
|
||
| Financial Services | 2 | $25B |
|
||
| Transportation / Logistics | 2 | $18B |
|
||
| Healthcare | 1 | $247B |
|
||
| Telecommunications | 1 | $55B |
|
||
Price history
+162.5% since first listed4 events — show timeline
- 2026-05-18 Pending — Smart MLS
- 2026-05-13 Listed $420,000 Smart MLS
- 2026-05-08 Coming Soon $420,000 Smart MLS
- 2025-03-17 Sold (Public Records) $160,000 Public Records
Property tax history
+1.4%/yrLatest (2025): $3,905 · +0.0% YoY. Source: county tax records.
Cash-flow waterfall
monthlySold comps — $/sqft
last 12 mo · ≤1 miLoading sold comps…